


Five Problems with a Potential FTC Challenge to the Kroger/Albertsons Merger

Five Problems with a Potential FTC Challenge to the Kroger/Albertsons Merger

Executive Summary In October 2022, the Kroger Co. and Albertsons Cos. Inc. announced their intent to merge in a deal valued at $24.6 billion.[1] Given . . .

Executive Summary

In October 2022, the Kroger Co. and Albertsons Cos. Inc. announced their intent to merge in a deal valued at $24.6 billion.[1] Given the Federal Trade Commission’s (FTC) increasingly aggressive enforcement stance against mergers and acquisitions, as well as Chair Lina Khan’s previous writings on food retail specifically,[2] some commentators have expressed skepticism that the agency would allow the transaction to proceed—even with divestitures.[3] The FTC and U.S. Justice Department’s (DOJ) recently unveiled draft revisions to the agencies’ merger guidelines further suggest that the agencies plan to challenge more mergers—and to do so more aggressively than under past administrations.[4]

But attempting to block this transaction would go against the analytical framework the FTC has historically used to evaluate similar transactions, as well as the agency’s historical precedent of accepting divestures as a remedy to address localized problems where they arise. Such breaks with the past sometimes happen; our understanding of the law and economics evolves. Unfortunately, these likely breaks from tradition would reflect a failure to consider relevant and significant changes in how consumers shop for food and groceries in today’s world.

The FTC has a long history of assessing retail mergers in a manner significantly at odds with the aggressive approach it is currently signaling. Only one supermarket merger has been challenged in court since American Store’s acquisition of Lucky Stores in 1988: the Whole Foods/Wild Oats merger in 2007.[5] Over the last 35 years, the FTC has allowed every other supermarket merger and most retail-store transactions to proceed with divestitures. Within the last two years alone, these have included Tractor Supply/Orschlein and 7-Eleven/Speedway.[6] The FTC’s historic approach recognizes the reality that competitive concerns regarding supermarket mergers can be readily and adequately remedied by divestitures in geographic markets of concern; indeed, even Whole Foods/Wild Oats was ultimately resolved with a divestiture agreement following a fractured circuit court decision.[7]

The retail food and grocery landscape has changed dramatically since American/Lucky and Whole Foods/Wild Oats. With the growth of wholesale clubs, delivery services, e-commerce, and other retail formats, the industry is no longer dominated by traditional supermarkets. In addition, these changing dynamics have made geographic distance, traffic patterns, and population density decreasingly relevant in a consumer’s choice of where they purchase food and groceries. Today, Kroger is only the fourth-largest food and grocery retailer in the United States, behind Walmart, Amazon, and Costco. If the merger goes through, the combined firm will move into third place in market share, but would still account for just 9% of nationwide sales.[8]

The upshot is that the food and grocery industry is arguably as competitive as it has ever been. Unfortunately, recent developments suggest the FTC may well ignore or dismiss the economic realities of this rapid transformation of the food and grocery industry, substituting instead the outdated approach to market definition and industry concentration signaled by the draft guidelines.[9]

Against this backdrop, our brief highlights five important areas where both the commission and commentators’ stances appear to run headlong into legal precedent that mandates an evidence-based approach to merger review, even as the best available evidence points to a dynamic and competitive grocery industry. The correct understanding of the law and the industry appears entirely at odds with a challenge to the proposed merger.

A.      The FTC’s Merger-Enforcement Policy Is on a Collision Course with the Law

The Kroger/Albertsons merger proceeds against a backdrop of tough merger-enforcement rhetoric and actions from the FTC. Recent developments include the publication of aggressive revised merger guidelines, a string of cases brought to block seemingly benign mergers, process revisions burdening even unproblematic mergers, and FTC leadership’s contentious and expansive interpretation of the merger laws. The FTC’s ambition to remake U.S. merger law is likely to falter before the courts, but not before imposing a substantial tax on all corporate transactions—and, ultimately, on consumers.

B.      The Product Market Is Broader Than Supermarkets

Because of recent changes in market dynamics, it no longer makes sense to limit the relevant market to supermarkets alone. Rather, consumer behavior in the face of omnipresent wholesale clubs, e-commerce, and local delivery platforms significantly constrains supermarkets’ pricing decisions.

Recent FTC consent orders involving supermarket mergers have limited the relevant product market to local brick-and-mortar supermarkets and food and grocery sales at nearby hypermarkets (e.g., Walmart supercenters), while excluding wholesale-club stores (e.g., Costco), e-commerce (e.g., Amazon), and further-flung stores accessible through online-delivery platforms (e.g., Instacart). This is based on an assertion that the relevant market includes only those retail formats in which a consumer can purchase nearly all of a household’s weekly food and grocery needs from a single stop, at a single retailer, in the shopper’s neighborhood. This is, however, no longer how most of today’s consumers shop. Instead, shoppers purchase different bundles of groceries from multiple sources, often simultaneously.[10] This pattern has substantial implications for supermarkets’ competitive environment.

C.      Labor Monopsony Concerns Are Unlikely to Hold Up in Court

More than in any previous retail merger, opponents of the Kroger/Albertsons deal have raised the specter of potential monopsony power in labor markets. But these concerns reflect a manifestly unrealistic conception of labor-market competition. Fundamentally, the market for labor in the retail sector is extremely competitive, and workers have a wide range of alternative employment options—both in and out of the retail sector. At the same time, both Kroger and Albertsons are highly unionized, providing a counterbalance to any potential exercise of monopsony power by the merged firm.

D.     The Alleged ‘Waterbed Effect’ Is Not Borne Out by Evidence

Some critics of the merger have speculated that the merged company would be able to exercise monopsony power against its food and grocery suppliers (i.e., wholesalers and small manufacturers), often invoking an economic concept called the “waterbed effect.” The intuition is that the largest buyers may use their monopsony power to negotiate lower input prices from suppliers, leading the suppliers to make up the lost revenue by raising prices for their smaller, weaker buyers.

But these arguments are far from compelling. Much of the discussion of the waterbed effect focuses on harm to competing retailers, rather than consumers. But this is not the harm that U.S. antitrust law seeks to prevent. It is thus not surprising that at least one U.S. court has rejected waterbed-effect claims on grounds that there was no harm to consumers.

E.      Divestitures Historically Have Proven an Appropriate and Adequate Remedy

Historically, the FTC has allowed most grocery-store transactions to proceed with divestitures, such as Ahold/Delhaize (81 stores), Albertsons/Safeway (168 stores), and Price Chopper/Tops (12 stores). The extent of the remedies sought depends on the extent of post-merger competition in the relevant local markets, as well as the likelihood of significant entry by additional competitors into the relevant markets.

Despite a long history of divestitures serving as an appropriate and adequate remedy in supermarket mergers, some point to the Albertsons/Safeway merger divestitures to Haggen as evidence that divestitures are no longer an appropriate remedy. But several factors idiosyncratic to Haggen and its acquisition strategy led to the failure of that divestiture, and it does not properly stand for the claim that all supermarket divestitures are doomed. Any divestures associated with the Kroger-Albertsons merger should learn from the Haggen experience, rather than view it as justification to reject reasonable divestiture options that have worked for other mergers.

I.        The Agencies Are Trying to Rewrite Merger-Review Standards

The recently published FTC-DOJ draft merger guidelines are a particularly notable backdrop for the Kroger/Albertsons merger, leading many commentators to expect the FTC to take a hardline stance on the deal.[11] Merger case law, however, has not changed much in recent years. Given the merging parties’ apparent willingness to litigate the case, if necessary, the likelihood of a protracted legal battle seems high. As we explain below, at least at first sight, any case against the merger would appear to be largely built on sand, and the commission’s chances of succeeding in court appear slim.

The Clayton Act of 1914 grants the U.S. government authority to review and challenge mergers that may substantially lessen competition. The FTC and DOJ are the two antitrust agencies that share responsibility to enforce this law. Traditionally, the FTC investigates retail mergers, while the DOJ oversees other sectors, such as telecommunications, banking, and transportation.

Before the FTC and DOJ officials appointed by the current administration came into office, the settled practice was for the antitrust agencies to follow the 2010 Horizontal Merger Guidelines, which outline the analytical framework and evidence they use to evaluate mergers. The 2010 guidelines describe four major steps of merger analysis:

  1. The first step is to define the relevant product and geographic markets affected by the merger. The goal is to identify the set of products and regions that are close substitutes to the products and regions sold by the merging parties.
  2. The second step is to assess the competitive effects of the merger, or how the merger may harm competition in the defined markets.
  3. The third step is to examine the role of market entry as a potential counterbalance to the competitive effects of the merger. For entry to be sufficient to deter or undo the anticompetitive effects of a merger, it must be timely, likely, and sufficient in scale and scope.
  4. The fourth and final step is to evaluate the efficiencies generated by the merger, or how the merger may benefit consumers by reducing costs and improving quality.

The antitrust agencies weigh all these factors to determine whether a merger is likely to harm competition and consumers. If they find that a merger raises significant competitive concerns, they may seek to block it or require remedies such as divestitures or behavioral commitments from the merging parties.

Several factors, however, suggest that authorities are unlikely to follow this measured approach when reviewing the Kroger/Albertsons merger.

  • Primarily, the FTC and DOJ have recently issued draft revised merger guidelines. The 2023 guidelines have not yet been adopted and are currently open for public comment. Compared to the previous iteration, which guided recent consent decrees, the new guidelines contain more stringent structural presumptions—that is, a presumption that a merger that merely increases concentration (as all horizontal mergers do) by a certain amount violates the law, rather than a more nuanced economic analysis connecting specific market attributes to a likelihood of actual consumer harm.[12]
  • Although elements of the above framework are present in the new proposed guidelines, they also incorporate new language reflecting a persistent thumb on the scale that systematically undermines merging parties’ ability to justify their merger. For example, while a presumption of harm is triggered at a certain level of concentration (an HHI of 1800), in markets where there has previously been consolidation (over an unspecified timeframe), an impermissible “trend [toward concentration] can be established by… a steadily increasing HHI [that] exceeds 1,000 and rises toward 1,800.”[13] Traditionally, an HHI under 1500 would be considered “unconcentrated” and presumed to raise no competitive concerns.[14] The notion of a “trend” toward concentration raising particular concern hasn’t been reflected in guidelines since 1968,[15] and reached its apotheosis in Von’s Grocery in 1966[16]—one of the most thoroughly reviled merger cases in U.S. history.[17]
  • The FTC had already started to tighten its merger-enforcement policy before the draft revised guidelines were published. Among other actions, the agency brought high-profile cases against the Illumina/GRAIL, Meta/Within, and Microsoft/Activision Blizzard[18] So far, all three challenges have resulted in defeat for the FTC in adjudication. Taken together, these cases suggest the agency is willing to push the law beyond its limits in an attempt to limit corporate consolidation, whatever the actual competitive effect.
  • Finally, the FTC’s leadership has been particularly bearish about the potential consumer benefits of corporate mergers and acquisitions. This inclination is reflected in Chair Lina Khan’s assertion that the Clayton Act embodies a “broad mandate aimed at prohibiting mergers even when they do not constitute monopolization and even when their tendency to lessen competition is not certain.”[19]

All of these factors—in concert with the merging parties’ claim that they are prepared to go to court if the FTC decides to block the transaction outright—suggest that there is a particularly high likelihood that the Kroger/Albertsons merger will be challenged and litigated, rather than approved or challenged and settled.

For the reasons outlined in the following sections, however, the FTC is unlikely to prevail in court. The market overlaps between the merging parties are few and can be resolved by relatively straightforward divestiture remedies—which, even if disfavored by the agency, are routinely accepted by courts. Likewise, the FTC’s likely market definition and potential theories of harm pertaining to labor monopsony and purchasing power, more generally, appear speculative at best. The upshot is that the FTC’s desire to bring tougher merger enforcement appears to be on a collision course with the law as it is currently enforced by U.S. courts.

II.      The Relevant Market Is Broader Than Supermarkets

The retail food and grocery landscape has changed dramatically since the last litigated supermarket merger. Consumer-shopping behavior has shifted toward more frequent shopping trips across a wide variety of formats, which include warehouse clubs (e.g., Costco), e-commerce (e.g., Amazon), online delivery platforms (e.g., Instacart), limited-assortment stores (e.g., Trader Joe’s and Aldi), natural and organic markets (e.g., Whole Foods), and ethnic-specialty stores (e.g., H Mart), in addition to traditional supermarkets. Because of these enormous changes, the market definition assumed in previous FTC consent orders likely will be—and should be—challenged, given the empirical evidence. This issue brief focuses particularly on the growing importance of warehouse clubs and e-commerce (including online delivery platforms).

A.      Recent Trends in Retailing Have Upended the ‘Traditional’ Grocery Market Definition

The FTC is likely to define the relevant product market as supermarkets, which the agency has previously defined as retail stores that enable consumers to purchase all of their weekly food and grocery requirements during a single shopping visit. This market definition includes supermarkets within hypermarkets, such as Walmart supercenters, but excludes warehouse-club stores, such as Costco.[20] Prior consent orders omit any discussion of whether online retailers or delivery services should be included or excluded from the relevant market. This product-market definition has remained mostly unchanged—and mostly unchallenged—since the Ahold/Giant merger a quarter-century ago.[21]

The consent orders exclude warehouse-club stores—as well as hard discounters, limited-assortment stores, natural and organic markets, and ethnic-specialty stores—because these stores are asserted to “offer a more limited range of products and services than supermarkets and because they appeal to a distinct customer type.”[22] In addition, the orders indicate that “supermarkets do not view them as providing as significant or close competition as traditional supermarkets.”[23] Both claims are wrong.

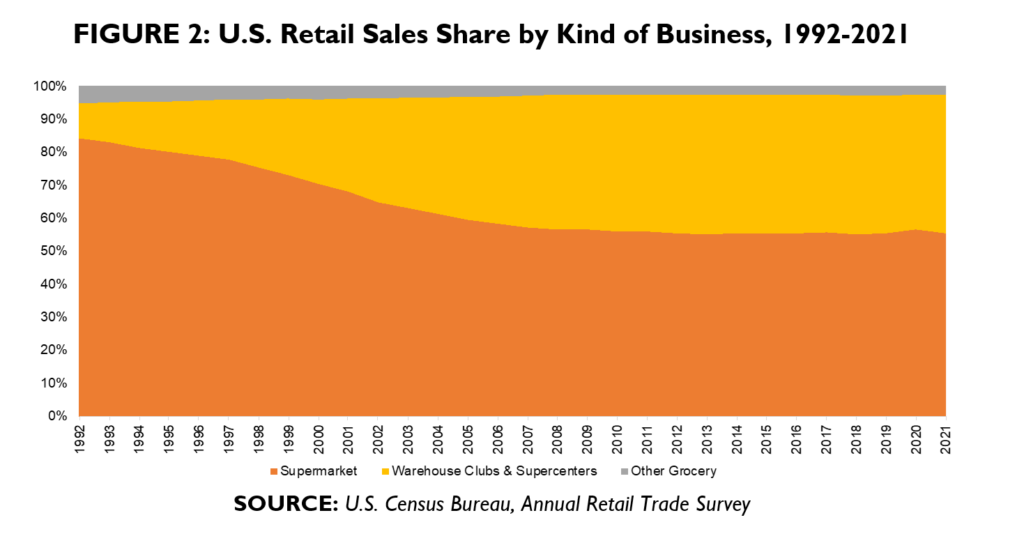
Figure 1 shows that retail sales by supermarkets, warehouse clubs, supercenters, and other grocery stores have been relatively stable at 5-6% of U.S. gross domestic product (GDP).[24] Figure 2 shows that supermarkets’ share of retail sales dropped sharply from the early 1990s through the mid-2000s, with that share shifting to warehouse clubs and supercenters. These figures are consistent with the conclusion that warehouse clubs and supercenters successfully compete against traditional grocery stores. Indeed, it would be reasonable to conclude that the rise of warehouse clubs and supercenters at the expense of traditional supermarkets is one of the most significant long-run trends in retail.
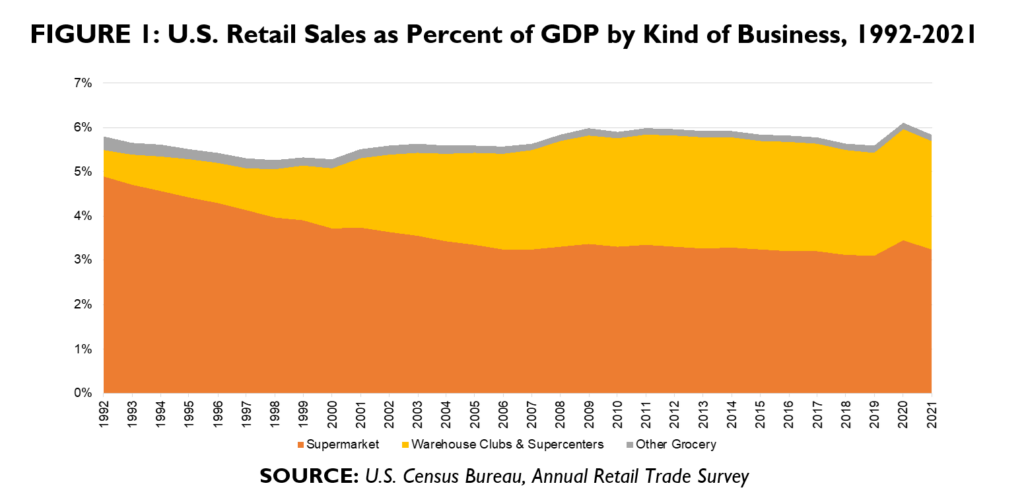
The retail food and grocery industry has changed dramatically. Below, we note that the average consumer shops for food and groceries more than once a week and shops at more than one retail format in a given week. Since the Ahold/Giant merger in 1998, warehouse clubs and supercenters have doubled their share of retail sales, while supermarkets’ share has dropped by more than 25% (Figure 2). Over the same period, online shopping and home delivery has also greatly changed the market.[25]
Based on these observations, the product-market definition that the FTC has employed in its consent orders over more than two decades is likely to be—and should be—challenged to include warehouse clubs, in addition to accounting for online retail and delivery.

B.      The Once-a-Week Shopper Is No Longer the Norm

In the past, the FTC has specified that, for a firm to be in the relevant market of “supermarkets,” it must be able to “enable[e] consumers to purchase substantially all of their weekly food and grocery shopping requirements in a single shopping visit.”[26] This definition suffers from several deficiencies.

The first deficiency is that this hypothetical consumer behavior is at odds with how many or most consumers behave today.

  • Surveys conducted by the Food Marketing Institute and The Hartman Group report the average shopper makes 1.6 weekly trips to buy groceries.[27]
  • Surveys conducted by Drive Research show the average household makes an average of 8.1 grocery shopping trips a month, or around two trips a week.[28]

There is no evidence that consumers view retailers who provide one-stop-shopping for an entire week’s food and grocery needs as distinct from other retailers who provide food and groceries. In fact, evidence suggests that many consumers “multi-home” across several different retail categories.

  • Survey data published by Drive Research indicate that many households spread their shopping across grocery stores, mass merchants, warehouse clubs, independent grocery stores, natural and specialty grocery stores, dollar stores, and online retailers.[29]
  • Acosta, a sales and marketing consulting firm, reports that 76% of consumers shop at more than one retailer a week and about one-third “retail hop” among three or more retailers a week for groceries and staples.[30]
  • Research from the University of Florida that found, in 2017, an average consumer visited 3.2 to 4.3 different formats of food outlets a month, depending on income level.[31]

Thus, even if one-stop weekly food and grocery shopping at single retailers was once typical, the evidence indicates such a phenomenon is much less common today.

C.      Supermarkets Compete with Warehouse Clubs

The FTC’s consent orders provide four reasons to exclude warehouse clubs from the relevant market that includes supermarkets:

  1. They offer a “more limited range of products and services” than supermarkets;
  2. They “appeal to a distinct customer type” from supermarket customers;
  3. Shoppers do not view warehouse clubs as “adequate substitutes for supermarkets;” and
  4. Supermarkets do not view warehouse clubs as “significant or close competition,” relative to other supermarkets.[32]

In contrast to these conclusions, there is widespread recognition that warehouse clubs impose significant competitive pressure on supermarkets. Indeed, the evidence indicates that supermarkets do consider wholesale clubs to be competitors and vice versa.[33]

  • The National Academies of Sciences concludes that, over time, the entry and growth of warehouse clubs, superstores, and online retail has “blurred” the distinctions between retail formats.[34] More importantly for merger-review analysis, the National Academies concludes the retail sector is “highly competitive,” in part because of the entry and growth of warehouse clubs, superstores, and online retail.[35]
  • Based on their empirical analysis, Paul Ellickson and co-authors conclude that warehouse clubs are “relevant substitutes” for supermarkets, even when the club stores are outside the geographic area typically used by the FTC in merger reviews.[36]
  • Prior to her appointment as FTC chair, Lina Khan and her co-author concluded that competition from warehouse clubs “fueled” grocery mergers in the late 1990s.[37]

The FTC’s consent orders note that warehouse clubs offer a “more limited range of products and services” than supermarkets. The orders identify products sold at supermarket as “including, but not limited to, fresh meat, dairy products, frozen foods, beverages, bakery goods, dry groceries, detergents, and health and beauty products.”[38] The annual reports for Costco, Walmart (Sam’s Club), and BJ’s, however, indicate each company offers the same range of products the FTC consent orders identify as being offered by supermarkets. If warehouse clubs offer similar products, see themselves as competing with supermarkets, and customers view them as substitutes, warehouse clubs must be in the same market.[39]

D.     E-Commerce Has Changed the Food Landscape

Since the Ahold/Giant merger in 1998, online shopping and home delivery have grown from niche services serving only 10,000 households nationwide to a landscape where approximately one-in-eight consumers purchase groceries “exclusively” or “mostly” online.[40] This shift has increased competition and innovation in the supermarket industry, as traditional supermarkets have adapted to changing consumer preferences and behaviors by offering more delivery and pickup options, expanding their online assortments, and enhancing their digital capabilities.[41] Some have invested in their own e-commerce platforms and many have partnered with such third-party providers as Instacart, Shipt, and Peapod.[42]

One might surmise that e-commerce simply replaced in-person shopping, but with the same stores competing. This is not what has happened. E-commerce has also increased competition by bringing in new companies with which traditional stores need to compete (e.g., Amazon) and by increasing the options available to consumers through services like Instacart, which allow for direct price and product comparisons among many stores. Each of these innovations has blurred the lines between brick-and-mortar food and grocery retailers and e-commerce, as well as the lines between supermarkets and other retail formats.

In addition, the rapid growth of e-commerce and delivery services make distance, traffic patterns, and population density decreasingly relevant in a consumer’s choice of where they purchase food and groceries. Dimitropoulos and co-authors note (1) the presence of warehouse clubs expands the relevant geographic market, (2) online delivery options expand the geographic market “far away,” and (3) online food and grocery purchases can be delivered from fulfilment centers, as well as from traditional stores.[43]

Because of these observations, the product market-definition that has been employed in the FTC’s consent orders over more than two decades is likely to be—and should be—challenged to include warehouse clubs and to account for online retail and delivery.

III.    The Merger Is Unlikely to Increase Labor Monopsony Power

In recent years, there has been more and more emphasis in antitrust discussions placed on labor markets and possible harms to workers. The recent draft merger guidelines added an explicit section on mergers that “May Substantially Lessen Competition for Workers or Other Sellers.”[44] Before the guidelines even, some writers predicted the FTC will push a case on labor competition.[45] While, in theory, antitrust harms can occur in labor markets, just as in product markets, proving that harm is more difficult.

An important fact about this merger is that both companies have many unionized workers. Around two-thirds of Kroger employees[46] and a majority of Albertsons employees[47] are part of the United Food and Commercial Workers International Union (UFCW), a union representing 1.3 million members. Even if the merger would increase labor monopsony power in the absence of unions, the FTC will have to acknowledge the reality of the unions’ own bargaining power.

Delegates of the UFCW unanimously voted to oppose the merger. [48] Rather than monopsony power or lower wages, however, the union’s stated reason for their opposition was lack of transparency.[49] While lack of transparency may be problematic for the UFCW members, it does not constitute an antitrust harm. Kroger, on the other hand, has contended that the merger will benefit employees, citing a commitment to invest an additional $1 billion toward increased wages and expanded benefits, starting from the day the deal closes.[50] As with most announced goals, however, there is no enforcement mechanism for this commitment at present, although one could be litigated.

Rather than relying on proclamations from any of the parties, we need economic analysis of the relevant labor markets, asking the types of questions raised above surrounding the output markets. A policy report from Economic Policy Institute estimates that “workers stand to lose over $300 million annually” from the merger.[51] But the report uses an estimate of the correlation between concentration (HHI) in labor markets and wages to arrive at that estimate. While academic research may benefit from such an estimate, it is unhelpful in merger analysis. As a long list of prominent antitrust economists recently wrote, “regressions of price on HHI should not be used in merger review… [A] regression of price on the HHI does not recover a causal effect that could inform the likely competitive effects of a merger.”[52]

Any labor case would require showing the merger would harm workers by reducing their bargaining power. For most workers involved, there are still many potential employers competing. While the exact job-to-job switches are unknown, press releases during the pandemic highlighted how Kroger was hiring workers from a wide variety of companies and industries—from hospitality (Marriott International) to restaurants (Waffle House) to food distribution (Sysco).[53] While there are no publicly available data on worker flows between different companies, economist Kevin Murphy explained that if you ask “where do people go when they leave, often you’ll find no more than 5 percent of them go to any one firm, that they go all over the place. And some go in the same industry. Some go in other industries.”[54]

If, as is likely, an overwhelming majority of Kroger’s workers’ next best option (what they would do if a store closed) was not an Albertsons store but something completely outside of food and grocery stores, the merger would not take away those workers’ next best option. If true, the merger cannot be said to increase labor monopsony power to the extent necessary to justify blocking a merger.

IV.    ‘Waterbed Effects’ Are Highly Speculative

One antitrust harm that has been discussed frequently in recent years is the so-called “waterbed effect,” in which “price reductions are negotiated with suppliers by larger buyers and result in higher prices being charged by suppliers to smaller buyers.”[55] The waterbed effect is not unique to mergers but can apply any time there is differential buyer-market power. The firm with more market power gets a good deal and its competitors are harmed. Long before the proposed merger, but still in the context of retail, people were writing about the waterbed effect of Walmart.[56]

In the context of the Kroger/Albertsons merger, critics have again raised the possibility of a waterbed effect. Michael Needler Jr.—the president and chief executive of Fresh Encounter, a chain of 98 grocery stores based in Findlay, Ohio—raised the possibility in a U.S. Senate hearing on the merger.[57] He was also quoted by The New York Times, saying:

When the large power buyers demand full orders, on time and at the lowest cost, it effectively causes the water-bed effect. They push down, and the consumer packaged goods companies have no option but to supply them at their demands, leaving rural stores with higher costs and less availability to products.[58]

In a letter to the FTC, the American Antitrust Institute raised several concerns about the merger and argued that:

The waterbed effect is likely to worsen with Kroger-Albertsons enhanced buyer power post-merger, with adverse effects on the ability of independent grocers to compete in a tighter oligopoly of large grocery chains.[59]

If there is a waterbed effect, some firms will have lower wholesale prices, and some will have higher prices. Both will be partially passed on to consumers. While no doubt frustrating for small retailers, it is unclear whether competing for lower prices and more attention is a normal part of the competitive process, or whether it is anticompetitive, and policy could be used stop it. For example, if one firm is easier to deal with—either because they are more efficient or just more pleasant to interact with—sellers will switch to that firm and correspondingly demand higher returns from the other buyers. Moreover, even if we identify differential prices because of a waterbed effect, it would not imply that there has been any harm to consumers.[60]

While the waterbed theory has attracted the interest of some academics and policymakers, its relevance for antitrust is a different matter. There is a reason that courts have been skeptical. In particular, the court noted that the harms associated with the waterbed theory are borne by competing firms, rather than consumers or competition writ large.[61] Moreover, the court observed that actions taken by firms to avoid any possible harms from a hypothesized waterbed effect (e.g., by purchasing inputs from alternative suppliers) demonstrates a lack of—rather than presence of—monopsony power. The United Kingdom competition authority has evaluated “waterbed effect” allegations in at least two supermarket mergers and found no evidence indicating any anticipated effects of the mergers on input prices that would harm consumers.[62]

V.      Remedies Can Solve Any Remaining Competitive Concerns

While the above sections argue that the FTC will have a hard time making a case that the merger is anticompetitive overall, there may be some specific geographic markets where concerns remain. In the face of such concerns, the FTC historically has allowed most supermarket transactions to proceed with divestitures, such as Ahold/Delhaize (81 stores), Albertsons/Safeway (168 stores), and Price Chopper/Tops (12 stores).[63] The extent of the remedies sought depends on the extent of post-merger competition in the relevant markets, as well as the likelihood of entry by additional competitors.[64] Dimitropoulos and coauthors noted that most divestitures required by recent consent orders in recent supermarket mergers have occurred in geographic markets with fewer than five remaining competitors.[65]

In recent merger consent orders, divested stores have been acquired by both retail supermarkets and wholesalers with retail outlets, including Publix, Supervalu, Big Y, Weis, Associated Wholesale Grocers, Associated Food Stores, and C&S Wholesale Grocers.[66] Several of these companies have been expanding—in some cases outside of their “home” territories. For example, Publix is a Florida-based chain that operates nearly 1,350 stores in seven southeastern states.[67] Publix expanded to North Carolina in 2014, Virginia in 2017, and has announced plans to expand into Kentucky this year.[68] Weis Markets is a Pennsylvania-based chain that operates more than 200 stores in seven northeastern states.[69] Last year, the company announced plans to spend more than $150 million on projects, including new retail locations and upgrades to existing facilities.[70] There are also many smaller stores that have proven successful and possible candidates for a few stores. For example, Rochester, New York-based Wegmans has entered Washington, D.C., Delaware, and Virginia over recent years.[71]

A.      The Haggen Divestiture Can Be Avoided

Despite a long history of divestitures serving as an appropriate and adequate remedy in supermarket mergers, some point to the Albertsons/Safeway merger divestitures to Haggen as evidence that divestitures are no longer an appropriate remedy.[72] But several factors idiosyncratic to Haggen and its acquisition strategy led to failure, rather than the divestiture itself.

In 2014, the parent company of Albertsons announced plans to purchase rival food and grocery chain Safeway for $9.4 billion. During its merger review, the FTC identified 130 local markets in western and mid-western states where it alleged the merger would be anticompetitive.[73] In response, Albertsons and Safeway agreed to divest 168 supermarkets in those geographic markets.[74] Haggen Holdings LLC was the largest buyer of the divested stores, acquiring 146 Albertsons and Safeway stores in Arizona, California, Nevada, Oregon, and Washington.

Following its acquisition of the divested stores, Haggen almost immediately encountered numerous problems at the converted stores. Consumers complained of high prices, and sales plummeted at some stores. The company struggled and began selling some of its stores. Less than a year after the FTC announced the divestiture agreement, Haggen filed for bankruptcy. Following the bankruptcy, Albertsons bought back 33 of the stores it had divested in its merger with Safeway.

Unique factors indicate Haggen may not have been an appropriate buyer for the divested stores. Before acquiring the divested stores, Haggen was a small regional chain with only 18 stores, mostly in Washington State. The acquisition represented a ten-fold increase in the number of stores the company would operate. While Haggen was once an independent family-owned firm, when it acquired the divested stores, the company was owned by a private investment firm that used a sale-leaseback scheme to finance the purchase. Christopher Wetzel notes that Haggen failed to invest sufficiently in the marketing necessary to create brand awareness in regions where Haggen had not previously operated.[75] Such issues would need to be avoided in any future divestitures; experience shows they can be.

The problems with the Haggen divestiture need not be repeated. As explained above, there are many companies of various sizes that have the capabilities and desire to expand. While the relevant product and geographic markets for supermarket mergers has shifted enormously over the past few decades, divestitures remain an appropriate and adequate remedy for any competitive concerns. The FTC has knowledge and experience with divestiture remedies and should have a good understanding of what works. In particular, firms acquiring divested assets should have an adequate cushion of capital, experience with the market conditions in which the stores are located, and the operational and marketing expertise to transition customers through the change.

[1] Press Release, Kroger and Albertsons Companies Announce Definitive Merger Agreement, Kroger (Oct. 14, 2022), https://ir.kroger.com/CorporateProfile/press-releases/press-release/2022/Kroger-and-Albertsons-Companies-Announce-Definitive-Merger-Agreement/default.aspx.

[2] In an article written with Sandeep Vaheesan before she became chair of the FTC, Lina Khan expressed disdain for grocery-industry consolidation and deep skepticism of even the best divestiture packages. See Lina Khan & Sandeep Vaheesan, Market Power and Inequality: The Antitrust Counterrevolution and Its Discontents, 11 Harv. L. & Pol’y Rev. 235, 254 (2017) (“Retail consolidation has enabled firms to squeeze their suppliers… and led to worse outcomes for consumers.”) & 289 (“Even if divestitures could be perfectly tailored and if they preserved competition in narrow markets in every instance, they would fail to advance the citizen interest standard.”).

[3] See, e.g., David Dayen, Proposed Kroger-Albertsons Merger Would Create a Grocery Giant, The American Prospect (Oct. 17, 2022), https://prospect.org/power/proposed-kroger-albertsons-merger-would-create-grocery-giant; Richard Smoley, Kroger, Albertsons, and Lina Khan, Blue Book Services (May 2, 2023), https://www.producebluebook.com/2023/05/02/kroger-albertsons-and-lina-khan.

[4] U.S. Dep’t of Justice & Fed. Trade Comm’n, Draft Merger Guidelines (Jul. 19, 2023), available at https://www.justice.gov/d9/2023-07/2023-draft-merger-guidelines_0.pdf. See also Gus Hurwitz & Geoffrey Manne, Antitrust Regulation by Intimidation, Wall St. J. (Jul. 24, 2023), https://www.wsj.com/articles/antitrust-regulation-by-intimidation-khan-kanter-case-law-courts-merger-27f610d9.

[5] Prior to Whole Foods/Wild Oats, the last litigated supermarket merger was the State of California’s 1988 challenge to American Store’s acquisition of Lucky Stores. Several retail mergers have been challenged in court, however, such as Staples/Office Depot in 2015. See Press Release, FTC Challenges Proposed Merger of Staples, Inc. and Office Depot, Inc., Federal Trade Commission (Dec. 7, 2015), https://www.ftc.gov/news-events/news/press-releases/2015/12/ftc-challenges-proposed-merger-staples-inc-office-depot-inc.

[6] This includes approving Albertsons/Safeway (2015), Ahold/Delhaize (2016), and Price Chopper/Tops (2022). See Analysis of Agreement Containing Consent Order to Aid Public Comment, In the Matter of Cerberus Institutional Partners V, L.P., AB Acquisition, LLC, and Safeway Inc. (File No. 141 0108) (Jan. 27, 2015) available at https://www.ftc.gov/system/files/documents/cases/150127cereberusfrn.pdf; Analysis of Agreement Containing Consent Order to Aid Public Comment, In the Matter of Koninklijke Ahold N.V. and Delhaize Group NV/SA (File No. 151-0175) (Jul. 22, 2016), available at https://www.ftc.gov/system/files/documents/cases/160722koninklijkeanalysis.pdf;  Analysis of Agreement Containing Consent Order to Aid Public Comment, In the Matter of The Golub Corporation and Tops Markets Corporation (File No. 211-0002, Docket No. C-4753) (Nov. 8, 2021), available at https://www.ftc.gov/system/files/documents/cases/2110002pricechoppertopsaapc.pdf.

[7] Decision and Order, In the Matter of Whole Foods Market, Inc., (Docket No. 9324) (May 28, 2009), available at https://www.ftc.gov/sites/default/files/documents/cases/2009/05/090529wfdo.pdf; FTC v. Whole Foods Market, 548 F.3d 1028 (D.C. Cir. 2008).

[8] Number based on authors’ calculations, using data from Progressive Grocer Staff, 90th Annual Report, Progressive Grocer (May 2023), https://progressivegrocer.com/crossroads-progressive-grocers-90th-annual-report.

[9] U.S. Dep’t of Justice & Fed. Trade Comm’n, supra note 44.

[10] See, e.g., George Kuhn, Grocery Shopping Consumer Segmentation, Drive Research (2002), available at https://www.driveresearch.com/media/4725/final-2022-grocery-segmentation-report.pdf.

[11] Supra note 3.

[12] For instance, the Herfindahl–Hirschman Index (HHI) at which mergers are deemed problematic has been lowered from 2500 (and a post-merger increase of 200) to 1800 (and a post-merger increase of 100). Likewise, combined market shares of more than 30% are generally deemed problematic under the new guidelines (if a merger also increase the market’s HHI by 100 or more). The revised guidelines also focus more heavily on monopsony and labor-market issues. See U.S. Dep’t of Justice & Fed. Trade Comm’n, supra note 4, at 6-7.

[13] Id. at 21.

[14] See U.S. Dep’t of Justice & Fed. Trade Comm’n, 2010 Horizontal Merger Guidelines (Aug. 19, 2010) at §5.3 , available at https://www.justice.gov/atr/horizontal-merger-guidelines-08192010#5c.

[15] See U.S. Dep’t of Justice, Merger Guidelines (1968) at 6-7, available at https://www.justice.gov/archives/atr/1968-merger-guidelines.

[16] United States v. Von’s Grocery Co., 384 U.S. 270 (1966).

[17] See, e.g., Robert H. Bork, The Goals of Antitrust Policy, 57 Am. Econ. Rev. Papers & Proceedings 242 (1967) (“In the Von’s Grocery case a majority of the Supreme Court was willing to outlaw a merger which did not conceivably threaten consumers in order to help preserve small groceries in the Los Angeles area against the superior efficiency of the chains.”)

[18] FTC v. Illumina, Inc., U.S. Dist. LEXIS 75172 (2021); FTC v. Meta Platforms Inc., U.S. Dist. LEXIS 29832 (2023); FTC v. Microsoft Corporation et al., No. 23-cv-02880-JSC (N.D. Cal. Jul. 10, 2023), available at https://s3.documentcloud.org/documents/23870711/ftc-v-microsoft-preliminary-injunction-opinion.pdf.

[19] Lina M. Khan, Rohit Chopra, & Kelly Slaughter, Comm’rs, Fed. Trade Comm’n, Statement on the Withdrawal of the Vertical Merger Guidelines (Sep. 15, 2021) at 3, available at https://www.ftc.gov/system/files/documents/public_statements/1596396/statement_of_chair_lina_m_khan_commissioner_rohit_chopra_and_commissioner_rebecca_kelly_slaughter_on.pdf.

[20] In this paper, the terms “hypermarket” and “supercenter” are used synonymously. See Richard Volpe, Annemarie Kuhns, & Ted Jaenicke, Store Formats and Patterns in Household Grocery Purchases, Economic Research Service, Economic Information Bulletin No. 167 (Mar. 2017), https://www.ers.usda.gov/webdocs/publications/82929/eib-167.pdf?v=0 (supercenters are also known as hypermarkets or superstores).

[21] Fed. Trade Comm’n, supra note 6.

[22] Id.

[23] Id.

[24] Data obtained from: U.S. Census Bureau, Report on Retail Sales and Trends: Annual Retail Trade Survey: 2021, https://www.census.gov/data/tables/2021/econ/arts/annual-report.html.

[25] Id.

[26] FTC, supra note 6.

[27] Food Marketing Institute & The Hartman Group, Consumers’ Weekly Grocery Shopping Trips in the United States from 2006 to 2022 (Average Weekly Trips per Household), Statista (May 2022), available at https://www.statista.com/statistics/251728/weekly-number-of-us-grocery-shopping-trips-per-household.

[28] Kuhn, supra note 10.

[29] Id.

[30] Trip Drivers: Top Influencers Driving Shopper Traffic, Acosta (2017), available at https://acostastorage.blob.core.windows.net/uploads/prod/newsroom/publication_phetw_0rzq.pdf.

[31] Lijun Angelia Chen & Lisa House, US Food Shopper Trends in 2017, Univ. of Fla, IFAS Extension Pub. No. FE1126 (Dec. 7, 2022), https://edis.ifas.ufl.edu/publication/FE1126.

[32] FTC, supra note 6.

[33] See Paul B. Ellickson, Paul L.E. Grieco, & Oleksii Khvastunov, Measuring Competition in Spatial Retail, 51 RAND J. Econ. 189 (2020) (“[C]lub stores are able to draw revenue from a significantly larger geographic area than traditional grocers. Hence, club stores are relevant substitutes for grocery stores, even if they are located even several miles away, a fact that could easily be overlooked in an analysis in which stores are simply clustered by geographic market.”).

[34] National Academies of Sciences, Engineering, and Medicine, A Satellite Account to Measure the Retail Transformation: Organizational, Conceptual, and Data Foundations (2021), available at https://www.bls.gov/evaluation/a-satellite-account-to-measure-the-retail-transformation.pdf (“[T]he restructuring that started first with the warehouse clubs and superstores and then moved on to e-commerce has begun to blur the lines between the retail industry and several other sectors …”).

[35] Id. at 25 (“[C]hanges experienced by retail over the past few decades suggest that the sector is highly competitive and is undergoing substantial change and reorganization. As discussed earlier, the changes described involve warehouse clubs and superstores … e-commerce … digital goods, imports, and large firms …”).

[36] Paul B. Ellickson, Paul L.E. Grieco, & Oleksii Khvastunov, Measuring Competition in Spatial Retail, 51 RAND J. Econ. 189 (2020) (“Due to their size and attractiveness for larger purchases, club stores represent strong competitors to grocery stores even, when they are a significant distance away.”).

[37] Khan & Vaheesan, supra note 2, at 255 (“Grocers sought to bulk up in order to compete with the scale of warehouse clubs and large discount stores, fueling further mergers and leading many local grocers to close …”).

[38] FTC, supra note 6.

[39] Costco Wholesale Corporation, Annual Report (Form 10-K) (Aug. 28, 2022), https://www.sec.gov/ix?doc=/Archives/edgar/data/0000909832/000090983222000021/cost-20220828.htm; BJ’s Wholesale Club Holdings, Inc., Annual Report (Form 10-K) (Mar. 16, 2023), https://www.sec.gov/ix?doc=/Archives/edgar/data/1531152/000153115223000026/bj-20230128.htm; Walmart Inc., Annual Report (Form 10-K) (Mar. 27, 2023), https://www.sec.gov/ix?doc=/Archives/edgar/data/104169/000010416923000020/wmt-20230131.htm.

[40] Hean Tat Keh & Elain Shieh, Online Grocery Retailing: Success Factors and Potential Pitfalls, 44 Bus. Horizons 73 (Jul.-Aug., 2001); Appinio & Spryker, Share of Consumers Purchasing Groceries Online in the United States in 2022, by Channel, Statista (Sep. 2002).

[41] Navigating the Market Headwinds: The State of Grocery Retail 2022, McKinsey & Co. (May 2022), available at https://www.mckinsey.com/~/media/mckinsey/industries/retail/how%20we%20help%20clients/the%20state%20of%20grocery%20retail%202022%20north%20america/mck_state%20of%20grocery%20na_fullreport_v9.pdf.

[42] Id.; Dimitri Dimitropoulos, Renée M. Duplantis, & Loren K. Smith, Trends in Consumer Shopping Behavior and Their Implications for Retail Grocery Merger Reviews, CPI Antitrust Chron. (Dec. 2021), available at https://www.brattle.com/wp-content/uploads/2022/01/Trends-in-Consumer-Shopping-Behavior-and-their-Implications-for-Retail-Grocery-Merger-Review.pdf.

[43] Dimitropoulos, et al., supra note  (“Of course, adjustments to geographic market definition likely would need to be factored into the analysis, as club stores tend to have larger catchment areas than traditional grocery stores, and online delivery can reach as far away as can be travelled by truck from a central fulfilment center.”)

[44] U.S. Dep’t of Justice & Fed. Trade Comm’n, supra note 4 at 25-7.

[45] Maeve Sheehey & Dan Papscun, Kroger-Albertsons Merger Tests FTC’s Focus on Labor Competition, Bloomberg Law (Dec. 2, 2022) https://news.bloomberglaw.com/antitrust/kroger-albertsons-merger-tests-ftcs-focus-on-labor-competition.

[46] Kroger Union, UFCW, https://www.ufcw.org/actions/campaign/kroger-union (last accessed Jul. 26, 2023).

[47] Albertsons and Safeway Union, UFCW, https://www.ufcw.org/actions/campaign/albertsons-and-safeway-union (last accessed Jul. 26, 2023).

[48] Press Release, America’s Largest Union of Essential Grocery Workers Announces Opposition to Kroger and Albertsons Merger, UFCW (May 5, 2023), https://www.ufcw.org/press-releases/americas-largest-union-of-essential-grocery-workers-announces-opposition-to-kroger-and-albertsons-merger.

[49] Id. (“Given the lack of transparency and the impact a merger between two of the largest supermarket companies could have on essential workers – and the communities and customers they serve – the UFCW stands united in its opposition to the proposed Kroger and Albertsons merger”).

[50] Press Release, Kroger and Albertsons Companies Announce Definitive Merger Agreement, Kroger (Oct. 14, 2022), https://ir.kroger.com/CorporateProfile/press-releases/press-release/2022/Kroger-and-Albertsons-Companies-Announce-Definitive-Merger-Agreement/default.aspx.

[51] Ben Zipperer, Kroger-Albertsons Merger Will Harm Grocery Store Worker Wages, Economic Policy Institute (May 1, 2023), https://www.epi.org/publication/kroger-albertsons-merger.

[52] Nathan Miller et al., On the Misuse of Regressions of Price on the HHI in Merger Review, 10 J. Antitrust Enforcement 248 (2022), available at http://www.nathanhmiller.org/hhiregs.pdf.

[53] Press Release, The Kroger Family of Companies Provides New Career Opportunities to 100,000 Workers, Kroger (May 14, 2020), https://ir.kroger.com/CorporateProfile/press-releases/press-release/2020/The-Kroger-Family-of-Companies-Provides-New-Career-Opportunities-to-100000-Workers/default.aspx.

[54] Kevin Murphy, Transcript of Proceedings at the Public Workshop Held by the Antitrust Division of the United States Department of Justice (Sep. 23, 2019), at 19, available at https://www.justice.gov/atr/page/file/1209071/download.

[55] Roman Inderst & Tommaso M. Valletti, Buyer Power and the ‘Waterbed Effect’, CEIS Research Paper 107 (Feb. 21, 2014), at 2, https://ssrn.com/abstract=1113318.

[56] Albert Foer, Mr. Magoo Visits Wal-Mart: Finding the Right Lens for Antitrust, American Antitrust Institute Working Paper No. 06-07, https://papers.ssrn.com/sol3/papers.cfm?abstract_id=1103609.

[57] Michael Needler Jr., Senate Hearing on Kroger and Albertsons Grocery Store Chains, at 1:43:00, available at https://www.c-span.org/video/?524439-1/senate-hearing-kroger-albertsons-grocery-store-chains.

[58] Julie Creswell, Kroger-Albertsons Merger Faces Long Road Before Approval, New York Times (Jan. 23, 2023), https://www.nytimes.com/2023/01/23/business/kroger-albertsons-merger.html.

[59] Diana Moss, The American Antitrust Institute to the Honorable Lina M. Khan, American Antitrust Institute (Feb. 7, 2023), available at https://www.antitrustinstitute.org/wp-content/uploads/2023/02/Kroger-Albertsons_Ltr-to-FTC_2.7.23.pdf.

[60] For an explicit economic model of the waterbed effect, see Roman Inderst & Tommaso M. Valletti, Buyer Power and the ‘Waterbed Effect’ 59  J. Ind. Econ. 1 (2011).

[61] DeHoog v. Anheuser-Busch InBev, SA/NV, No. 1:15-CV-02250-CL, 2016 U.S. Dist. LEXIS 137759, at *13-16 (D. Or. July 22, 2016).

[62] Safeway Merger Report, UK Competition Commission (2003), available at https://webarchive.nationalarchives.gov.uk/ukgwa/20120119163858/http:/www.competition-commission.org.uk/inquiries/completed/2003/safeway/index.htm (“Overall, therefore, there is little evidence of an immediate or short-term ‘waterbed’ effect. … [O]ur surveys produced insufficient evidence on this point for us to conclude that any waterbed effect would be exacerbated by any of the mergers.”); Anticipated Merger between J Sainsbury PLC and ASDA Group Ltd: Summary of Final Report, UK Competition & Markets Authority (Apr. 25, 2019), available at https://assets.publishing.service.gov.uk/media/5cc1434ee5274a467a8dd482/Executive_summary.pdf  (“Overall, it seems unlikely that many retailers will raise their prices in response to the Merger; and even if some individual retailers do, the overall effect on UK households is unlikely to be negative. On that basis, our finding is that the Merger is unlikely to lead to customer harm through a waterbed effect.”).

[63] Supra note 6.

[64] See Dimitropoulos, et al., supra note 42.

[65] Id.

[66] Supra note 6.

[67] Publix, Facts and Figures (2023), https://corporate.publix.com/about-publix/company-overview/facts-figures.

[68] Caroline A., The History of Publix: Entering New States, The Publix Checkout (Jan. 4, 2018), https://blog.publix.com/publix/the-history-of-publix-entering-new-states; Press Release, Publix Breaks Ground on First Kentucky Store and Announces Third Location, Publix (Jun. 23, 2022), https://corporate.publix.com/newsroom/news-stories/publix-breaks-ground-on-first-kentucky-store-and-announces-third-location.

[69] Weis Markets, LinkedIn https://www.linkedin.com/company/weis-markets/about, (last accessed Jul. 26, 2023).

[70] Sam Silverstein, Weis Markets Unveils $150M Expansion and Upgrade Plan, Grocery Dive (May 2, 2022), https://www.grocerydive.com/news/weis-markets-unveils-150m-expansion-and-upgrade-plan/623015.

[71] Russell Redman, Wegmans lines up its next new store locations, Winsight Grocery Business (Dec. 1, 2022) https://www.winsightgrocerybusiness.com/retailers/wegmans-lines-its-next-new-store-locations.

[72] Dayen, supra note 3. (“As the Haggen affair makes clear, the whole idea of using conditions to allow high-level mergers and competition simultaneously has been a failure.”)

[73] Supra note 7.

[74] Id.

[75] Christopher A. Wetzel, Strict(er) Scrutiny: The Impact of Failed Divestitures on U.S. Merger Remedies, 64 Antitrust Bull. 341 (2019).


Source: SSRN
ICLE Issue Brief

Cultural Levies and the EU Audiovisual Market

The European Union has opened the door for national policymakers to expand preexisting policies to support or favor domestic content by placing new obligations on foreign streaming providers to invest in EU member states’ domestic markets. The risk, however, is that member states have such broad latitude in implementing these provisions that they stoke inflationary pressures that distort local content markets.

I.        Introduction

In the ever-evolving landscape of digital entertainment, European consumers enjoy a broad variety of viewing options, including substantial availability of non-European content offered by large international streaming services. This availability has raised red flags for some EU policymakers, however, who are concerned that the supply of and demand for domestic cultural products might suffer. Prompted by these concerns, the European Union has opened the door for national policymakers to expand preexisting policies to support or favor domestic content by placing new obligations on foreign streaming providers to invest in EU member states’ domestic markets. The risk, however, is that member states have such broad latitude in implementing these provisions that they stoke inflationary pressures that distort local content markets.

Amended in 2018, the EU Audiovisual Media Services Directive (AVMSD)[1] has two relevant provisions: 1. Article 13(1) sets a requirement that 30% of the works that on-demand audiovisual media service (“VOD”) providers carry be European in origin, and that these works be given those works prominent placement; and 2. Article 13(2) provides that member states may impose additional financial obligations on VOD providers and broadcasters (“media service providers”) based on the revenues these services generate in, or that are targeted toward, the member state’s territory, with the proceeds used to support the production of European works.

The second set of obligations, which depend on a member state enacting enabling legislation, can be pursued either through direct investment in the production of European works (sometimes with very prescriptive local language or independent producer sub-quotas, among other limitations), or through contributions to a national fund. Providers with no significant presence in a local market (i.e., with low turnover or an exceedingly small audience) are not typically subject to these obligations.      Member states also may waive such obligations where they would be impracticable or unjustified due to the nature or theme of the audiovisual media service in question.[2]

The AVMSD can thus be characterized as “a unique blend of the barrier lifting liberal market approach typical of the EU’s single market and classic protectionism stemming from a history of concern that American content and media services would dominate European screens, threatening its cultures and industries.”[3]

It is understandable, on many levels, why member states would want to ensure local production of cultural products.[4] The history of this sort of regulation in the EU and the basic economics underlying these schemes, however, both point to the risk of serious unintended consequences if lawmakers do not take market realities adequately into account.

II.      Previous Attempts to Ensure Cultural Production in the EU Audiovisual Market

The AVMSD amendments are part of a long history in the EU of regulating media distribution, with at least a partial eye toward culture-specific measures.[5] Although the EU has more recently been concerned with foreign streaming services, the early history of these regulations were focused on broadcast media. Under those different regulations, “EU institutions were required to take values such as cultural diversity into account. They also had to respect the fundamental contribution of public broadcasters to the ‘democratic, social and cultural needs of each society.’”[6]

Notably, pursuant to the Television without Frontiers Directive (TwFD) of 1989, member states were required to ensure that broadcasters reserve a minimum of 50% of television programming to European works and a minimum of 10% of either their transmission time or programming budgets to independent productions.[7]

Further, the previous version of the AVMSD (2010) imposed a general commitment for member states to ensure that VOD service providers promoted, “where practicable and by appropriate means,” the production of and the access to European works.[8] Such promotion could “relate, inter alia, to the financial contribution made by such services to the production and rights acquisition of European works or to the share and/or prominence of European works in the catalogue of programmes offered by the on-demand audiovisual media service.”[9]

Finally, member states are also permitted to sustain European audiovisual production through state aid (i.e., direct funding or tax incentives), which is considered an important tool in this regard by the European Commission. According to the Commission’s Communication on State Aid for Films and Audiovisual Works:

It is difficult for film producers to obtain a sufficient level of upfront commercial backing to put together a financial package so that production projects can proceed. The high risk associated with their businesses and projects, together with the perceived lack of profitability of the sector, make it dependent on State aid.[10]

Nonetheless, these efforts had not fully delivered the expected results. Notably, analysis of the European audiovisual market between 2011 and 2016 found that, while broadcasters met the requirements set in the AVMSD 2010 to reserve a proportional majority of their transmission time for European works, when it came to nonlinear media services, European works were significantly less present in the catalogues of VOD service providers and non-European audiovisual works dominated audience demand.[11] Against this background, the 2018 AVMSD provisions were introduced to better harmonize the treatment of traditional audiovisual players and VOD providers.[12]

Indeed, the European audiovisual market has been described as “a collection of diverse markets, with different languages, cultures and market sizes.”[13] In this sense, market factors (i.e., small market size and a limited number of companies) and linguistic and cultural differences make it more difficult to make profitable audiovisual content in Europe. Given that reality, the revised AVMSD aimed to provide member states with new opportunities to support their local audiovisual markets.

Earlier regulations were also not without side effects. Quotas have proven ineffective at ensuring cultural diversity and encouraging the circulation of European works. They also risk diminishing the quality of works and undermining the creation of a pan-European audiovisual industry.[14] Moreover, although the ultimate goal of cultural diversity should be achieved through promoting the production and distribution of European works,[15] these regulations encouraged the production of local works without adequately addressing pan-European distribution. That is, while member states would pour resources into creating new local works, they remained insufficiently committed to distributing the works of other member states. This caused an oversaturation in local markets and dried up opportunities for creators to generate revenue for their work across the EU.

National implementation of AVMSD Article 13(2) may duplicate this problem, insofar as it involves approaches that can promote “continued fragmentation” among EU member states, and “reinforce [] focus on production over circulation, and domestic over nonnational European works.”[16] Of course the AVMSD does not aim to do this, but is explicitly designed to promote European works generally. It is, instead, implicit in the design of the AVMSD, insofar as it empowers member states to determine how to impose national sub-quotas. The history noted above suggests that member states will continue to interpret these provisions in ways that preference national content rather than pan-European content, thus exacerbating the fragmentation problem.

Indeed, an analysis of the member states that have decided to introduce such measures suggests that these assessments have contributed to a highly fragmented regulatory framework, as the obligations differ significantly both in terms of form (i.e., levies, direct investments, or joint obligations for both levies and direct investment) and amount, ranging from 0.5% to 25% of VOD services’ revenues.[17] Further, as national policymakers have been interested primarily in protecting domestic works, rather than supporting nonnational European content, some member states have mandated sub-quotas that direct the total share of revenues disproportionately toward the promotion of national works. These new provisions, moreover, threaten to drive up the cost of local production and ultimately crowd out many smaller local producers.

III.    The Economics of the AVMSD Financial Obligations

As reported by the European Audiovisual Observatory,[18] and recently corroborated by the European Commission,[19] the quota requirement under Article 13(1) AVMSD 2018 is already essentially met. Despite ongoing concerns regarding difficulties in monitoring prominent placement on VOD services,[20] the share of European works in VOD catalogues currently amounts to between 32% and 37%.[21] Further, in transactional VOD services, there is no significant gap between the share of European works in catalogues and their share of promotion.[22]

While quota obligations originated in an era dominated by broadcast television, they have been extended over time to nonlinear services, where they have encountered a different set of challenges in securing compliance. Since the concept of “prime time” loses its essential meaning in nonlinear services as a tool to secure visibility of certain works, nonlinear providers rely on other measures of prominence. For example, some have created distinct platform categories to group European or domestic works or tags to ease search for those works.[23]

Significant doubts arise, however, about the effectiveness of Article 13(1) quotas to ensure cultural diversity and encourage the circulation of European works. Further, as previously mentioned, quotas may have the unintended consequences of lowering the quality of works and undermining the creation of a pan-European audiovisual industry.

But given that more dramatic problems can accompany poor implementation of the optional Article 13(2) AVMSD 2018, the remainder of this paper will consider the economic features of the latter, and offer recommendations for how member states should weigh the risks and benefits of various strategies to implement this provision.

A.      The Risks of Poor Article 13(2) Implementation

As noted above, Article 13(2) financial contribution requirements take several different forms. Member states can require some mixture of direct investment in local markets by VOD providers and/or mandate, by levies, contributions to national cultural funds. The former can take a number of forms, including co-production, direct development of content, or acquisition of existing rights.

It is useful to think of this scheme as a form of Pigouvian tax. Pigouvian taxes work by imposing a tax on activity that creates a negative externality.[24] The goal is to force producers to internalize the costs of the negative externality, rather than forcing society as a whole to bear those costs. Typically, a Pigouvian tax is levied directly on the externality itself.[25] A classic example is a tax imposed on the production of goods that create pollution or health harms, such as cigarettes. The goal of the tax is to increase the cost of producing harm such that, as a consequence, the final price of the goods will rise to a level that maximizes social benefits.

Here, the good in question is local-content production and the users/consumers in question are the producers of said content. The underlying presumption of the AVMSD seems to be that the operation of foreign streaming services displaces production and distribution of local content, and that this represents a negative externality for which foreign providers need to take account. In theory, at least, the financial obligations are intended to force VOD providers to internalize this cost.

Of course, this is not strictly a textbook case. Where member states require the tax to be directed into a national fund, it looks much more like a Pigouvian tax. Where providers are obligated to devote some percentage of their turnover directly to local production, it may look less so, depending on how those obligations are structured. Nonetheless, the basic dynamics of Article 13(2) are close enough for our purposes here.

To be clear, we do not believe that audiovisual products—whether local or foreign—should actually be regarded as harmful in the same ways that smoking or sugary foods are. But the utility of this example is to demonstrate the regulatory equivalence implicit in treating nonnational content as damaging to local cultures, particularly when local consumers have chosen to select that content.

Moreover, there is an obvious problem with the presumptions underlying the AVMSD that should serve as a limiting principle when considering possible implementation of Article 13(2). It should not be so readily assumed that foreign entities are actually or disproportionately displacing local content. The VOD providers have every incentive to provide local audiences whatever it is they want to consume, and evidence suggests that audiences demand local content.[26]

Indeed, this underlying reality points to a very real distortion that exceedingly high financial obligations can produce. If local content production is overstimulated, as was the case under earlier versions of the legislation, member states may drive up the prices for local production, while at the same time oversaturating local markets and providing little avenue for local creators to distribute and market their works more broadly.

IV.    Getting the Financial Obligations ‘Right’

Member states’ goal is to seek the best outcome for their audiovisual sectors. Even if we assume that a tax on VOD providers is necessary in some cases, that still leaves the questions of which cases and how much the tax should be. Without answers to those questions, there is little hope of achieving a socially beneficial tax assessment or of doing more than, at best, distorting local market signals or, at worst, undermining local audiovisual production. Thus, the EU and member states need to both continue and deepen their examinations of the state of the sector, identify any market failures, and address these with the regulatory tools at their disposal. If, as a result of this analysis, any financial obligations are to be put in place—which Article 13(2) AVMSD 2018 grants them the option to do, although it does not require it—then member states should tailor any such taxes to tackle the identified problems.

Indeed, implicit in the idea of Pigouvian taxes is the notion that we do not seek a costless end: there are always tradeoffs among competing goals. That is the very essence of using levies to mitigate externalities: there is some benefit that society is reaping, and some harm for which it has incorrectly accounted. Accounting for the harm will necessarily reduce some of the good.

One of the main problems that can arise with taxes of this type is the introduction of perverse incentives. As William Baumol noted of Pigouvian taxes:

[T]he appropriate price (compensation) to a user of a public good (victim of a public externality) is zero except, of course, for lump sum payments. Thus, perhaps, rather than saying there is no price that will yield an optimal quantity of a public good (externality), it may be more illuminating to say that a double price is required: a nonzero price (tax) to the supplier of the good, and a zero price to the consumer.[27]

In essence, treating a Pigouvian tax as a sort of transfer payment creates a system that encourages overconsumption of the public good. Thus, to the extent that member states mandate that foreign VOD providers contribute directly to local content production—that is, via direct payments to local content producers to produce more local content—we would expect an overproduction of such content.

Even with levies to mandate contributions to national funds, there will be some of this dynamic, although national authorities may be positioned to moderate the effect. National authorities face tradeoffs, insofar as any investments they make are, to some degree, uncoupled from organic demand. Thus, these national investments will generate at least some inefficiencies, to the extent that they divert investment from opportunities that would have otherwise been realized in the marketplace.

National authorities may, for instance, determine that there is little harm in having too many locally produced movies and television shows, particularly when digital storage is next to costless. But content does not spring into existence ex nihilo. It depends on the use of a vast array of scarce local labor and resources. In short, that means that financial obligations to contribute to local production can bid up the price of every resource involved in production, leading to fewer local producers being able to afford to compete. Eventually, this will make local production relatively more dependent on a smaller number of firms that can absorb the higher costs.

More broadly, these sorts of interventions also risk distorting investment by nonlocal firms in a way that discourages entry and encourages exit, thus resulting in overall less production than would have otherwise occurred without an intervention. This is particularly true to the extent that national authorities fail to consider the profitability of their investments. Over time, funding unprofitable projects will exacerbate this dynamic by making local production more reliant on subsidies (which, in effect, means that consumers are insufficiently interested in the product). Decoupled from demand, there will be an ever greater need to demand payment from nonlocal firms to prop up relatively unsuccessful local productions.

When these financial obligations go too far, they can create inflationary pressures that may dry up local production altogether. A recent study for the European Commission identifies “[i]ncreasing costs across the board, and in particular for costs on technical crew and creative talent” as principal risk factors for European audiovisual producers.[28] Financial obligations force streamers to demand more production. As the study observes, the resulting cost increases are “no surprise,” since “increased demand would normally increase supply, which would explain the inflated costs upstream.”[29]

In a world of normal production incentives, if a particular market reaches capacity and becomes expensive, the production community will shift to a different market in a different country to avoid the higher prices. To the extent that local content production remains (thanks to the financial-contribution  requirements), while the cost of production will go up, the actual volume of production might not increase very much.

In order to find the optimal level of contributions (that is, the level at which they minimally inflate local costs of production while maximally ensuring cultural production), authorities need to engage in an incremental learning process. In short, member states will need to discover a proper equilibrium that prevents the tax from instigating a cost spiral. This argues for regulatory caution. As Baumol further noted:

[S]uch a learning process always involves wastes and irreversabilities, just like the process of convergence of competitive prices to their equilibrium values in the absence of externalities. But if we follow the usual practice of assuming away these costs, one can show that the process may be expected to converge to the optimum, provided the equilibrium is unique and stable. That is, there is then nothing inherently different about gradually moving taxes and prices towards their equilibrium here, and the process of adjustment toward competitive equilibrium when there are no externalities.[30]

Thus, national authorities considering how to structure these obligations should bear in mind that: 1. There almost certainly will be some bidding up of prices; 2. At a certain point, the gains from trying to increase local content production will be swamped by these inflationary pressures; and 3. There is necessarily a learning process inherent in setting such financial obligations, owing to the serious danger of provoking a cost spiral.

V.      The Mirage of a ‘European Netflix’

Financial obligations imposed under Article 13(2) AVMSD 2018 may generate further unintended consequences.

As already illustrated, the extraordinary diversity of consumer preferences in, and resulting from, fragmentation of the European audiovisual market represents the main barrier to the circulation of European works. In particular, the significant linguistic and cultural differences that contribute to Europe’s celebrated cultural vibrancy also make it less feasible to treat Europe as a single      audiovisual market and more challenging to produce profitable content in Europe. The hurdles represented by language and cultural specificities have been confirmed by a recent study reporting that Netflix users have a strong preference for domestic productions.[31]

From this perspective, it is worth acknowledging, as noted in the literature, that “it took a U.S. player to develop a service that increased the pan-European circulation of audiovisual content and gave European audiences increased access to nonnational EU content, in an accessible and user-friendly manner.”[32]

Against this backdrop, Article 13(2) AVMSD 2018 may serve to further increase fragmentation of the European audiovisual market. Indeed, its implementation by some member states places greater emphasis on supporting domestic works than on supporting (nonnational) European content more broadly.

As a result, the AVMSD financial obligations provision will also preserve “a varied fabric” of European producers, making the emergence of European VOD service providers able to compete against foreign players on a level playing field even more unlikely.

VI.    Proceed with Care

Member states that have chosen to implement Article 13(2) have taken various approaches. Most of them have opted to introduce both direct investment obligations and levies to support a fund. Italy is the only country that has introduced a direct investment obligation as the sole option, while at least two member states (Germany and Poland) have introduced levies without any direct investment obligation thus far.[33]

Further fragmentation can be observed in disparities in the rates applied to turnover achieved in the respective member states. Even the base may sometimes differ. With regard to direct investment obligations, while some member states have employed fair measures, a handful have begun to impose steep obligations on VOD service providers.[34] On the more careful end are the Czech Republic, Netherlands, Portugal, Croatia, Spain, and Greece, which assess their direct investment obligations in the 1-5% range.[35] On the less careful end are countries like France (15%-25%) and Italy (18%-20%). With regard to indirect investment obligations, the rate is usually around 2%, with the exception of Denmark, Spain, Portugal, Romania, and France, where the rate is in the 4-6% range.[36]

The regulatory caution needed to avoid trapping local content-production industries in destructive cost spirals is embodied in the “proportionality principle,” which essentially requires that the costs of regulatory intervention not be disproportionate to the benefits sought.[37] Indeed, the risk of disproportionate implementation of Article 13(2) was so palpable to its drafters that they expressly mandated that any financial contribution required of a service provider “shall be proportionate.”

More data are needed to assess optimal financial contribution levels, but it appears highly risky to venture out as far on a limb as France and Italy have done. Assessing a total 20-25% financial obligation—whether in the form of a national fund levy or investment obligations on the turnover of multiple companies (some of them quite large)—in order to fund local production could easily have dramatic inflationary effects on local content markets.[38] Perhaps a large and wealthy country like France can absorb and offset some of these effects, but it would only be through heavy subsidization of the very industries the financial obligation otherwise threatens to destroy.

Moreover, this approach fails to deal with the distribution problems that these sorts of regulations have historically created in the EU. There is such a thing as too much content and too little distribution. Huge local catalogs can be generated and never adequately shared across member states. Indeed, as noted above, large VOD providers like Netflix have, to a large extent, actually solved this historical problem. Penalizing these providers for offering such solutions is a curious move.

An alternative approach, already pursued in some member states, is for local cultural authorities to use much more modest financial obligations to enhance cross-EU commercialization strategies for their local producers.

Of course, it should not be forgotten that member states are entirely at liberty not to implement 13(2) at all, a direction a number have taken.[39] This option is entirely consistent with preserving a vibrant audiovisual market based on the demand of local consumers, who are free to demand as much local content as they wish.

Ultimately, however, much care should be taken, particularly for member states with markets smaller and less subsidized than France.[40] As some members choose to experiment with these financial contribution rates, they should start with impact assessments and proceed from there incrementally, consistent with the principle of proportionality.

[1] Directive (EU) 2018/1808 Amending Directive 2010/13/EU on the Coordination of Certain Provisions Laid Down by Law, Regulation or Administrative Action in Member States Concerning the Provision of Audiovisual Media Services (Audiovisual Media Services Directive) in View of Changing Market Realities, [2018] OJ L 303/69.

[2] Ibid. at Article 13(6).

[3] Sally Broughton Micova, The Audiovisual Media Services Directive: Balancing Liberalisation and Protection, in Research Handbook on EU Media Law and Policy (E. Brogi and P.L. Parcu, eds.), Cheltenham:Edward Elgar Publishing (2021) at 264.

[4] It is important to note a latent tension, however, between the AVMSD’s focus on European content, which suggests a pan-European preference, versus the practical reality that member states may choose to preference their own national content. The latter would actually frustrate the general goal of the AVMSD in some important respects.

[5] Joëlle Farchy, Grégoire Bideau, & Steven Tallec, Content Quotas and Prominence on VOD Services: New Challenges for European Audiovisual Regulators, 28 Int’l J. Cultural Pol’y 419 (2022).

[6] Catalina Iordache, Tim Raats, & Karen Donders, The “Netflix Tax”: An Analysis of Investment Obligations for On-Demand Audiovisual Services in the European Union, 16 Int’l J. Comm. 545, 548 (2022).

[7] Directive 89/552/EEC on the Coordination of Certain Provisions Laid Down by Law, Regulation or Administrative Action in Member States Concerning the Pursuit of Television Broadcasting Activities [1989] OJ L 298/23, Articles 4 and 5.

[8] Directive 2010/13/EU on the Coordination of Certain Provisions Laid Down by Law, Regulation or Administrative Action in Member States Concerning the Provision of Audiovisual Media Services (Audiovisual Media Services Directive), [2010] OJ L 95/1, Article 13(1).

[9] Ibid.

[10] European Commission, Communication on State Aid for Films and Other Audiovisual Works, (2013) OJ C 332/1, para. 4.

[11] Attentional, KEA European Affairs, and Valdani Vicari & Associati, supra note 3, at 17. It should be noted, further, that in this time period, providers were still early in their efforts to develop the VOD market. Thus, the relative immaturity of that market shaped these outcomes to some extent.

[12] Marlen Komorowski, Catalina Iordache, Ivana Kostovska, Stephanie Tintel, & Tim Raats, Investment Obligations for VOD Providers to Financially Contribute to the Production of European Works, a 2021 Update, Studies Media Innovation Technology (2021) at 31, available at https://smit.vub.ac.be/wp-content/uploads/2021/06/A-European-comparison-of-investment-obligations-on-VOD-providers-to-financially-contribute-to-the-production-of-European-works_Report-2021_FINAL.pdf.

[13] Ibid. at 7.

[14] See Piero Papp, The Promotion of European Works: An Analysis on Quotas for European Audiovisual Works and their Effect on Culture and Industry, Stanford-Vienna European Union Law Working Paper No. 50 (2020), available at https://law.stanford.edu/wp-content/uploads/2020/10/papp_eulawwp50.pdf; and Sally Broughton Micova, Content Quotas: What and Whom are the Protecting? in Private Television in Western Europe: Content, Markets, Policies (K. Donders, C. Pauwels, and J. Loisen, eds.), Hampshire: Palgrave (2013) at 245.

[15] AVMSD 2010, supra note 8, at Recital 69.

[16] Iordache, Raats, & Donders, supra note 6, at 551.

[17] Investing in European Works: The Obligations on VOD Providers, European Audiovisual Observatory (2022), available at https://rm.coe.int/iris-plus-2022en2-financial-obligations-for-vod-services/1680a6889c.

[18] Yearbook 2022/2023 – Key Trends, European Audiovisual Observatory (2023), available at https://rm.coe.int/yearbook-key-trends-2022-2023-en/1680aa9f02.

[19] The European Media Industry Outlook, European Commission (2023), available at https://digital-strategy.ec.europa.eu/en/library/european-media-industry-outlook.

[20] Daphne R. Idiz, Kristina Irion, Joris Ebbers, & Rens Vliegenthart, European Audiovisual Media Policy in the Age of Global Video on Demand Services: A Case Study of Netflix in the Netherlands, 12 J. Digital Media & Pol’y 425 (2021).

[21] European Audiovisual Observatory, supra note 17, (finding 32%). The more recent European Commission study, supra note 19, found that EU works alone constituted 28% of VOD catalogs (evenly divided between national and nonnational works), while UK works (qualifying as European for AVMSD purposes) constituted an additional 9%, for a total of 37%.

[22] The Visibility of Audiovisual Works on TVOD – Edition 2021, European Audiovisual Observatory (2021), available at https://rm.coe.int/visibility-of-av-works-on-tvod-2021-edition/1680a59bc2.

[23] But according to the European Media Industry Outlook of the European Commission, supra 19, “Consumers are quite open to the country and language of origin.” And further: “Four out of five (80%) EU consumers say that they are likely to watch films or series from the US, followed by 76% that say they are likely to watch films or series from their home country. About seven in 10 (71%) EU consumers say that they are likely to watch films or series coming from other European countries.”

[24] See, e.g., William J. Baumol, On Taxation and the Control of Externalities, 62 Am. Econ. R. 307, 312 (1972).

[25] Ibid. at 307.

[26] For example, a recent report from the European Commission on the audiovisual market found that EU consumers expressed a roughly equal demand for both U.S. and national content. European Commission, supra 19, at 23. U.S. works represent just less than half (47%) of VOD providers’ catalogs, while EU works (national and nonnational) comprise 28% and UK works comprise 9%. Id. at 26. The report does not indicate from whence the remaining 16% originate, but we can surmise that it is material sourced from around the world.

[27] William J. Baumol, supra note 24, at 312.

[28] European Commission, supra note 28, at 48.

[29] Ibid.

[30] Ibid. at 315.

[31] Annette Broocks & Zuzanna Studnicka, Gravity and Trade in Video on Demand Services, JRC Digital Economy Working Paper 2021-12 (2021), available at https://joint-research-centre.ec.europa.eu/publications/gravity-and-trade-video-demand-services_en.

[32] Iordache, Raats, & Donders, supra note 6, 557.

[33] Svitlana Buriak & Dennis Weber, Investment Obligations and Levies on VOD Media Service Providers and Cultural Policies of Member States, 15 World Tax J. 2, 3-4 (2023), available at https://www.ibfd.org/shop/journal/investment-obligations-and-levies-vod-media-service-providers-and-cultural-policies.

[34] Ibid.

[35] Ibid. at 4.

[36] Ibid. at 28-30.

[37] The principle of proportionality requires that the legislator considering adoption of a new measure consider “the need for any burden” that that legislative act is likely to create “to be minimised and commensurate with the objective” pursued. Article 5, Protocol (No 2) on the application of the principles of subsidiarity and proportionality (OJ C 115), 9.5.2008, p. 206-209.

[38] See, e.g., Economic Analysis of the French Audiovisual Industry Main Trends and Focus on the Costs of High-End Fiction In France, Arcom (2023) at 13-18, available at https://www.arcom.fr/sites/default/files/2023-04/Presentation%20economic%20analysis%20of%20the%20french%20audiovisual%20industry_0.pdf.

[39] Svitlana Buriak & Dennis Weber, supra, note 33 at 4.

[40] In particular, smaller member states should take notice of the fact that France is pushing for aggressive obligations against the backdrop of a 2023 budget of 4.2 billion euros for the French Culture Ministry. See, Ministry of Culture Budget 2023 – Finance Bill, Ministere de la Culture (Sep. 28, 2022), https://www.culture.gouv.fr/en/Presse/Dossiers-de-presse/Budget-2023-du-ministere-de-la-Culture-Projet-de-loi-de-finances#:~:text=In%202023%2C%20the%20Ministry%20of,(up%20€527%20million).

Source: SSRN

ICLE Issue Brief

German Big Tech Actions Undermine the DMA

The complexity of the European Union’s Digital Markets Act (DMA) raises various difficult interpretative questions. Chief among them is whether the EU law is . . .

Abstract

The complexity of the European Union’s Digital Markets Act (DMA) raises various difficult interpretative questions. Chief among them is whether the EU law is effective in achieving its purpose of harmonizing the national laws of EU member states. The issue is not just of academic concern; if the DMA falls short in this regard, it could be viewed as having been founded on flawed legal grounds, potentially rendering it null and void. In this context, we examine recent actions by the German Federal Cartel Office (Bundeskartellamt; FCO) regarding large technology-sector firms that the DMA would regulate as “gatekeepers.” This issue brief outlines two competing legal interpretations of potential relevance. One option is that the FCO’s actions may contravene EU law. Alternatively, the recent German actions could indicate that the DMA fails in its purpose as a harmonizing measure, thereby casting doubts on the law’s validity.

I. The DMA Must Be a Harmonizing Measure

Every law enacted by the EU legislature must have a legal basis in the EU treaties. Without an appropriate treaty basis, the law would be invalid. The DMA’s drafters chose Article 114 of the Treaty on the Functioning of the European Union (TFEU) as its legal basis. Notably, unlike Article 352 TFEU, Article 114 does not require unanimity among EU member states for a law to be enacted. Because the provision has a lower threshold of member-state consent, it is more limited in its scope.

Article 114 TFEU allows adoption of “the measures for the approximation of the provisions laid down by law, regulation or administrative action in Member States which have as their object the establishment and functioning of the internal market.” In other words, it empowers the creation of harmonizing measures: EU laws that address diverging rules among the member states that “are such as to obstruct the fundamental freedoms and thus have a direct effect on the functioning of the internal market or to cause significant distortions of competition.”[1] Given that the DMA was adopted with Article 114 as its legal basis, it must satisfy those requirements. If it does not, then it risks invalidation by the EU Court of Justice.

II. The DMA’s Potential Ineffectiveness in Harmonization

As Alfonso Lamadrid de Pablo & Nieves Bayón Fernández have persuasively argued, an interpretation of the DMA that rendered it ineffective as a harmonization measure would, in turn, threaten the law’s validity,[2] a concern that has also been noted by Jasper Van den Boom.[3] In a similar vein, Giuseppe Colangelo has argued that the European legal framework could become more fragmented because of overlaps between, and the potential dual application of, the DMA and competition law.[4] Further, Marco Cappai & Colangelo have warned that such overlaps raise the risks of double or even triple jeopardy for defendants in competition cases.[5]

As Lamadrid & Fernández argued, the initial threshold question is whether there are, or are likely to arise, sufficient significant divergences among national laws to justify invoking Article 114 TFEU. Provided that they exist, the follow-up question is whether the DMA addresses those divergences effectively. According to Lamadrid & Fernández, if courts interpret the DMA rules meant to ensure harmonisation narrowly—namely, Article 1(5)-(7)—there is a risk that they will fail to pre-empt the very fragmentation that the law is supposed to address.[6]

The Impact Assessment for the DMA proposal gave several examples of diverging national laws, including Section 19a of the German Act Against Restraints of Competition (Gesetz gegen Wettbewerbsbeschränkungen; GWB).[7] Most recently amended in 2021, the GWB is intended to apply to businesses with “paramount cross-market significance”—a designation defined differently than the DMA’s “gatekeepers” but which likely would be applied to essentially the same set of companies. Colangelo cited the amended GWB—describing it as a kind of “Germanexit”—in arguing that the potential for overlapping enforcement of the DMA and national competition rules is exacerbated where member states strengthen their antitrust-enforcement tools with platform-specific provisions.[8]

On one hand, Article 1(5) states that member states “shall not impose further obligations on gatekeepers by way of laws, regulations or administrative measures for the purpose of ensuring contestable and fair markets.” But on the other hand, it qualifies this mandate by excluding prohibition measures that are “outside the scope of this Regulation,” so long as gatekeepers are not targeted explicitly for being gatekeepers. Lamadrid & Fernández suggest that the effect of this qualification may be to “exempt, permit, and leave unchanged all of the rules identified in the Commission’s Impact Assessment as sources of existing or likely regulatory fragmentation.”[9]

Article 1(6) states that the DMA is without prejudice to the application of EU competition law (Articles 101-102 TFEU); national rules analogous to EU competition law (letter (a)); rules on merger control (letter (c)); and also “national competition rules prohibiting other forms of unilateral conduct insofar as they are applied to undertakings other than gatekeepers or amount to the imposition of further obligations on gatekeepers” (letter (b)). Lamadrid & Fernández note:

Under this provision, Member States would remain free to enact new rules overlapping with those in the DMA, or even establish ‘additional obligations’, provided that these are enacted as part of their national competition rules and do not only target gatekeepers as defined in the DMA.[10]

Without questioning that a narrow interpretation is possible, Van den Boom argued that there should be a way to interpret the DMA’s pre-emptive provisions more broadly to ensure effective harmonization.[11] Van den Boom concludes that national laws like the German Section 19a GWB may need to be revised in the light of a broader, harmonization-preserving interpretation of the DMA.[12]

III. FCO Objections to Google’s Data Processing Across Services

In December 2022, the FCO issued a statement of objections regarding Google’s processing of user data across services, which noted that, under Google’s current terms, data from many services can be combined to construct user profiles for advertising and other purposes.[13] The data is collected and processed across such platforms as Google Search, YouTube, Google Maps, and even third-party sites, as well as Google’s background services, with the company periodically drawing data from Android devices.

The FCO tentatively concluded that these terms did not offer users adequate choice regarding the extensive cross-service data processing, deeming the current options insufficiently transparent and overly broad. In announcing that they would require Google to modify the choices available to users, the FCO relied on Section 19a GWB, the same provision that the DMA Impact Assessment offered as an example of the kind of legal fragmentation that the DMA was meant to address. Moreover, and crucially, the object of the FCO’s investigation—combining user data across services—is covered by the DMA in its Article 5(2). This suggests that the FCO’s may actions are prohibited by the DMA (in Articles 1(5)-(6)).

In addressing concerns that their actions were pre-empted by the DMA, the FCO claimed that they were applying domestic competition law, which would suggest that Article 1(5) DMA does not apply. The FCO also noted that no “core platform services” have been designated under the DMA, and thus we do not yet technically have any “gatekeepers” for the purposes of the DMA’s pre-emption rules. Finally, the FCO asserts that the domestic legal basis (Section 19a GWB) of their investigation “partially exceeds the future requirements of the DMA” and, moreover, that “the Bundeskartellamt is in close contact with the European Commission.”[14]

IV. The FCO Versus the DMA

By its own admission, the FCO is pursuing Google for conduct to which the European Commission is likely to apply the DMA. The FCO thus appears to be trying to beat the Commission to the chase and impose its own regulatory vision before the Commission has time to act.

The Google investigation is part of the FCO’s broader agenda for large tech firms. The agency has already used Section 19a GWB to designate Alphabet, Amazon, Apple, and Meta as having “paramount significance for competition across markets,” while an investigation to similarly designate Microsoft is pending.[15] Some, if not all, of those companies are likely to also be deemed “gatekeepers” by the European Commission under the DMA.

More importantly, at least some ongoing Section 19a investigations relate to matters covered by the DMA. For example, the FCO’s investigation of Apple’s app-tracking transparency framework focuses on so-called “self-preferencing,” a practice that the Commission could determine the DMA covers.[16] The FCO commenced that investigation after final agreement on the DMA in March 2022. Similarly, the FCO’s ongoing investigation of Meta similarly concerns the processing of user data across services, which is clearly covered by the DMA, provided that the relevant Meta services will be designated under the DMA as gatekeepers.[17]

If the Commission designates Google and its services under the DMA, the company would be subject to Article 5(2) DMA, which would require that Google obtain user consent to:

(a) process, for the purpose of providing online advertising services, personal data of end users using services of third parties that make use of core platform services of the gatekeeper;

(b) combine personal data from the relevant core platform service with personal data from any further core platform services or from any other services provided by the gatekeeper or with personal data from third-party services;

(c) cross-use personal data from the relevant core platform service in other services provided separately by the gatekeeper, including other core platform services, and vice versa; and

(d) sign in end users to other services of the gatekeeper in order to combine personal data.

The key notions of “specific choice” and “consent” in Article 5 DMA pose difficult technical and legal questions. Exactly how Google would implement such cross-service processing of data in compliance with the DMA will be a matter for discussion between Google and the European Commission.

Different authorities are likely to reach different conclusions as to how to approach such problems. But given that the DMA is based on Article 114 TFEU and thus intended as a harmonization measure, its chief purpose must be to prevent fragmentation of regulatory approaches to issues clearly covered by the DMA. This is true irrespective of whether a national authority purports to rely on national competition rules or on other national law.

The FCO noted that Section 19a GWB “partially exceeds” the DMA’s requirements, which is a curious choice of phrase. It would appear to admit that the national law overlaps with the DMA. To the extent that such an overlap exists, application of the law to designated gatekeepers is pre-empted by Articles 1(5)-(6) DMA. Even if the FCO could show that some requirements they intend to impose on Google “exceed” what the Commission would do under the DMA, this would not render that FCO’s actions outside the scope of DMA’s pre-emptive provisions.

The FCO’s stated intent is to impose its own interpretation of what constitutes “sufficient choice” as to whether and to what extent “users agree to cross-service data processing.” Based on these assertions, it is difficult to see how the FCO’s action would either be “outside the scope” of the DMA (Article 1(5) DMA) or constitute a “further obligation” (Article 1(6) DMA). If the DMA is to be an effective harmonizing measure, then the mere fact that a national authority has an idiosyncratic interpretation of user choice and consent in the context of cross-service data processing cannot be sufficient for its actions to constitute a “further obligation.”

Any other reading of the DMA would serve to nullify Articles 1(5)-(6). Whenever any national authority disagrees with how the Commission enforces the DMA, they could simply adopt national measures that “exceed” the DMA in that they differ from the Commission’s approach. Given the scope of Article 5(2) DMA, interpreting Articles 1(5)-(6) not to preclude the FCO’s actions would jeopardize the DMA’s validity as a harmonising measure under Article 114 TFEU.

As the FCO itself has noted, the Commission has not yet designated any “gatekeepers” or their “core platform services.” The FCO has, however, conceded that its actions against Google concern services that are “likely” to be designated and therefore covered by the DMA. To preserve the DMA’s validity, actions like the FCO’s against services that are within the DMA’s scope must be pre-empted. With services that are not yet—but are likely to be—designated, actions by a national authority that will be illegal once the services are designated should also be considered illegal while a designation is imminent. This reading follows both from the DMA’s function as a harmonizing measure under Article 114 TFEU and from the principle of sincere cooperation (Article 4 TEU).

Pre-emption does not have to render Section 19a GWB and similar national rules a dead letter. As Gunnar Wolf & Niklas Brüggemann argue, there is space for “complementarity” between the DMA and national law.[18] If, however, the DMA is to remain an effective harmonizing measure, the scope for national action in areas regulated by the DMA must be narrow. It does not appear that the FCO’s proposed action is “complementary” to the DMA. Rather, it is a brazen attempt to circumvent the DMA’s harmonizing function.

V. Conclusion

The FCO and other national authorities may be less concerned than the European Commission with preserving the DMA’s validity. In fact, the FCO’s actions suggest that they are chafing against the restraints imposed by the DMA and would prefer to act as if the restraints do not apply. It would be surprising if the Commission did not respond with a more assertive approach to such prima facie breaches of EU law by national authorities. The stakes are high. If the Commission tacitly accepts an interpretation of the DMA that gives national authorities free rein for these kinds of enforcement actions, then it will cease to be a harmonizing measure and, as such, would be invalid.

[1] Case C-58/08 Vodafone, O2 et al. v Secretary of State, EU:C:2010:321 ¶ 32.

[2] Alfonso Lamadrid De Pablo & Nieves Bayón Fernández, Why the Proposed DMA Might Be Illegal Under Article 114 TFEU, and How to Fix It, 12 J. Eur. Compet. Law Pract. 576 (2021).

[3] Jasper Van den Boom, What Does the Digital Markets Act Harmonize?–Exploring Interactions Between the DMA and National Competition Laws, 19 Eur. Competition J. 57, 69 (2023).

[4] Giuseppe Colangelo, The European Digital Markets Act and Antitrust Enforcement: A Liaison Dangereuse, Eur. Law Rev. 597 (2022).

[5] Marco Cappai & Giuseppe Colangelo, Applying Ne Bis in Idem in the Aftermath of BPost and Nordzucker: The Case of EU Competition Policy in Digital Markets, 60 Common Mark. Law Rev. (2023).

[6] De Pablo & Fernández, supra note 2.

[7] European Commission, Commission Staff Working Document Impact Assessment Report Accompanying the document Proposal for a Regulation of the European Parliament and of the Council on contestable and fair markets in the digital sector (Digital Markets Act), Part 2, 112-113 (2020), https://eur-lex.europa.eu/legal-content/EN/TXT/?uri=CELEX%3A52020SC0363.

[8] Colangelo, supra note 4.

[9] Id, 580.

[10] Id.

[11] Van den Boom, supra note 3.

[12] Id, 84.

[13] Bundeskartellamt, Statement of Objections Issued Against Google’s Data Processing Terms, (2023), https://www.bundeskartellamt.de/SharedDocs/Meldung/EN/Pressemitteilungen/2023/11_01_2023_Google_Data_Processing_Terms.html.

[14] Id.

[15] Bundeskartellamt, Proceedings against large digital companies – on the basis of Sec. 19a GWB – as of May 2023, (2023), https://www.bundeskartellamt.de/SharedDocs/Publikation/EN/Downloads/List_proceedings_digital_companies.pdf. Note that Amazon and Apple are disputing their designation under Section 19a and according to the FCO the court proceedings are not yet finalized.

[16] Bundeskartellamt, Bundeskartellamt reviews Apple’s tracking rules for third-party apps, (2022), https://www.bundeskartellamt.de/SharedDocs/Meldung/EN/Pressemitteilungen/2022/14_06_2022_Apple.html. As noted in the previous footnote, Apple is disputing their designation under Section 19a.

[17] Bundeskartellamt, Meta (Facebook) responds to the Bundeskartellamt’s concerns – VR headsets can now be used without a Facebook account, (2022), https://www.bundeskartellamt.de/SharedDocs/Meldung/EN/Pressemitteilungen/2022/23_11_2022_Facebook_Oculus.html.

[18] Gunnar Wolf & Niklas Brüggemann, Agenda 2025: the Digital Markets Act and Section 19a GWB, D’Kart (2022), https://www.d-kart.de/en/blog/2022/07/19/agenda-2025-der-digital-markets-act-und-§19a-gwb.

ICLE Issue Brief

The Consequences of Caps on Cross-Border Payment Fees in Costa Rica

Executive Summary Under the auspices of Legislative Decree 9831, the Central Bank of Costa Rica (BCCR) has set maximum fees for acquiring and issuing banks . . .

Executive Summary

Under the auspices of Legislative Decree 9831, the Central Bank of Costa Rica (BCCR) has set maximum fees for acquiring and issuing banks in payment-card markets, with maximum acquisition fees (MDR) and interchange fees (IRF). Different fees were set for domestic transactions (i.e., those made using locally issued cards) and for cross-border transactions (i.e., those made using foreign-issued cards).

In November 2022, BCCR issued a proposal to retain the cross-border MDR cap at 2.5% and either to leave the cap on cross-border IRF unchanged at 2%, or to lower it to 1.25%. In the same document, BCCR proposed that the MDR for domestically issued cards would be capped at 2% and the IRF capped at 1.5%.

IRF for cross-border transactions typically are significantly higher than those for domestic transactions, primarily because cross-border transactions carry much higher risk of fraud. If BCCR caps cross-border interchange fees at the lower level it has proposed, foreign issuers are likely to respond by de-risking payment requests from acquirers in Costa Rica. This could take various forms, including rejecting payments from certain merchants, or simply increasing rejections rates across the board. Whatever approach, or mix of approaches, is taken, it is likely to cause problems both for merchants in Costa Rica and for their customers.

Prior to the COVID-19 pandemic, roughly 6.25% of Costa Rica’s gross domestic product (GDP) came from tourism, with a significant proportion of those tourist dollars spent using payment cards. Indeed, in 2021, even without a full resumption of pre-COVID rates of tourism, approximately 16% of credit-card payments in Costa Rica were cross-border. If tourists find that they are unable to make reservations at hotels in Costa Rica using their credit or debit cards because the payment is rejected by their issuer, they may well choose an alternative destination for their trip. Meanwhile, if tourists in Costa Rica are unable to pay for goods and services using their credit and debit cards, many will simply not make those payments. This could have a substantial negative effect on Costa Rica’s tourism and business-travel industries.

Introduction

Costa Rica Legislative Decree No. 9831—issued March 24, 2020—created a mandate to regulate acquisition fees (commonly known as the “merchant discount rate,” or MDR) and interchange reimbursement fees (IRF) charged by service providers on “the processing of transactions that use payment devices and the operation of the card system.”[1] The legislation’s stated objective was “to promote its efficiency and security, and guarantee the lowest possible cost for affiliates.”

Implementation was delegated to the Central Bank of Costa Rica (BCCR), which was tasked with responsibility to issue regulations and monitor compliance; ensure that the rule is “in the public interest”; and guarantee that fees charged to “affiliates” (i.e., merchants) are “the lowest possible … following international best practices.” Beginning Nov. 24, 2020, BCCR set the maximum IRF for domestic cards at 2.00% and the maximum MDR at 2.50%. These fell to 1.75% and 2.25%, respectively, in an updated regulation published in January 2022, and to 1.5% and 2% in February 2023.

In a study published in May 2022, we reviewed the available evidence regarding interchange fees and argued that it would be contrary to international best practices for Costa Rica to cap acquisition fees and interchange fees.[2] In particular, we raised specific concerns regarding the likely harmful effects of capping fees on cross-border transactions, owing to the higher risks and other costs associated with such transactions.

BCCR developed a technical study that considered the effects of different levels of caps on fees for both domestic and cross-border payment-card transactions and, in November 2022, issued a proposal to retain the cross-border MDR cap at 2.5% and either (1) leave the cap on cross-border IRF unchanged at 2%, or (2) lower the IRF cap for cross-border transactions to 1.25%.

If BCCR leaves the cross-border MDR cap unchanged but reduces the cross-border IRF cap to 1.25%, it might, in principle, appear to solve the immediate problem faced by acquiring banks. It would, however, create new problems for those banks, their customers, and the wider economy. It will also put Costa Rica in the unenviable position of being the only country in the world with a cross-border interchange fee that is below the domestic interchange fee.

This brief considers the international experience with cross-border payment-card transactions, with a focus on issues related to fraud, as well as the negative implications of imposing price caps. It begins with a brief discussion of the economics of interchange fees. Section II describes Costa Rica’s price controls on merchant acquisition and interchange fees. Section III discusses fraud and other costs associated with cross-border and card-not-present transactions. Section IV describes ways in which payment-card networks address issues related to fraud. And Section V assesses the likely implications for Costa Rica of price caps on cross-border interchange fees.

I.        The Economics of Interchange Fees

Payment systems are two-sided markets, with consumers on one side and merchants on the other; the payment network acts as a platform that facilitates interactions between the two sides.7F[3] For such a system to be successful, both merchants and consumers must perceive it as beneficial. If too few merchants accept a particular form of payment, consumers will have little reason to obtain it and issuers will have little incentive to issue it. Likewise, if too few consumers possess a form of payment, merchants will have little reason to accept it.

In any two-sided market, platform operators seek to encourage participation on each side of the market in ways that maximize the joint net benefits of the network to all participants—and to allocate system costs accordingly.8F[4] Among the means they employ to achieve this balance is by setting prices charged, respectively, to participants on each side of the market.9F[5] In the case of payments, if the platform operator sets the price too high for some consumers, they will be unwilling to use the platform; similarly, if the operator sets the price too high for some merchants, they will not be willing to use the platform.

In general, the costs of operating a platform will tend to fall on the party who is least sensitive to such costs (i.e., the party with the lower price elasticity). In the case of payment cards, that party is the merchant.13F[6] Merchants often pay, through transaction fees, not only all the costs of accessing the network, but also effectively subsidize participation by consumers—e.g., through cashback and other rewards programs, insurance, fraud protection, and other cardholder benefits that serve as incentives to card usage.

Merchants are willing to do this because they receive significant benefits from the use of payment cards, including: ticket lift (i.e., higher spending, due to the fact that consumers are not constrained by the cash in their pockets or, in the case of credit cards, the amount of cash currently in their bank accounts), guaranteed payment, reduced cash-management costs, and faster checkout times.

II.      Costa Rica’s Price Controls on Payment Card Fees

Article 14 of Legislative Decree 9831 requires the BCCR to undertake “ordinary reviews” of the price controls on MDR and IRF at least once annually. Its first such review, published in November 2021, set a timetable for maximum domestic-acquisition and interchange fees (see table below) and set maximum cross-border MDR at 2.5% and IRF at 2%.[7]

SOURCE: Banco Central de Costa Rica[8]

BCCR subsequently established a task force to develop proposals for setting payment-card fees. On Nov. 2, 2022, BCCR published the task force’s recommendations, which included, inter alia, the following:[9]

  • Use international comparisons of IRFs and MDRs “as the best technical tool currently available to the BCCR to ensure the lowest possible cost for affiliates, in accordance with Legislative Decree 9831.”
  • Maintain the differentiation of the ceilings on IRF and MDR between local and cross-border payment transactions, in accordance with Article 4 of Legislative Decree 9831, “as this leads to the proper functioning, efficiency and security of the Costa Rican payment system and the lowest cost for affiliates.”
  • For 2023, set maximum fees for local payment transactions at 1.50% for IRF and 2.00% for MDR. This is in line with the proposal made in 2021.
  • Maintain the cap of 2.50% on cross-border MDR, “since the information available in the international comparison does not allow modifications to be made to the limit established since 2020.”
  • Propose two alternative options regarding the maximum cross-border IRF:
    • Option 1: maintain the current maximum, e., 2.00%; or
    • Option 2: reduce the maximum to 1.25%.

The BCCR offers various putative justifications for these proposed caps. For example, it notes that Option 2 would result in a maximum cross-border IRF that is midway between “the minimum cross-border IRF established by Mastercard and Visa card brands for the United States and Canada, as well as Visa for Australia in the case of non-Asia Pacific issuers” (i.e., 1.00%) and the IRF “agreed by Mastercard and Visa card brands for card-not-present payments in the EEA” (i.e., 1.50%).

Such justifications, however, are fundamentally inconsistent with the economics of two-sided markets. The current and proposed price caps thus represent essentially arbitrary interventions. By focusing narrowly on the costs incurred by merchants through IRFs and MDRs, BCCR fails to account adequately for the offsetting benefits that accrue to consumers and merchants—and the costs to provide those benefits.

Legislative Decree 9831 does, however, permit BCCR to take into consideration “[a]ny other element that reasonably allows the Central Bank of Costa Rica to guarantee the efficiency and security of the card systems.”[10] As discussed below, one such element that should be considered by BCCR is the potential effect of regulating international IRFs on merchants in Costa Rica, especially those catering to tourists and business travelers, and the wider effects on the economy.

III.    Fraud Risks Associated with Cross-Border Payments

In comparison to domestic payments, cross-border payments entail significantly higher risks of fraud, as be seen by looking at the incidence of payments fraud in the European Union (EU). Data from the European Central Bank (ECB) show unambiguously that the rates of fraud on cross-border transactions—both between EU member states and from outside the EU—is much higher than fraud on domestic transactions. In its 2021 Report on Card Fraud, the ECB found that, between 2015 and 2019, cross-border transactions represented only 10% of transactions by value but 65% of all fraud by value, as can be seen in Figure I.[11] Thus, in value terms, cross-border fraud represents a risk more than six times greater than domestic fraud.

SOURCE: European Central Bank[12]

For most EU member states, the situation is even more dramatic, with cross-border fraud representing more than 90% of all card fraud, as can be seen in Table II.

SOURCE: European Central Bank[13]

Looking at the types of transaction involved in card fraud, the vast majority (83%) are card-not-present (CNP) fraud, as can be seen in Figure II.

SOURCE: European Central Bank[14]

While these data relate to payments fraud in the EU, they are likely indicative of broader international trends. As such, they suggest that cross-border fraud in general and CNP cross-border fraud in particular is a far more significant problem than domestic fraud of all kinds.

IV.    How Card Networks Address Payment-Card Fraud

Card networks have developed numerous processes and technologies to address payment-card fraud, including the following.

Zero liability protection for cardholders. Card networks’ standard terms and conditions include clauses requiring issuers to protect personal cardholders from unauthorized transactions (subject to certain conditions, such as that cardholders report such transactions promptly to the card issuer).[15] This protection is an important benefit to cardholders, who otherwise might be wary of using their cards, especially for online transactions or in foreign countries.

Liability protection for merchants. Just as cardholders are protected from liability for unauthorized transactions, so too are merchants. Issuers are, by default, liable for unauthorized transactions. This is an important benefit to merchants, who might otherwise be reluctant to accept card-based payments.

Chargebacks. The above liability protections apply only to unauthorized transactions. Where a cardholder has authorized a payment, they will be liable. Meanwhile, if a merchant has processed a payment without obtaining the necessary authorization, and where that payment has been disputed by the cardholder, the issuer may initiate a “chargeback”: effectively reversing the payment.

Authorization, verification, and fraud monitoring. To complement the system of liability protection and chargebacks, payment networks have developed increasingly sophisticated and effective systems for transaction authorization and fraud monitoring, including:

  • Tokenization—which underpins EMV (Europay, Mastercard, and Visa) chips, contactless cards, and smartphone-based payments—uses encrypted data to enable authorization without sharing personal account numbers;
  • Machine-learning-based transaction monitoring, which creates a dynamic model of each cardholder’s transactions and flags as potentially fraudulent those payments that do not fit the model; and
  • Contingent multifactor authentication, whereby transactions flagged as potentially fraudulent result in the cardholder being asked for secondary authentication.

These systems reduce the incidence of fraud and thereby reduce the liability of card issuers. For example, in 2015, payment networks changed the liability rules for U.S. merchants to encourage adoption of EMV cards. Estimates by Visa suggest that merchants that subsequently adopted EMV-compliant point-of-sale (POS) machines experienced an 87.5% reduction in fraud.[16] Nonetheless, as is clear from Section III, fraud remains a problem, especially for cross-border and CNP transactions.

The liability rules summarized above mean that the cost of fraud falls disproportionately on card issuers. In 2020, issuers bore nearly two-thirds of all card fraud losses worldwide.[17] The equitable and economically efficient solution is for issuers to charge higher fees for transactions that are more likely to be fraudulent.

In some cases, it may make sense to pass on some or all of these costs to consumers. In the case of cross-border transactions, some issuers do this by charging foreign-transaction fees on some cards.[18] Such fees can, however, discourage consumers from using their cards, so it may be preferable for merchants to pay higher fees instead. Thus, cards aimed at international travelers typically offer cardholders “no foreign-transaction fee” as a benefit. These cards instead charge a higher interchange fee for foreign transactions. Holders of such premium cards typically spend more, thereby benefiting the merchants (who pay slightly higher fees, if they are not on a blended rate).

V.      Possible Responses to Caps on Cross-Border Interchange Fees

As noted in Section II, the BCCR Task Force made two alternative proposals with respect to cross-border IRFs. The first would leave the current cap unchanged at 2.00%, while the second would reduce the cap to 1.25%.

Even the current cap is lower than the standard IRF charged for many credit cards that offer no foreign-transaction fee. Payments made using such cards in Costa Rica are thus effectively subsidized by merchants in other jurisdictions that do not impose such caps.

At the lower proposed rate, foreign issuers will receive a lower IRF than domestic-card issuers. Given the much higher fraud rate on cross-border payments, this is likely to cause significant problems, especially for premium cards that offer cardholders “no foreign-transaction fee” as well as other benefits, such as vehicle insurance, purchase-protection insurance, and rewards. The IRF revenue simply will not be sufficient to cover these benefits. As such, to reduce fraud, payments using such cards will be subject to greater scrutiny and many may well simply be rejected.

This is a problem not only for the cardholders, who will be frustrated when attempting to make purchases. It is also a problem for Costa Rica’s tourism and business-travel sectors. Consider what might happen when a prospective visitor attempts to book a room at a resort such as Tortuga Lodge, which takes bookings directly on its website and processes payments through its acquirer in Costa Rica.[19] The prospective visitor first tries their World Elite Mastercard and finds that it is rejected; they then try their Visa Infinite card and again find that the payment is rejected. Frustrated but undaunted, they instead decide to book rooms at Tortuga Lodge on Expedia.com, which uses a U.S. acquirer; this time, they have no problem making and paying for the booking, albeit at a higher price than was offered directly by the hotel. When they arrive in Costa Rica, however, they find that, once again, their cards are repeatedly rejected when they attempt to make purchases, whether it be at restaurants, tour agencies, or even an art gallery where they had hoped to buy a beautiful piece of local artwork.

The above scenario might already be happening, because the standard IRF for such transactions on the cards mentioned is higher than the current capped rate of 2.00%.[20] At the alternative lower proposed rate of 1.25%, rejections are a near certainty for at least some travelers. Worse, some prospective travelers who are looking for a more bespoke offering and want to book directly with the hotel are likely to abandon their plans to travel to Costa Rica at all and choose a different destination where they do not encounter such difficulties.

Ironically, prospective visitors who have standard debit or credit cards that charge foreign-transaction fees are much less likely to have their payments rejected.

Some other payment methods are not covered by the caps on MDRs and IRFs: specifically, wire transfers and other bank-to-bank transfers that do not involve the use of payment-card networks. Most likely, there will be a shift toward the use of such payment methods, as a result both of individuals paying directly through such transfers and an increase in payments from overseas agencies. In general, such alternative payment methods involve greater counterparty risk than payments made using cards due to their greater finality, which means it is more difficult to reverse a payment once made, and the lack of purchase insurance. To the extent that visitors to Costa Rica are limited to wire and bank transfers, as a result of their payment cards being declined, they are likely to reduce their spending.

These anecdotes and observations suggest a number of likely effects of the cap on interchange fees:

  • First, booking and payment for accommodation and other pre-bookable tourism activities will shift from Costa Rica-based agents and acquirers to U.S.-based agents and acquirers. This will reduce margins for Costa Rican hotels and other tourism businesses.
  • Second, higher–end tourists will likely spend less in Costa Rica because they will be less able to use their payment cards.
  • Third, there will likely be an overall reduction in high-spending tourists visiting Costa Rica, with a concomitant reduction in total spending.

In 2019, Costa Rica received about 3.1 million visitors who stayed for one night or more, spending about $4 billion, roughly 6.25% of the country’s GDP.[21] The tourism industry employed more than 170,000 people, about 5% of the country’s working-age population.[22] Tourist numbers fell dramatically in 2020 due to the COVID-19 pandemic, leading to a dramatic decline in income and employment. Visitor numbers began to rise again in 2021 and, while total numbers remained below their pre-COVID highs, the number of visitors from the United States (245,000) was not far off the number for 2019 (280,000). In March 2022. Costa Rica announced its national tourism plan for 2022-2027, in which it sought to increase the number of annual visitors to 3.8 million by 2027, targeting tourism revenue of $4.8 billion.[23]

In 2019, Costa Rican merchants processed around 19 million cross-border payment-card transactions, with a total value of around $2 billion—representing about half the total tourism revenue and 16% of the value of all card transactions.[24] After falling in 2020, the number of cross-border payment-card transactions rose in 2021 to nearly 23 million, with a total value of $2 billion, which is consistent with the return of higher-spending tourists from the United States.[25]

If BCCR chooses to cap interchange fees on cross-border transactions at 1.25%, it is likely to impede Costa Rica’s national tourism plan, both by discouraging tourism and, more importantly, by reducing revenue from higher-spending tourists.

VI.    Conclusion

Based on this assessment, there are significant costs associated with caps on cross-border MDRs and IFRs. As noted above, Legislative Decree 9831 permits BCCR to take into consideration such costs to the extent that they affect BCCR’s ability “to guarantee the efficiency and security of the card systems.”[26] As such it is incumbent on BCCR to consider the potential economic harm that is likely to arise if it were to lower the cap on cross-border IFR to 1.25%.

[1] Note, translations from the Spanish original are approximate.

[2] Julian Morris, Regulating Payment Card Fees: International Best Practice and Lessons for Costa Rica, International Center for Law & Economics (May 25, 2022), https://laweconcenter.org/resources/regulating-payment-card-fees-international-best-practices-and-lessons-for-costa-rica.

[3] Jean-Charles Rochet & Jean Tirole, Two-Sided Markets: A Progress Report, 37 Rand J. Econ. 645 (2006); See also Todd J. Zywicki, The Economics of Payment Card Interchange Fees and the Limits of Regulation, International Center for Law and Economics, ICLE Financial Regulatory Program White Paper Series (Jun. 2, 2010), available at http://laweconcenter.org/images/articles/zywicki_interchange.pdf.

[4] Bruno Jullien, Alessandro Pavan, & Marc Rysman, Two-Sided Markets, Pricing, and Network Effects, in Handbook of Industrial Organization (Vol. 4), 485-592 (2021).

[5] Thomas Eisenmann, Geoffrey Parker, & Marshall W. Van Alstyne, Strategies for Two-Sided Markets, Harv. Bus. Rev. (Oct. 2006).

[6] Id., at 33.

[7] Fijación Ordinaria de Comisiones Máximas del Sistema de Tarjetas de Pago 2021, Banco Central de Costa Rica, (Nov. 2021).

[8] Id. at 3.

[9] Alcance No 237 A La Gaceta No 212, Imprenta Nacional de Costa Rica (Nov. 7, 2022).

[10] Decreta: Comisiones Máximas Del Sistema De Tarjetas, No. 9831, Art. 15(j), Legislative Assembly of the Republic of Costa Rica, (“Cualquier otro elemento que razonablemente permita al Banco Central de Costa Rica garantizar la eficiencia y seguridad de los sistemas de tarjetas.”), http://www.pgrweb.go.cr/scij/Busqueda/Normativa/Normas/nrm_texto_completo.aspx?param1=NRTC&nValor1=1&nValor2=90791&nValor3=119755&strTipM=TC (last visited Apr. 12, 2023).

[11]Seventh Report on Card Fraud, European Central Bank 2022 (Feb. 1, 2022), https://www.ecb.europa.eu/pub/cardfraud/html/ecb.cardfraudreport202110~cac4c418e8.en.html#toc1.

[12] Id. SEPA refers to the Single Euro Payments Area.

[13] Id.

[14] Id. EA19 refers to the 19 EU member states that are members of the Euro zone.

[15] Zero Liability Protection, Mastercard (Oct. 17, 2014), https://www.mastercard.us/en-us/personal/get-support/zero-liability-terms-conditions.html; Zero Liability Policy, Visa, https://usa.visa.com/pay-with-visa/visa-chip-technology-consumers/zero-liability-policy.html (last visited Apr. 12, 2023).

[16] Visa EMV Chip Cards Help Reduce Counterfeit Fraud by 87 Percent, Visa (Sep. 3, 2019), https://usa.visa.com/visa-everywhere/blog/bdp/2019/09/03/visa-emv-chip-1567530138363.html.

[17] Card Issuers Accounted for 65.40% of Gross Losses to Fraud Worldwide in 2020, Nilson Report (Dec. 2021), Issue 1209, at 6.

[18] Jacqueline DeMarco & Poonkulali Thangavelu, A Guide to Foreign Transaction Fees, Bankrate.com (Feb. 24, 2023), https://www.bankrate.com/finance/credit-cards/a-guide-to-foreign-transaction-fees.

[19] Author’s personal communication with reservation specialist at Tortuga Lodge, April 2023.

[20] Mastercard 2022–2023 U.S. Region Interchange Programs and Rates, Effective April 22, 2022, Mastercard (2022), available at https://www.mastercard.us/content/dam/public/mastercardcom/na/us/en/documents/merchant-rates-2022-2023-apr22-2022.pdf; Visa USA Interchange Reimbursement Fees, Visa (Apr. 23, 2022), available at   https://usa.visa.com/content/dam/VCOM/download/merchants/visa-usa-interchange-reimbursement-fees.pdf.

[21] OECD Tourism Trends and Policies 2022: Costa Rica, Organisation for Economic Cooperation and Development (2022), https://www.oecd-ilibrary.org/sites/a99a4da2-en/index.html?itemId=/content/component/a99a4da2-en.

[22] Id.; see also, OECD Economic Surveys: Costa Rica 2023, Organisation for Economic Cooperation and Development (2023), https://www.oecd-ilibrary.org/sites/8e8171b0-en/1/2/2/index.html?itemId=/content/publication/8e8171b0-en&_csp_=0b8e1c4cf7b4fb558e396a4008a8398a&itemIGO=oecd&itemContentType=book.

[23] Plan Nacional de Turismo de Costa Rica 2022-2027, Aprobado en la sesión N° 6210 de la Junta Directiva del Instituto Costarricense de Turismo, Apartado 3.II, celebrada (Mar. 21, 2022),English summary: Costa Rica: National Tourism Development Plan 2022–2027, Tourism Analytics, https://tourismanalytics.com/news-articles/costa-rica-national-tourism-development-plan-2022-2027.

[24] Supra note 9, Table 9. Assumes an average Colones:USD exchange rate during 2019 of 0.0017.

[25] Id. The Colones:USD exchange rate averaged around 0.0016 during 2021.

[26] Decreta: Comisiones Máximas Del Sistema De Tarjetas, No. 9831, Art. 15(j), Legislative Assembly of the Republic of Costa Rica, (“Cualquier otro elemento que razonablemente permita al Banco Central de Costa Rica garantizar la eficiencia y seguridad de los sistemas de tarjetas.”), http://www.pgrweb.go.cr/scij/Busqueda/Normativa/Normas/nrm_texto_completo.aspx?param1=NRTC&nValor1=1&nValor2=90791&nValor3=119755&strTipM=TC (last visited Apr. 12, 2023).

ICLE Issue Brief

Quack Attack: De Facto Rate Regulation in Telecommunications

If it looks like a duck, walks like a duck and quacks like a duck, then it just may be a duck. —Walter Reuther Executive . . .

If it looks like a duck, walks like a duck and quacks like a duck, then it just may be a duck.
—Walter Reuther

Executive Summary

Rate regulation can take many forms. Rates may be regulated through overt price controls, such as price ceilings or price floors; through less-overt rules governing the pace of price changes; or through quality mandates or restrictions. Some rate regulations can provide short-run benefits to certain groups of consumers or producers, but often result in shortages or surpluses that diminish overall welfare. In the long run, rate regulation often distorts investment incentives, leading to a misallocation of investment (e.g., to under- or over-investment).

For these reasons, since the late 1970s, direct rate regulation generally has fallen out of favor across most sectors of the economy, although there are some—such as insurance and utilities—where it remains commonplace. Nevertheless, elected officials and other policymakers frequently come under pressure from constituents and stakeholders to “do something” about the price of goods and services in the ostensibly “deregulated” sectors of the economy, such as when consumers characterize short-term price disruptions as “price gouging.” In some cases, firms may seek regulations to “stabilize” prices, while in others, rate regulation may be seen as a means to “increase access” to crucial goods and services.

Because the costs of overt rate regulations are so well-known, price controls are often buried under layers of bureaucracy or wrapped in with other policies and programs, such that policymakers can plausibly claim that their proposals do not directly regulate rates. While not explicit price controls, these programs amount to de facto rate regulation. It’s a regulatory version of the Duck Test.

Rate regulation—in any form and whatever the imagined benefits—is not a costless endeavor. Costs and risk do not disappear under rate regulation. Instead, they are shifted in one direction or another—typically with costs borne by consumers through some mix of suppressed or misdirected investment, sluggish improvements in quality, and reduced innovation.

This issue brief gives an overview, with a particular focus on the telecommunications sector, of the consequences of different types of overt rate regulation—price ceilings and prices floors—as well as how quality regulations can amount to rate regulation. Price controls, such as price ceilings and price floors, are government interventions in the market that aim to regulate the prices of goods and services. While they may have some short-term benefits, they can also lead to long-term consequences that are not always positive. We examine, in particular, four telecommunications programs in which de facto rate regulation is a key component.

  • The National Telecommunications and Information Administration’s (NTIA) notice of funding opportunity under the Broadband Equity, Access, and Deployment Program (BEAD), which requires each program participant to include a “middle-class affordability plan to ensure that all consumers have access to affordable high-speed internet”;
  • The U.S. Agriculture Department’s (USDA) ReConnect Loan and Grant Program, which gives preference to applicants who agree to abide by “net neutrality” and who provide a “low-cost” option to consumers;
  • New York State’s Affordable Broadband Act, which requires internet service providers (ISPs) to offer all qualifying low-income households at least two internet-access plans: a $15-a-month plan with download speeds of at least 25 megabits-per-second, or a $20-a-month plan with download speeds of at least 200 megabits-per-second; and
  • The Federal Communications Commission’s (FCC) 2015 Open Internet Order’s “net neutrality” and “zero rating” provisions.

In each of these examples, policymakers have gone to extraordinary lengths to avoid characterizing the programs’ pricing provisions as direct rate regulation. No matter how the policies are characterized, however, the consequences remain. When regulation is used to set prices on one side of the multi-sided broadband market at below-market rates, there will be upward pricing pressure on another side of the market. Ultimately, consumers who are not subject to the regulated rates will face higher prices, in turn putting pressure on policymakers to impose yet another layer of imprecise and complex regulation and even deeper constraints on investment.

Government policy may well be able to help accelerate broadband deployment to the unserved portions of the country where it is most needed. This issue brief concludes that the way to achieve that goal is not by imposing price controls on broadband providers. Instead, broadband access can best be expanded by removing costly, government-erected barriers to buildout and/or by subsidizing and educating consumers, where needed.

I.        Introduction

Since the deregulation of railroads, airlines, and trucking in the late 1970s, direct rate regulation has generally, except in a few outlier examples like insurance and utilities, fallen out of favor with elected officials and policymakers. To be sure, there are times when experts and activists have called for price controls in response to short-term price disruptions they characterize as “price gouging.” Because of a widespread skepticism of explicit price controls, rate-regulation efforts are instead often described as efforts to “stabilize” prices or “increase access” to goods and services. In many cases, the price controls are buried under layers of bureaucracy or bundled with other policies and programs, such that policymakers can plausibly claim that their proposals do not amount to regulating rates.

For example, the Wall Street Journal recently reported that 50 members of Congress sent a letter to President Joe Biden urging his administration “to pursue all possible strategies to end corporate price gouging in the real estate sector and ensure that renters and people experiencing homelessness across this country are stably housed this winter.”[1] Proposals include directing the Federal Housing Finance Agency (FHFA) to establish “anti-price gouging protections” and “just cause eviction standards” in rental properties with government-backed mortgages. Another proposal would have the Federal Trade Commission (FTC) issue new regulations defining “excessive” rent increases as an unfair trade practice. A third proposal would condition grants from the U.S. Department of Housing and Urban Development (HUD) on localities mitigating housing cost burdens and “adopting anti-rent-gouging measures.” None of these proposals amount to direct rent controls, but they would, in tandem, establish de facto rent regulation.

Efforts by policymakers to control prices, while distancing themselves from explicit rate regulation, have targeted myriad industries, including telecommunications services. For example, under former Chair Tom Wheeler, the Federal Communications Commission (FCC) voted to enact the 2015 Open Internet Order (OIO), which categorized internet service providers (ISPs) as “common carriers” under Title II of the Communications Act of 1934, thereby subjecting them to, among other things, net-neutrality principles. While rate regulation is among the defining features of most Title II services,[2] Wheeler nonetheless promised at the time to forebear from applying such regulations, stating flatly that “we are not trying to regulate rates.”[3]

But this assurance proved a small consolation. While the agency decided to waive “the vast majority of rules adopted under Title II,” it also made clear that the commission would “retain adequate authority to” rescind such forbearance in the future.[4] In his dissent from the OIO, Commissioner Ajit Pai noted the forbearance merely meant that “the FCC will not impose rules ‘for now.’”[5] Thus, while stopping short of imposing explicit rate regulation immediately, the OIO dangled the threat of rate regulation in the future.

Such threats amount to de facto rate regulation, in which agencies hold out the potential use of onerous rules in the future to shape providers’ pricing policies today. Tim Wu—credited with coining the term “net neutrality” and a recently departed senior advisor to President Joe Biden—has explicitly endorsed the use of threats by regulatory agencies as a means to obtain favored policy outcomes:

The use of threats instead of law can be a useful choice—not simply a procedural end run. My argument is that the merits of any regulative modality cannot be determined without reference to the state of the industry being regulated. Threat regimes, I suggest, are important and are best justified when the industry is undergoing rapid change—under conditions of “high uncertainty.” Highly informal regimes are most useful, that is, when the agency faces a problem in an environment in which facts are highly unclear and evolving. Examples include periods surrounding a newly invented technology or business model, or a practice about which little is known. Conversely, in mature, settled industries, use of informal procedures is much harder to justify.[6]

In 2017, under then-Chairman Pai, the FCC reclassified broadband under Title I of the Communications Act. In a 2018 article referencing the repeal of the 2015 rules, Gigi Sohn lamented that removing ISPs from Title II’s purview meant losing the “power to constrain ‘unjust and unreasonable’ prices, terms, and practices by [broadband] providers.”[7] More recently, standing as a nominee to the FCC, Sohn was asked during a 2021 confirmation hearing before the U.S. Senate Commerce Committee if she would support the agency’s regulation of broadband rates.[8] She responded: “No. That was an easy one.” Around the same time, FCC Chair Jessica Rosenworcel said in written comments that she did not plan to regulate broadband rates directly or indirectly.[9] Her comments indicated that the agency’s 2015 net-neutrality rules “expressly eschew future use of prescriptive, industry-wide rate regulation” and that she “supported this approach in the past and would do so again in the future.”

Nonetheless, policymakers’ interest in imposing controls on broadband rates continues unabated. In 2021, for example, President Biden’s American Jobs Plan called on Congress to reduce broadband prices:

President Biden believes that building out broadband infrastructure isn’t enough. We also must ensure that every American who wants to can afford high-quality and reliable broadband internet. While the President recognizes that individual subsidies to cover internet costs may be needed in the short term, he believes continually providing subsidies to cover the cost of overpriced internet service is not the right long-term solution for consumers or taxpayers. Americans pay too much for the internet—much more than people in many other countries—and the President is committed to working with Congress to find a solution to reduce internet prices for all Americans.[10]

But even in those cases in which rate regulation is imposed, proponents are careful to avoid calling it rate regulation. In defending the State of New York’s 2021 Affordable Broadband Act, for example, the state claimed that the law’s pricing provisions did not amount to rate regulation because they specified a price ceiling, rather than a specific price.[11]

This brief first provides an overview of the problems inherent in rate regulation, de facto or otherwise. It then identifies several instances of rate regulation being covertly introduced into broadband policy, and the dangers this poses to deployment.

II.      A Primer on Rate Regulation

In a competitive market, prices allow for the successful coordination of supply and demand, and the market price reflects both consumer demand and the costs of production. Of course, for those on the demand side of the equation, the price of a good or service is a cost to them, and they would prefer falling prices to rising prices. For suppliers, the price represents the revenue from selling the good or service and they would prefer rising prices to falling prices.

Because of this inherent tension, there is a natural inclination on the part of both consumers and producers to seek the government’s intervention in the competitive process to halt or slow price changes. The most obvious way the government can intervene is through rate regulation, such as price controls. Price controls can be divided into two categories: price ceilings that set a maximum price that sellers can charge and price floors that set the minimum price that consumers can pay. It is well-known and widely accepted that price controls can make both consumers and sellers worse off.[12] Consequently, policymakers may pitch policies that control prices under another name (e.g., “second generation rent relief”) or introduce policies that are not explicit price controls, but have substantially the same effects as price controls (e.g., quality-of-service mandates).

A.      Price Ceilings

The most well-known example of a price ceiling is rent control—so well-known, in fact, that just about every introductory microeconomics textbook discusses the topic. Consider the market for apartment rentals shown in Figure I, which is based on an example from Gregory Mankiw’s widely used economics textbook.[13] In a competitive market, the price of apartments would be $1,500 and 2,500 apartments would be rented out.

Figure I: Rent Control in the Short Run and in the Long Run


SOURCE: Mankiw

At the market price, however, tenant advocates would complain of a housing “affordability crisis”—that apartment rents are too high. They argue that if prices were lower, more people could afford apartments. As a result, the government imposes a price ceiling, mandating that apartment rents cannot be any higher than $1,200. But at this price, in the short run, Panel (a) shows the number of apartments demanded (2,500) exceeds the quantity supplied (2,000). Because of this excess demand of 500 apartments, some people who want to rent an apartment would be unable to do so. In other words, there is a shortage of apartments.

In this example, the price ceiling makes the housing “crisis” worse, because fewer people are able to rent apartments than before the rent control was imposed. Some renters are better off because they are paying lower rents, but others are worse off because they cannot rent an apartment—even if they are willing to pay the market price.

Rent-control advocates might argue that there would be no shortage of apartments because apartments don’t just disappear. But they do, just not in the most obvious ways. In the short run, property owners may be more selective regarding to whom they will rent apartments. In the medium term, property owners might convert their apartments to short-term rentals (e.g., listing them on a service like Airbnb). In the somewhat longer term, property owner will reduce their maintenance investments or might convert their apartment buildings to condominiums or sell their rental house to an owner-occupier. Ultimately, developers may decide to invest in an area that is not subject to rent control, thereby reducing the construction of new rental housing. Thus, as shown in Panel (b), in the long run, rent control shifts the supply curve, further reducing the supply of housing and increasing the shortage to 1,000 apartments.

This is not just a theory. There are plenty of real-world examples of this phenomenon playing out. Some nonetheless advocate for a modified version of rent control, sometimes called “second generation” rent control.[14] Rather than regulating the price of apartments, the newer iterations of rent control cap the rate at which prices can rise (e.g., rents can rise no higher than the rate of inflation, plus 3%). Second-generation rent control still results in shortages and all the other consequences, but draws out these effects over a longer time period.

B.      Price Floors

The most well-known form of price-floor regulation is the minimum wage, but there are many industries that are also subject to regulated price floors in the United States. Some states impose floors on the price of milk and alcoholic beverages. For decades, many U.S. agricultural products have been subject to price floors. Until the late 1970s and early 1980s, airline fares and stock-broker charges were subject to price-floor regulation.

Consider the market for wheat shown in Figure II, also adapted from Mankiw’s textbook.[15] In a competitive market, the price of wheat would be $3 and 100 bushels of wheat would be sold. At the market price, however, farmers would complain that the price is “too low.” They argue that, without assistance, their family farms would go under.

Figure II: Rent Market with a Price Floor

SOURCE: Mankiw

As a result, the government imposes a price floor, mandating that wheat cannot be bought for less than $4 per bushel. But at this price, the amount of wheat grown (120) exceeds the quantity demanded (80). Because of this excess supply of 40 bushels, there is a surplus of wheat and some farmers who want to sell wheat at the regulated price would be unable to do so. This introduces another problem for policymakers: price floors do not help suppliers who cannot sell their products at the regulated price.

To solve this problem, policymakers often turn to another set of policies. In some cases, the government promises to purchase any surplus. In one notable example, there is a cave in Missouri that contains 1.4 billion pounds of cheese purchased under such a program.[16] In other cases, the government replaces the price-floor regulation with a subsidy that promises to pay the difference between the market price and a “target price.”[17]

While a price ceiling can lead to “under” investment, a price floor can encourage “over” investment. For example, if a wheat farmer knows the minimum price that a bushel of wheat will fetch and that all the wheat grown will be purchased by someone, then the farmer has incentive to invest in wheat production rather than some other alternative.

Firms often respond to price floors in nonobvious ways. Baby boomers and their parents can tell stories of the luxurious accommodations enjoyed by those who flew coach in the 1960s and 1970s. Planes had spacious seating and some larger planes had a piano lounge onboard—features that were due, in a large part, to rate regulation that set a price floor on airline tickets. Because airlines faced no price competition, they competed for customers by offering superior service. In other words, they responded to price-floor regulations by “over” investing in service and amenities.[18]

In jurisdictions with high minimum wages, firms respond by using less labor. For example, restaurants may switch from table service to counter service, or they may replace some counter service with self-service electronic kiosks. Restaurants that maintain table service may assign more tables to each server. As the perceived level of service declines, consumers may substitute dining at-home for dining out.

C.      Not-Quite Rate Regulations

Because the effects of explicit rate regulation are so well-known and so obvious, policymakers who seek to regulate prices often attempt to do so in less-obvious ways. One already-discussed way is the regulation of price changes, rather than the prices themselves. For example, many rent-control price ceiling programs limit the rate at which rents can increase from year-to-year, a policy described as “rent stabilization.”[19] Many jurisdictions with minimum wage price-floor programs mandate an increase in the minimum wage in-line with the inflation rate.[20]

Another way in which officials can effectively—but not explicitly—regulate rates is through quality mandates. For example, some agricultural products are subject to “marketing orders,” which are legal cartels than can dictate the price and quality of produce.[21] Consider an apple market subject to a marketing order that specifies fresh apples must be of a certain shape and size, such that only large, round apples can be sold as fresh produce.

Presumably, consumers prefer large apples to small apples and prefer round apples to misshapen apples. Thus, as shown in Figure III, the order that only large, round apples can be sold as fresh has the effect of increasing/shifting the demand curve. Consumers would be willing to pay more for the seemingly better fruit, and they’d be willing to buy more. But the order also increases the cost to apple growers. They have to find a way to dispose of their smaller or misshapen apples, perhaps by making apple sauce or juicing the fruit. They also incur higher costs of managing their crop to produce more of the higher-quality fruit. This has the effect of decreasing/shifting the supply curve for fresh fruit. Growers will supply less fruit at a higher cost.

Figure III: Market with a Quality Mandate

Combining the effects from both the shift in supply and the shift in demand shows that the marketing order unambiguously results in a higher price for apples. What is not known, however, is whether more or fewer apples are sold. That will depend on the elasticities of demand and supply. Because the order results in a higher price, however, it has created a de facto price floor without explicitly setting one. Consumers are not aware that they are paying a higher price because they do not know what type of fruit would be available, and at what price, absent the quality restrictions.

III.    Recent Attempts at De Facto Rate Regulation in Broadband

The FCC obviously has a long history of explicit rate regulation since its inception in 1934.[22] Among its founding mandates, the commission was charged with ensuring that rates were fair, that service was reliable and efficient, and that access to telecommunications services was available to all Americans.[23] During this time, the FCC governed telephone-service rates through a system of rate-of-return regulation, in which rates were set based on the cost of providing service and the company’s desired return on investment.[24] In the latter half of the 20th century, and especially since Congress passed a major overhaul of the Communications Act in 1996, a more deregulatory approach to telecommunications has prevailed.

This made sense in the 1990s, and has only made more sense over time, as different communications modalities have been developed, and competition has flourished throughout the market. The reality of the competitive market is acknowledged by regulators across the political spectrum, as we noted above. Both potential and current FCC commissioners note that rate regulation of the broadband industry is undesirable.[25]

At the same time, however, current and potential FCC commissioners—along with other regulators at adjacent agencies—have shaped federal policy in ways that effectively amount to de facto rate regulation. Rate regulation by design and rate regulation in effect arrive at the same damaging economic consequences for consumers and the economy as a whole, however. As such, it is worth reviewing some of the recent efforts to enact de facto rate regulation.

A.      BEAD: Middle-Class Affordability Mandate

The National Telecommunications and Information Administration’s (NTIA) notice of funding opportunity under the Broadband Equity, Access, and Deployment (BEAD) program requires each participating U.S. state or territory to include a “middle-class affordability plan to ensure that all consumers have access to affordable high-speed internet” (emphasis in original).[26] The notice provides several examples of how this could be achieved, including:

  1. Require providers to offer low-cost, high-speed plans to all middle-class households using the BEAD-funded network; and
  2. Provide consumer subsidies to defray subscription costs for households not eligible for the Affordable Connectivity Benefit or other federal subsidies.

Despite the Infrastructure Investment and Jobs Act’s (IIJA) explicit prohibition of price regulation, the NTIA’s approval process appears to envision exactly this. The first example provided above is clear rate regulation. It specifies a price (“low-cost”); a quantity (“all middle-class households”); and imposes a quality mandate (“high-speed”). Toward these ends, the notice provides an example of a “low-cost” plan that would be acceptable to NTIA:

  • Costs $30 per month or less, inclusive of all taxes, fees, and charges, with no additional non-recurring costs or fees to the consumer;
  • Allows the end user to apply the Affordable Connectivity Benefit subsidy to the service price;
  • Provides download speeds of at least 100 Mbps and upload speeds of at least 20 Mbps, or the fastest speeds the infrastructure is capable of if less than 100 Mbps/20 Mbps;
  • Provides typical latency measurements of no more than 100 milliseconds; and
  • Is not subject to data caps, surcharges, or usage-based throttling.[27]

The notice states that the focus of this portion of the program is to foster broadband access, rather than broadband adoption. But broadband access alone may not be sufficient to drive greater rates of broadband adoption. A report by the U.S. Government Accountability Office concluded that “even where broadband service is available … an adoption gap may persist due to the affordability of broadband and lack of digital skills.”[28] The GAO report notes that nearly one-third of those with access to broadband do not subscribe to it.[29] Brian Whitacre and his co-authors found that, while the reduced levels of broadband access in rural areas explained 38% of the rural-urban broadband-adoption gap in 2011, differences in other general characteristics—such as income and education—explain “roughly half of the gap.”[30]

A policy bulletin published by the Phoenix Center for Advanced Legal & Economic Public Policy Studies notes that the NTIA did not conclude that broadband was unaffordable for middle-class households.[31] George Ford, the bulletin’s author, collected data on broadband adoption by income level. The data indicate that, in general, internet-adoption rates increase with higher income levels. Higher-income households have higher adoptions rates (97.3%) than middle-income households (92.9%) which in turn have higher adoption rates than lower-income households (78.1%). For each of the 50 states and the District of Columbia, the Phoenix bulletin finds that middle-income internet-adoption rates are, to a statistically significant degree, higher than lower-income adoption rates.

The Phoenix bulletin concludes that broadband currently is “affordable” to middle-class households and that “no direct intervention is required” to ensure affordability to the middle class. These observations, however, invite questions regarding how NTIA intends to administer the BEAD program.

  • How will the agency distinguish broadband access from broadband adoption? A nearly 93% adoption rate among middle-income households suggests that somewhere close to 100% of these households have broadband access.
  • Does “all middle-class households” literally mean all? Even among the highest-income households, broadband adoption is less than 100%. Is NTIA’s objective to reach 100% of middle-income households, or the same level as higher-income households?
  • With such high adoption rates among middle-income households, what would be the cost of providing access and/or encouraging adoption by the remaining 4% to 7% of households?
  • It seems obvious that some households will not adopt broadband at any price. Should some households pay a negative price for broadband under the BEAD program?
  • Does NTIA really intend to encourage states to provide money to households that do not qualify for ACP but already adopt broadband? If so, in what sense does this actually further the goal of spending scarce resources to get the unconnected online?

As John Mayo, Greg Rosston, & Scott Wallsten note:

A substantial portion of the unserved and underserved areas of the country that are the likely targets of the BEAD program, however, are rural, low-population density areas where deployment costs will be high. These high deployment costs may seem to indicate that even “cost-based” rates—normally seen as an attractive competitive benchmark—may be high, violating the IIJA’s “affordability” standard.[32]

The only effective way to reduce broadband price, increase access, and improve quality simultaneously is to increase supply. That would call for prioritizing subsidies to broadband providers before consumers. Although consumer subsidies would increase the demand for broadband, which would have a knock-on effect of potentially attracting long-term investment from providers, it could also increase the price for households who do not receive the subsidy. Direct provider subsidies targeted at hard-to-connect areas could avoid many of the problems that price controls and direct user subsidies can create.[33] Ultimately, however, price controls—even de facto or “backdoor” price controls—would likely slow broadband deployment.

B.      ReConnect Loan and Grant Program

In 2018, Congress provided the secretary of U.S. Department of Agriculture authority to establish a pilot project intended to expand broadband deployment in rural areas, known as the ReConnect Loan and Grant Program. According to the Congressional Research Service, as of December 2022, USDA had awarded more than $3 billion of ReConnect funds through three funding rounds.[34]

With its third round of funding in 2021, USDA announced that, for the first time, applicants would receive a preference, in the form of “points,” for agreeing to abide by so-called “net neutrality” rules similar to those that the FCC had eliminated in 2018’s Restoring Internet Freedom Order. The department simultaneously added affordability—providing a “low-cost option”—as a point criteria. In addition, the third round required that projects must provide broadband access at speeds of at least 100/100 Mbps (i.e., 100 Mbps symmetrical speed). Round 4, announced in August 2022, includes the same criteria.

USDA’s third- and fourth-round requirements under the ReConnect program could be characterized as “back-door” rate regulation. They specify pricing as a point criteria (“low-cost option”) and impose a quality mandate (100/100 Mbps). While it does not mandate a low-cost option, the point weighting indicates that pricing is a priority in awarding funds under the program.

This sort of second-generation price control, while it does not create a centrally directed rate schedule, amounts to the same dynamic. These preferences, while potentially more diffuse in the short term, ultimately create the same medium- and long-term dynamics that drive up prices, and reduce quality and availability.

C.      New York State’s Affordable Broadband Act

In 2021, the State of New York passed the Affordable Broadband Act (ABA).[35] The act requires ISPs to offer all qualifying low-income households at least two internet-access plans: (1) download speeds of at least 25 megabits-per-second for no more than $15-a-month, or (2) download speeds of at least 200 megabits-per-second for no more than $20-a-month. Providers with fewer than 20,000 subscribers may be eligible for exemption from the law. More than one-third of households in the state would be eligible to participate in the program.

Before it went into effect, a group of ISPs obtained an injunction in federal court to block the law.[36] The plaintiffs claimed that the ABA amounted to common-carrier rate regulation, which is preempted by federal law. ISPs are regulated as an “information service” under Title I of the Federal Communications Act of 1934, rather than as Title II common-carrier “telecommunications services.” As such, the plaintiffs claim neither the FCC nor the states can regulate ISPs as common carriers.

New York attempted to dance around this complication by asserting that the ABA merely set a price ceiling.[37] Because ISPs were permitted to charge any price below the ceiling, “the ABA does not ‘rate regulate’ broadband services,” the state argued.[38] The court shut down that line of reasoning, citing several earlier decisions that conclude “‘[p]rice ceilings’ regulate rates.”[39] The matter is currently on appeal before the 2nd U.S. Circuit Court of Appeals, where oral arguments were heard in January 2023.[40]

D.     Net Neutrality and Zero Rating

The FCC’s 2015 Open Internet Order (“OIO”),[41] although explicitly forbearing from rate regulation,[42] was a regulatory scheme that imposed many of the same effects. Further, with prohibitions on practices like “zero rating,” the regulation walks right up to the line of explicit rate regulation, if not over it.

At an abstract level, the OIO was predicated on the idea that it was possible to impose some common-carriage obligations on broadband providers but to leave out rate regulation. Fundamentally, the OIO failed to take account of the economics that drive ISP investment and pricing, for both edge providers and consumers. In short, in a condition of scarcity—such as limited bandwidth and limited infrastructure to increase bandwidth—there will always be some form of rationing; it will be accomplished either through prices or through regulatory intervention. Even if a regulator disavows explicit rate regulation, intervention into providers’ business models and technical decisions will inevitably shape pricing in much the same way as explicit price regulation does, through the “hydraulic effect” of regulation.[43]

Generally speaking, the OIO imposed a form of “negative” rate regulation that short circuited the normal course of rationing among broadband providers and their customers. It prohibited providers from applying anything other than a zero price to edge providers.[44] It outright prohibited “paid prioritization”—that is, seeking payments for network utilization from edge providers like Google, Facebook, and Netflix—while casting suspicion on other pricing schemes under the Internet Conduct Standard.[45] Thus, on one hand, the OIO did explicitly regulate rates by imposing a zero price, and, on the other, implemented a de facto rate-regulation scheme by subjecting providers to regulatory scrutiny if they sought novel business relationships with partners.

The best example of this latter situation was the commission’s attack on “zero rating.” Zero rating is the practice of a broadband provider not counting data from certain sources against a customer’s data allowance within a given period.[46] In truth, this is a business model very familiar to any casual internet user: edge providers like gaming companies, email hosts, and social-media platforms frequently offer free or low-cost versions of their service in order to attract a critical mass of users.[47]

Zero-rated broadband service works identically. A content provider like Netflix or YouTube will partner with an ISP like T-Mobile or Comcast in order to provide broadband customers with access to the provider’s content without that use counting against their data plan. Zero rating does not mean that other services are blocked; just that those other services will count against a periodic data allowance.[48] Generally speaking, this sort of business arrangement is a boon to consumers, particularly low-income consumers who can only afford the most restrictive data plans.[49]

With the OIO, however, the FCC introduced the vague Internet Conduct Standard, which gave it broad latitude to ban practices like zero rating.[50] The standard prohibited providers from “unreasonably interfer[ing] with or unreasonably disadvantage[ing]” consumers’ access to lawful content, applications, or services, as well as edge providers’ ability to distribute lawful content, applications, or services.[51] In 2016, the FCC sent letters to AT&T and Verizon, suggesting that the two companies’ use of zero rating were likely violations of the OIO.[52]

Even this implicit threat of regulatory proceedings to examine the propriety of zero rating likely had a chilling effect. Indeed, in an analogous context, the U.S. Circuit Court of Appeals for the D.C. Circuit struck down earlier net-neutrality regulations from the FCC on the grounds that they amounted to the application of de facto common-carriage obligations, even though that commission had refrained from applying Title II.[53]

Regulatory presumptions against zero rating and other forms of paid prioritization similarly amount to de facto rate regulation.[54] As multi-sided platforms, broadband providers seek to balance service and pricing across users and edge providers. As regulation restricts broadband providers’ ability to seek agreements with other large service providers, investment and consumers prices will be forced to shift in order to accommodate. In the long run, this will result in price increases, shortages, declines in quality or, most likely, some mix of the three.

IV.    Conclusion

Both economics and history demonstrate that rate regulations that cap the price of a product below the market price lead to shortages by increasing the quantity demanded without increasing the quantity supplied. Over time, such price caps can reduce the overall supply, as providers curtail or slow output-improving investments.

Broadband rate regulation—whether in the forms of direct and explicit price controls or back-door de facto policies—will result in slowed broadband investment and deployment. Broadband providers have a wide range of investment opportunities, with expected returns as a key consideration in evaluating these opportunities. Policies like price ceilings, which reduce the returns on deployment investments, will in turn reduce the likelihood that such investments will be made, thereby slowing broadband deployment.

As we noted in an earlier issue brief, broadband providers—like all firms—have limited resources with which to make their investments.[55] While profitability is a necessary precondition for investment, not all profitable investments can be undertaken. Among the universe of potentially profitable projects, firms are likely to give priority to those that promise greater returns on investment relative to those with lower ROI. Thus, any evaluation of broadband deployment and access must examine not only whether a given deployment is likely to be profitable, but also how its expected returns compare to other investment opportunities.

In broadband, returns on investment depend on several factors. Population density, terrain, regulations, and taxes are all important cost factors. The consumer population’s willingness to adopt and pay for broadband are key demand-related factors. In addition to these cost and demand factors, timing factors concerning both investment and adoption affect the ROI of any deployment investment. Generally speaking, the longer it takes for a given deployment to recoup its investment and generate a return, the lower the ROI and, in turn, the lower the likelihood that the investment will be made. Similarly, binding rate regulation—whether explicit or de facto—will reduce the ROI of deployments subject to that regulation.

Not only would existing broadband providers make fewer and less-intensive investments to maintain their networks, but they would also invest less in improving quality:

When it faces a binding price ceiling, a regulated monopolist is unable to capture the full incremental surplus generated by an increase in service quality. Consequently, when the firm bears the full cost of the increased quality, it will deliver less than the surplus-maximizing level of quality. As Spence (1975, p. 420, note 5) observes, “where price is fixed … the firm always sets quality too low.”[56]

Quality suffers under price regulation not just because firms can’t capture the full value of their investments, but also because it is often difficult to account for quality improvements in regulatory-pricing schemes:

The design and enforcement of service quality regulations is challenging for at least three reasons. First, it can be difficult to assess the benefits and the costs of improving service quality. Absent accurate knowledge of the value that consumers place on elevated levels of service quality and the associated costs, it is difficult to identify appropriate service quality standards. It can be particularly challenging to assess the benefits and costs of improved service quality in settings where new products and services are introduced frequently.

Second, the level of service quality that is actually delivered sometimes can be difficult to measure. For example, consumers may value courteous service representatives, and yet the courtesy provided by any particular representative may be difficult to measure precisely. When relevant performance dimensions are difficult to monitor, enforcing desired levels of service quality can be problematic.

Third, it can be difficult to identify the party or parties that bear primary responsibility for realized service quality problems. To illustrate, a customer may lose telephone service because an underground cable is accidentally sliced. This loss of service could be the fault of the telephone company if the company fails to bury the cable at an appropriate depth in the ground or fails to notify appropriate entities of the location of the cable. Alternatively, the loss of service might reflect a lack of due diligence by field workers from other companies who slice a telephone cable that is buried at an appropriate depth and whose location has been clearly identified.[57]

None of these concerns dissipate where regulators use indirect, de facto means to cap prices. Broadband is a classic multi-sided market.[58] If the price on one side of the market is set at below-market rates through rate regulation, then there will be upward pricing pressure on the other side of the market. Ultimately, consumers who are not subject to the regulated rates will face higher prices, which puts pressure on policymakers to impose yet another layer of imprecise and complex regulation and even deeper constraints on investment.

It’s important to understand that rate regulation—in any form and whatever the imagined benefits—is not a costless endeavor. Costs and risk do not disappear under rate regulation. Instead, they are shifted in one direction or another—typically with costs borne by consumers through some mix of suppressed investment, sluggish improvements in quality, and reduced innovation.

Government policy may well be able to help accelerate broadband deployment to the unserved portions of the country where it is most needed. But the way to get there is not by imposing price controls on broadband providers. Instead, broadband access can best be expanded by removing costly, government-erected barriers to buildout and/or by subsidizing and educating consumers where necessary.

[1] The Editorial Board, Nationwide Rent Control?, Wall St. J. (Jan. 22, 2023), https://www.wsj.com/articles/nationwide-rent-control-congress-democrats-progressives-housing-president-biden-11674233540.

[2] Lawrence J. Spiwak, USTelecom and Its Aftermath, 71 Fed. Comm. L. J. 39 (2018), available at http://www.fclj.org/wp-content/uploads/2018/12/71.1-%E2%80%93-Lawrence-J.-Spiwak.pdf.

[3] FCC Reauthorization: Oversight of the Commission, Hearing Before the Subcommittee on Communications and Technology, Committee on Energy and Commerce, House of Representatives, 114 Cong. 27 (Mar. 19, 2015) (Statement of Tom Wheeler).

[4] Protecting and Promoting the Open Internet, 80 FR 19737 (Apr. 13, 2015) (codified at 47 CFR 1, 47 CFR 8, and 47 CFR 20), https://www.federalregister.gov/documents/2015/04/13/2015-07841/protecting-and-promoting-the-open-internet, (“2015 OIO”) at ¶¶ 51 & 538

[5] Id., Dissenting Statement of Ajit Pai, https://docs.fcc.gov/public/attachments/FCC-15-24A5.pdf.

[6] Tim Wu, Agency Threats, 60 Duke L.J. 1841, 1842 (2011).

[7] Gigi B. Sohn, A Policy Framework for an Open Internet Ecosystem, 2 Geo. L. Tech. Rev. 335 (2018) at 345.

[8] David Shepardson, FCC Nominee Does Not Support U.S. Internet Rate Regulation, Reuters (Dec. 1, 2021), https://www.reuters.com/world/us/fcc-nominee-does-not-support-us-internet-rate-regulation-2021-12-01.

[9] Id.

[10] The White House, Fact Sheet: The American Jobs Plan (Mar. 31, 2021), https://www.whitehouse.gov/briefing-room/statements-releases/2021/03/31/fact-sheet-the-american-jobs-plan (emphasis added).

[11] NY State Telecom. Assoc. v. James, 2:21-cv-2389 (DRH) (AKT), Memorandum and Order, Document 25 (E.D. N.Y. June 11, 2021), https://ecf.nyed.uscourts.gov/doc1/123117827301 (“Memorandum and Order”).

[12] See, for example, N. Gregory Mankiw, PRINCIPLES OF MICROECONOMICS, 4th ed., Thomson South-Western (2007); Paul Krugman & Robin Wells, Economics, 6th ed., MacMillan (2021); Steven A. Greenlaw & David Shapiro, Principles of Microeconomics 2nd ed., OpenStax (2017).

[13] Id., Mankiw.

[14] See, e.g., David L. Mengle, The Effect of Second Generation Rent Control on the Quality of Rental Housing, Fed. Res. Bank of Rich., Working Paper 85-5 (Nov. 1985), https://www.richmondfed.org/-/media/RichmondFedOrg/publications/research/working_papers/1985/pdf/wp85-5.pdf.

[15] Mankiw, supra note 12.

[16] Gitanjali Poonia, Why Does the U.S. Government Have 1.4 Billion Pounds of Cheese Stored in a Cave Underneath Springfield, Missouri?, Deseret News (Feb. 14, 2022), https://www.deseret.com/2022/2/14/22933326/1-4-billion-pounds-of-cheese-stored-in-a-cave-underneath-springfield-missouri-jimmy-carter-reagan.

[17] For example, the U.S. Department of Agriculture’s Price-Loss Coverage program issues payments when the effective price of a covered commodity is less than the respective reference price for that commodity. See, Agriculture Risk Coverage (ARC) & Price Loss Coverage (PLC), USDA (Oct. 2022), https://www.fsa.usda.gov/Assets/USDA-FSA-Public/usdafiles/FactSheets/2022/fsa_arc_plc_factsheet_101922.pdf.

[18] See, Richard H. K. Vietor, Contrived Competition: Regulation and Deregulation in America (1996) at 45 (“Since capacity could no longer serve as a means of differentiation, the trunk carriers had to devise new means of service competition. ‘Capacity wars’ gave way to ‘lounge wars.’”).

[19] See, e.g., Rent Stabilization, Oregon Dept. of Admin. Serv. (n.d.), https://www.oregon.gov/das/OEA/pages/rent-stabilization.aspx.

[20] Dave Kamper & Sebastian Martinez Hickey, Tying Minimum-Wage Increases to Inflation, as 13 States Do, Will Lift Up Low-Wage Workers and Their Families across the Country, Econ. Pol’y Inst. (Sep. 6, 2022), https://www.epi.org/blog/tying-minimum-wage-increases-to-inflation-as-12-states-do-will-lift-up-low-wage-workers-and-their-families-across-the-country.

[21] See, Darren Filson, Edward Keen, Eric Fruits & Thomas Borcherding, Market Power and Cartel Formation: Theory and an Empirical Test, 44 J. L. & Econ. 465 (2001).

[22] Vietor, supra note 17 at ch. 4.

[23] Id.

[24] Id.

[25] Supra notes 13-15

[26] Notice of Funding Opportunity, Broadband Equity, Access, and Deployment Program, NTIA-BEAD-2022, NTIA (May 2022), available at https://broadbandusa.ntia.doc.gov/sites/default/files/2022-05/BEAD%20NOFO.pdf (note that the IIJA itself did not include this requirement, and this is an addition by NTIA as part of the NOFO process; thus, it is unclear the extent to which this represents a valid requirement by NTIA under the BEAD program).

[27] Id.

[28] Broadband: National Strategy Needed to Guide Federal Efforts to Reduce Digital Divide, GAO-22-104611, U.S. Gov’t Accountability Off. (May 31, 2022), https://www.gao.gov/assets/gao-22-104611.pdf, [hereinafter “GAO-22-104611”].

[29] Id. (“According to FCC data, about 31 percent of people nationwide who have access to broadband at speeds of 25/3 Mbps have not subscribed to it ….); see also, How Do Speed, Infrastructure, Access, and Adoption Inform Broadband Policy?, Pew Research Center (Jul. 7, 2022), https://www.pewtrusts.org/en/research-and-analysis/fact-sheets/2022/07/how-do-speed-infrastructure-access-and-adoptioninform-broadband-policy (“nearly 1 in 4 Americans do not subscribe to a home broadband connection, even where one is available”).

[30] Brian Whitacre, Sharon Strover, & Roberto Gallardo, How Much Does Broadband Infrastructure Matter? Decomposing the Metro–Non-Metro Adoption Gap with the Help of the National Broadband Map, 32 Gov’t Info. Q. 261 (2015).

[31] George S. Ford, Middle-Class Affordability of Broadband: An Empirical Look at the Threshold Question, Phoenix Ctr. for Adv. Leg. & Econ. Pub. Pol’y Stud., Pol’y Bull. No. 61 (Oct. 2022), https://phoenix-center.org/PolicyBulletin/PCPB61Final.pdf.

[32] John W. Mayo, Gregory L. Rosston & Scott J. Wallsten, From a Silk Purse to a Sow’s Ear? Implementing the Broadband, Equity, Access and Deployment Act, Geo. U. McDonough Sch. of Bus. Ctr. for Bus. & Pub. Pol’y (Aug. 2022), https://georgetown.app.box.com/s/yonks8t7eclccb0fybxdpy3eqmw1l2da?mc_cid=95d011c7c1&mc_eid=dc30181b39.

[33] Even as a second-best option, user subsidies remain far preferable to price controls, as they at least directionally work within a market framework and encourage providers to deploy where there is genuine need and demand.

[34] Lisa S. Benson, USDA’s ReConnect Program: Expanding Rural Broadband, Cong. Res. Serv., R47017 (Dec. 14, 2022), https://crsreports.congress.gov/product/pdf/R/R47017.

[35] Memorandum and Order, supra note 11.

[36] Id.

[37] Id. (“In Defendant’s words, the ABA concerns ‘Plaintiffs’ pricing practices’ by creating a ‘price regime’ that ‘set[s] a price ceiling,’ which flatly contradicts her simultaneous assertion that ‘the ABA does not “rate regulate” broadband services.’”)

[38] Id.

[39] Id.

[40] Randolph J. May & Seth L. Cooper, Second Circuit Hears Preemption Challenge to New York’s Broadband Rate Regulation Law, FedSoc Blog (Feb. 7, 2023), https://fedsoc.org/commentary/fedsoc-blog/second-circuit-hears-preemption-challenge-to-new-york-s-broadband-rate-regulation-law.

[41] 2015 OIO, supra note 4.

[42] As noted above, however, the FCC still retained the power to impose rate regulation at a future date. This obviously muddies the discussion, as a looming threat of potential rate regulation would likely exert some influence over broadband providers’ decisions.

[43] See Geoffrey A. Manne, The Hydraulic Theory of Disclosure Regulation and Other Costs of Disclosure, 58 Ala. L. Rev. 473 (2007).

[44] The OIO banned paid prioritization outright, but regulated nonlinear pricing mechanisms like sponsored data under the Internet Conduct Standard. See 2015 OIO, supra note 4 at ¶ 151-53. But the order also rejected the “commercially reasonable” standard of the 2010 OIO and replaced it with a more amorphous, and more restrictive, “unreasonable interference or unreasonable disadvantages” standard. Following the commission’s letters expressing its hostility to AT&T’s and Verizon’s zero-rating programs (supra note 52, and accompanying text), it is safe to assume that such pricing schemes stood on extremely thin ice under the 2015 OIO.

[45] See 2015 OIO, supra note 4 at ¶ 151-53.

[46] See 2015 OIO, supra note 4 at ¶ 151; Jeffrey A. Eisenach, The Economics of Zero Rating, NERA (Mar. 2015), available at https://www.nera.com/content/dam/nera/publications/2015/EconomicsofZeroRating.pdf.

[47] See, e.g., Geoffrey A. Manne & Kristian Stout, In the Matter Of: Telecom Regulatory Authority of India’s 9/12/15 Consultation Paper On Differential Pricing For Data Services at 4 and accompanying citations, Int’l Ctr. for L & Econ. (Jan. 4, 2015), available at https://laweconcenter.org/wp-content/uploads/2017/08/icle-india_diff_pricing_comments_2016.pdf.

[48] Id. at 9.

[49] See, Understanding and Appreciating Zero-Rating: The Use and Impact of Free Data in the Mobile Broadband Sector, Multicultural Media, Telecom and Internet Council (May 9, 2016), available at http://mmtconline.org/WhitePapers/MMTC_Zero_Rating_Impact_on_Consumers_May2016.pdf.

[50] 2015 OIO, supra note 4 at ¶ 136.

[51] Id.

[52] See Jeff Dunn, The FCC Thinks AT&T’s Policies ‘Harm Consumers’ – And It’s Warning Verizon, Too, Business Insider (Dec. 2, 2016), http://www.businessinsider.com/fcc-verizon-att-zero-rating-net-neutrality-letter-directv-now-2016-12.

[53] Verizon, 740 F.3d at 657 (“The Commission has provided no basis for concluding that in permitting ‘reasonable’ network management, and in prohibiting merely ‘unreasonable’ discrimination, the Order’s standard of ‘reasonableness’ might be more permissive than the quintessential common carrier standard.”).

[54] See, e.g., Kristian Stout, Geoffrey A. Manne, & Allen Gibby, Policy Comments of the International Center for Law & Economics, Restoring Internet Freedom NPRM, WC Docket No. 17-108 at 36 and associated citations, Int’l Ctr. for L. & Econ. (Jul. 17, 2017), available at https://laweconcenter.org/wp-content/uploads/2017/09/icle-comments_policy_rif_nprm-final.pdf; see also Daniel A. Lyons, Usage-Based Pricing, Zero-Rating, and the Future of Broadband Innovation, 11 Free State Foundation Perspectives 1 (2016), http://works.bepress.com/daniel_lyons/80.

[55] Eric Fruits & Kristian Stout, The Income Conundrum: Intent and Effects Analysis of Digital Discrimination, Int’l Ctr. for L & Econ., Issue Brief 2022-11-14 (Nov. 2022), https://laweconcenter.org/wp-content/uploads/2022/11/The-Income-Conundrum-Intent-and-Effects-Analysis-of-Digital-Discrimination.pdf.

[56] David E. M. Sappington & Dennis L. Weisman, Price Cap Regulation: What Have We Learned from Twenty-Five Years of Experience in the Telecommunications Industry?, 38 J. Regul. Econ. 227 (Sep. 2010), http://bear.warrington.ufl.edu/centers/purc/docs/papers/1012_Sappington_Price_Cap_Regulation.pdf, at 9.

[57] Id. at 10.

[58] Issue Spotlight: Two-Sided Markets, Int’l Ctr. for L & Econ. (Nov. 8, 2022), https://laweconcenter.org/resources/policy-comments-international-center-law-economics-restoring-internet-freedom-nprm.

Source: SSRN

ICLE Issue Brief

UK Payment System Regulator Market Reviews: Initial Concerns

Introduction The UK Payment System Regulator (PSR) is currently in the process of conducting two market reviews related to card payments. One of the two regards consumer cross-border interchange fees...

Introduction

The UK Payment System Regulator (PSR) is currently in the process of conducting two market reviews related to card payments. One of the two regards consumer cross-border interchange fees between the United Kingdom and the European Economic Area (EEA),[1] while the other relates to card scheme and processing fees.[2] This brief raises some initial concerns regarding the two reviews.

The most significant concern these market reviews raise is the implied “market” under investigation. By focusing narrowly on two very specific aspects of the overall payment system, the reviews almost by definition rule out a full analysis of the ecosystem. This is most unfortunate. Decades of research shows categorically that payment systems are highly complex multi-sided markets that have evolved over many decades—and continue to evolve—into a delicately balanced, technologically advanced ecosystem.

Payment systems and the thousands of banks that interoperate over them have invested tens of billions of dollars into their development. These investments, and associated innovations in technologies and the rules governing the systems, have been driven by a decades-long process of dynamic competition. That process has involved not only the main payment-system operators, but also many other businesses involved in payments processing. As a result, billions of consumers are now able to use payment cards and millions of merchants accept them. The system’s economic benefits unquestionably far outweigh the costs.

While it is always possible to conceive of models against which extant payment systems may appear “imperfect,” that does not necessarily mean there is any “market failure”; models are not reality. By considering only very narrow questions relating to specific aspects of the operations of payment systems, the PSR is likely to make inappropriate conclusions.

This brief begins with a description of some of the primary benefits that payment-card systems deliver. Section II offers a description of the economics of payment systems. Section III discusses some common misconceptions regarding payment systems, which have arisen due to misunderstanding the economics that underpins them and failing to appreciate the history and nature of the dynamic competition that explains the existing market structure. Section IV considers the market reviews in the context of the PSR’s overall remit. Section V draws some conclusions.

I. The Benefits of Payment-Card Systems

The PSR acknowledges that payment cards “are critical to the smooth running of the UK economy as they enable people to pay for their purchases and merchants to accept payments for goods and services.”[3] But it is worth spelling out why payment cards are so critical. In no small part, this comes down to the numerous inherent advantages that payment cards and their associated systems have over other types of payment, such as cash and checks. These include: [4]

  • They enable consumers to spend more than they have in their wallet at the time of the purchase, which in turn reduces the amount of cash that they need to withdraw from the bank.
  • Credit cards enable consumers to spend more than they have in their bank accounts at the time of the purchase. Because credit-card issuers typically charge no interest if the statement balance is paid by the due date (usually a month after issuance), cardholders are able to smooth their consumption patterns at much lower cost than if they were required to hold cash in their account or use an overdraft facility.
  • By increasing the ability of consumers to spend, payment cards benefit merchants, who sell more goods and services.
  • Merchants also benefit from reduced costs associated with handling cash, including the need for float and the risk of theft.

Payment cards have been essential to the development of e-commerce and were literally a lifeline during the COVID-19 pandemic, both for consumers and for businesses (especially smaller businesses), when millions of people were unable to leave their homes and primarily purchased essential goods through online merchants.

Figure I: Use of Cash in the UK Since COVID-19

SOURCE: PSR[5]

Despite these benefits, merchants have for decades complained about the prohibitive cost of processing card transactions. As explained below, these complaints reflect a misunderstanding of the nature and benefits of card-payment systems.

II.      The Economics of Payment Systems

A proper economic assessment of any payment system must account for the fact that both merchants and consumers must perceive benefits for such systems to be successful.  If too few merchants accept a particular form of payment, consumers will have little reason to possess it and issuers will have little incentive to issue it. Likewise, if too few consumers possess a form of payment, merchants will have little reason to accept it.

Conceptually, economists describe such situations as “two-sided markets”: consumers are on one side, merchants on the other, and the payment system acts as the platform facilitating interactions between them.7F[6] Other examples of two-sided markets include newspapers, shopping malls, social-networking sites, and search engines.

The challenge for any two-sided market platform is to attract and retain sufficient participants on one side of the market to persuade participants on the other side to adopt and stay on the platform, thereby making the system self-sustaining and maximising the joint net benefits of the platform to all participants.8F[7] To achieve this, platforms must allocate the costs and benefits of the system among the various parties, which is typically done by charging different fees to the different sets of participants on each side of the market in such a way as to create an equitable and efficient balancing.9F[8] Often this means that participants on one side will pay a larger share of the overall costs than participants on the other side.

Take newspapers, which as noted are a classic example of a two-sided market, with consumers on one side, advertisers on the other, and the newspaper acting as the platform in the middle. In essence, advertisers seek to target their adverts to specific consumers, while consumers are mainly interested in reading news, opinions, and other content. A newspaper thus provides content that appeals to consumers so that they read the paper. By attracting readers who might also view advertisements, the newspaper is able to sell advertisements, which help to cover the costs of producing and distributing the newspaper.

In the case of payment-card systems, the larger the number of holders of cards from a particular system (e.g., Visa, Mastercard, or American Express), the larger will be the number of merchants willing to accept cards on that system. Meanwhile, the larger the number of merchants that accept cards on a particular system, the larger will be the number of consumers who wish to hold cards on that system.

Maintaining such a system is challenging and expensive. In no small part, this is because payments are subject to counterparty risks—in particular, risks of default (non-payment), fraud, and theft. This problem so bedevilled early payment cards that many floundered within a few years.[9] The systems that succeeded did so because they figured out how to encourage adoption by both sides of the market and to limit counterparty risk. This entailed the introduction of effective security systems, setting appropriate liability rules, and charging fees that covered all the costs of operating the system. Perhaps most importantly, the systems that flourished were those that realised merchants had stronger incentives than consumers to bear the costs of the system, due to the significant benefits they receive, and introduced fee structures that reflected those incentives.

In three-party card systems, the merchants’ transaction fee is charged directly by the system operator. In four-party systems, merchants pay acquirers a “merchant service charge” (MSC), which includes the acquirer’s processing costs and the “interchange fee.” The default interchange fee is a charge made by the system operator that is paid to the issuer (in the form of a deduction from the amount sent by the issuer to the acquirer when settling the transaction).[10] In addition, the system operator charges fees to both acquirers and issuers, called “scheme” and “processing” fees, that cover the system costs. Figure II, which is taken from the PSR, provides a simplified schematic of the four-party card system. In practice, there are often other parties involved, including payment gateways and payment processors.[11]

Figure II: Simplified Schematic of Four-Party Card Payment System

SOURCE: PSR[12]

As discussed below, the various three- and four-party payment systems have been engaged in a decades-long process of dynamic competition in which each has sought—and continues to seek—to discover how to maximise value to their merchants and consumers. Card-payment systems also compete with other payment methods, including legacy methods such as cash and cheques, as well as the many methods that have emerged more recently, such as online transfers of various kinds. This has involved considerable investment in innovative products, including more effective ways to encourage participation, as well as the identification and prevention of fraud and theft.

Payment-card systems seek to optimise interchange fees to maximise the benefits of the system to participants on both sides of the market. Revenue from these fees thus covers a wide range of things, including: system operations, card issuance, customer service, fraud prevention and resolution, rewards, fraud-protection cover, and car-rental insurance (where these are offered). Moreover, these services are today often offered for free to cardholders (no annual fee) or even at a negative price, such as when rewards are provided. Finance charges on revolving balances also generate substantial revenue, much of which covers the costs of underwriting, servicing, and charge-offs on credit balances.

Similarly, many banks provide free current accounts to those who maintain positive balances (and in some cases even fee-free overdraft facilities up to a limit). The costs of such accounts are covered by other charges, including debit-card interchange fees.

III.    Misunderstanding the Economics of Payment Systems

While it may seem iniquitous for a platform to charge one side of the market more than the other, it is often efficient and ultimately socially beneficial.[13] In the case of payment systems, if the operator sets the price too high for some consumers, they will be unwilling to use the platform; similarly, if the operator sets the price too high for some merchants, they will not be willing to use the platform.

Since one side of the market is typically more price sensitive than the other side, joint net benefits are maximised when participants on the less price-sensitive side of the market incur a greater proportion of the system costs. This enables overall greater participation in the system, thereby achieving greater economies of scale. In the case of card-payment systems, the relatively large benefits merchants receive from accepting cards makes them less price sensitive than consumers, so it makes sense for them to pay a larger share of the transaction fees. This was true even when cards were a tiny fraction of payments and there were few, if any, competing cards for consumers to choose among. This demonstrates that it is not due to any perception among merchants that they lack choice.

The ineluctable benefits of such cross-market subsidies have, unfortunately, often been misconstrued as harmful by regulators, especially in markets where there are few competitors. In many cases, what seems to have happened is that the economies of scale entailed in the development and maintenance of certain systems has meant that only a small number of competing firms can operate efficiently. Regulators typically assume axiomatically, however, that the largest firms in markets with only a small number of competitors have a dominant position that has been created and is reinforced by those firms’ anticompetitive conduct. They thus automatically view all such conduct with suspicion.

Globally, there are many card-payment systems, although most of these operate only at a national level.[14] In the UK, as the PSR notes, two payment systems, Mastercard and Visa, represent the vast majority of consumer-debit and credit-card transactions.[15] But as the history shows, these large market shares were acquired through the development of technologies and rules that limited fraud and other counterparty risk, as well as by improving the efficiency and efficacy of payments, thereby creating enormous benefits to both consumers and merchants. While all markets are imperfect when compared to theoretical models of “perfect competition,” there is simply no evidence of “market failure” that might justify regulatory intervention.

It is also worth noting that, while card payments represent a large proportion of retail payments in the UK, they represent a relatively small fraction of all payments. Table 1 shows the value of payments made using various non-cash methods over the year from November 2021 to October 2022. This excludes higher-value payments settled directly over CHAPS, which accounted for more than £90 trillion in value.[16] As can be seen, the vast majority of payments were made over BACS and the Faster Payments systems, while cards (debit and credit) accounted for only about 11 per cent.

Table 1: Transaction Values of Selected UK Payments Systems, November 2021-October 2022

SOURCES: PayUK[17] and UK Finance[18]

A.      A Brief History of Payment-Card Systems

While merchant-specific charge cards had existed since the early 20th Century, the first multi-merchant payment-card systems in the United States were Diners Club and American Express. These were and in most cases are three-party cards; that is, they operate a closed ecosystem in which they have direct relationships with both merchants and cardholders (Amex now also acts as a third-party provider).[19]

Diners Club began in 1950 as a limited-purpose card that could be used at restaurants.[20] Starting with restaurants in New York City, the card gradually expanded to other cities and other hospitality services before becoming fully multipurpose. In 1953, Diners Club became the first international payment card, with acceptance in the UK, Canada, Cuba, and Mexico. International expansion continued gradually and, by 1967, Diners Club had a presence in 130 countries.

The American Express Card started as an alternative to Travellers’ Cheques, which were an already-popular payment product.[21] From an initial presence in the United States and Canada, American Express expanded its card issuance internationally in 1972.

While numerous banks experimented with their own credit cards, the first truly successful such card venture was BankAmericard, which began in 1958.[22] Initially a three-party card operated exclusively by Bank of America, in 1966, Bank of America began issuing licenses to other banks.[23] In 1970, National BankAmericard became a separate company owned by its member banks and, in 1976, it was rebranded as Visa.[24]

The precursors to Mastercard were regional associations of U.S. banks that had developed in response to restrictions on branch banking in 15 states, which meant that banks could only operate as individual units.[25] In 1966, several of these regional associations formed the Interbank Card Association (ICA), which established the authorisation, clearing, and settlement rules for all the banks in the ICA.[26] In 1969, ICA rebranded its cards as Interbank: the Master Charge card and, in 1979, the ICA became MasterCard.

The history of credit cards in the UK is similar. Finders Services was the first payment-card operator in the nation, launching its charge card here in 1951.[27] In 1962, Finders Services merged with Diners Club, becoming the UK’s first international payment card.[28] Amex followed in 1963.[29] Then, in 1966, Barclays became the first international licensee of BankAmericard, initially launching the Barclaycard as a charge card.[30] The following year, the Bank of England issued the first license to operate a credit card to Barclays and Barclaycard became the UK’s first credit card.[31] Barclaycard became a founding member of International BankAmericard Inc (IBANCO) when that was formed in 1974.[32] In 1977, IBANCO was rebranded Visa.[33] From 1981, Visa International was reorganised into five semi-autonomous international divisions, with their own boards and operational regulations, but subject to framework rules set at headquarters.[34]

The history of Mastercard in the UK is intertwined with Eurocard, which was founded in 1964 in Sweden and moved its corporate base to Belgium in 1965, from where it operated a pan-European not-for-profit association of card-issuing banks.[35] In 1968, Eurocard and the Interbank Card Association formed a strategic alliance. In 1971, Lloyds Bank, Midland Bank, National Westminster Bank, and (slightly later) Royal Bank of Scotland/Williams and Glyn formed a joint venture, the Joint Credit Card Company (JCCC), which launched the Access credit card in 1972.[36] In 1973, Access purchased a 15% share of Eurocard and, the following year, joined the Interbank Card Association.[37] In 1992, MasterCard merged with Europay International (which itself was a merger of Eurocard and Eurocheque).[38] In 1996, MasterCard purchased Access.[39]

B.      Dynamic Competition in Payment Systems

This brief history of the evolution of payment-card systems over the past 70 years shows how those systems gradually expanded. Underpinning that expansion was a process of dynamic competition, with payment networks continuously innovating ways to increase their security, scale, and efficiency. Among the major technological innovations have been:

  • The plastic card (previously, cards had used card stock).
  • Electronic systems for authentication, clearing, and settling transactions.
  • The magnetic stripe (magstripe) and associated data standards, which enabled more secure authentication.
  • The personal identification number (PIN), which was initially developed to enable the use of cards to withdraw cash directly from bank accounts using cash machines.
  • The EMV Chip—developed by a consortium of card networks that initially comprised Eurocard, MasterCard and Visa (EMVCo)—stores card information using public-key encryption technology and sends a one-time token to the POS machine. EMV chips are more difficult to “skim” than magstripes and, because the card number is not shared with the POS machine, dramatically reduce the potential for hackers to steal and use stored card information from merchants.
  • Contactless Tokens (cEMV), which are similar to the tokens produced by EMV Chips and enable similar protections for contactless transactions, whether using a card or a mobile phone.
  • Address verification (AVS), which is mainly used during card-not-present (CNP) transactions, such as telephone and online sales.
  • The card verification code (CVC/CVV), which is a three- or four-digit number unique to the card that is not held in merchant databases, and which is also primarily used during CNP transactions.
  • Two-factor authentication (2FA) entails the use of at least two independent proofs that the card user is legitimate, such as the CVV and a one-time password. 2FA is most commonly used for CNP transactions but is also sometimes used as a second line of defense for point-of-sale (POS) transactions identified as unusual.
  • Machine-learning-based systems that identify potentially fraudulent transactions by comparing transactions in real time with cardholders’ spending patterns, enabling issuers to block transactions.
  • 3D-Secure (3DS), which is an authentication system developed by EMVCo primarily for online transactions. It is a two-stage process: stage one involves using the information sent in the first (authorization) message to check against a cardholder’s profile; if the proposed payment fits the profile, it is permitted, and if not, then the cardholder is asked to complete 2FA on the transaction.[40]

We are now so used to making payments with cards that it is difficult to imagine just how important these innovations have been, let alone the scale of investment that went into them (and the many others, including those that were rejected or discarded). With that in mind, it is worth noting the dramatic impact of the introduction of one of the more recent innovations: contactless cEMV tokens. Over the past decade, these have facilitated a veritable revolution in contactless payments made using cards and cell phones. As Figure III shows, the number of contactless payments in the UK grew from almost nothing to more 1.2 billion by the end of 2021, representing about half of all card-payment-system transactions.

Figure III: Number of Contactless Payment Transactions, UK, 2015-2021 (Millions)

SOURCE: Statista[41]

Contactless payments dramatically reduce the time needed to complete a transaction at checkout, relative to cash or chip and PIN, with clear benefits for both merchants and consumers.[42] During the COVID pandemic, the ability to transact without touching a terminal or signing a payment-authorization slip also reduced the cost and difficulty of complying with rules intended to limit exposure through contact.[43] In addition, cEMV has gradually been integrated into public-transport systems, enabling riders on buses and trains in London, and increasingly across the UK, to use their payment card or mobile phone to tap in and out, eliminating the need for cash or additional transactions.[44]

There have also been many important innovations in incentive systems, the most notable being:

  • Merchant liability for non-authenticated fraudulent transactions above a certain minimum amount, which incentivises merchants to undertake authentication.
  • Prohibiting merchants who accept cards from a payment system from discriminating against that system by imposing surcharges on payments made using that system.
  • Guaranteeing zero liability for card users who have been subject to fraud on certain conditions (such as that the card user has notified the issuer that their card has been stolen).
  • Various forms of insurance, including purchase protection, return protection, extended warranty protection, cell-phone protection, price protection, rental-car liability protection, and travel insurance.
  • Rewards, including cashback and merchant-specific rewards (often on co-branded cards)

By offering these incentives, card issuers encourage adoption and use by cardholders. In addition, merchant-specific rewards encourage loyalty to that merchant. And, importantly, these incentives and technological innovations have been made possible by the system of fees, including most notably the interchange fee but also the scheme fees, processing fees, and acquiring fees.

Furthermore, there have been important business-model innovations over time that have improved the scale efficiency, responsiveness, and effectiveness of the systems. As noted, Visa and Mastercard initially deployed quite different ownership and management models. BankAmericard initially adopted a franchise model and then, from 1970, National BankAmericard/Visa operated as a joint-venture company, thereby overcoming conflicts of interest that arose from one bank acting as an issuer and an acquirer, while also setting the rules of the system for other issuers and acquirers.[45] By contrast, Mastercard and Eurocard both began as non-profit associations, which enabled them rapidly to scale, including by absorbing Access (which until then had operated as a profit-sharing joint venture), but this resulted in management challenges. The merger of Mastercard and Europay International in 1992 addressed some of those problems by creating a more streamlined structure and a more coherent global brand. Then, in 2006, MasterCard reorganised as a for-profit company and listed on the New York Stock Exchange through an initial public offering, enabling more centralised decision-making. In 2008, Visa also listed on the NYSE.

In short, the two largest global-payment systems emerged, survived, and thrived first and foremost by identifying and implementing superior solutions to the challenges of building and maintaining payment systems locally, nationally, regionally, and eventually, globally.

The large market share of these two firms operating at a global level is clearly not a consequence of some pre-existing market structure. On the contrary, the structure of the market for payments is a consequence of dynamic competition in technology, incentives, and business models.

C.      The Ongoing Process of Dynamic Competition

This dynamic competition continues, with innovative technologies and new global players emerging and deploying different business models. For example, PayPal offers users the ability to pay for services and goods purchased online and provides them with some of the same protections offered by credit cards, such as fraud monitoring and purchase protection.[46] PayPal operates a dual model in which users may fund payments either using their payment card or by making an ACH transfer to their PayPal account.[47] PayPal also offers users the ability to “buy-now-pay-later” (BNPL) at some merchants, with options either to make four bi-weekly payments with zero interest, or to spread the payment over a longer period (6, 12, 18, or 24 months), paying an interest rate that currently ranges from 0% to 29.99%, depending on the user’s credit score.[48]

In the past decade, several standalone BNPLs have entered the market, including Afterpay, Affirm, Flexpay, Klarna, Sezzle, Splitit, and Zip.[49] In 2021, merchant-payment-gateway provider Square purchased Afterpay, enabling the use of BNPL for in-store purchases in the United States.[50] In the UK, Square has partnered with BNPL provider ClearPay, enabling it to provide a similar offering.[51] Meanwhile, Stripe, another gateway provider, has partnered with several BNPL companies, enabling it to make similar offerings in several countries, including the UK.[52]

When offering zero-interest payment solutions to consumers, BNPLs typically charge the retailer a transaction fee of between 2% and 8%, depending on the consumer’s credit score and the type of merchant.[53] In the United States, Square/Afterpay charges the purchaser a standard rate of 6% plus a transaction fee of 30c.[54] By contrast, when offering longer-term payment solutions, the merchant pays a transaction fee and the consumer pays the interest.[55]

In addition to consumer-oriented BNPLs, there are business-to-business BNPLs. For example, in the UK, Funding Circle’s Flexipay (not to be confused with Flexpay or Payflex, a South African BNPL) offers loans of between £2,000 and £250,000, with the ability to spread payments over three months at an interest rate of 3% (as of the time of writing).[56]

Another example is real-time payments (RTP) systems, such as the UK’s Faster Payment System, which enable users to make near-instant peer-to-peer payments online and using mobile apps.[57] RTP systems typically do not replicate the fraud-protection and other counter-party risk offerings of traditional payment cards, nor do they enable consumers to defer payment, so they are likely less attractive than payment cards for making payments to merchants—especially when those merchants are unfamiliar and/or the size of the payment is large.[58] While the UK’s Confirmation of Payee system has somewhat reduced problems—such as, as the PSR notes,[59] automated push payment (APP) fraud—APP fraud remains very high, leading the PSR to propose that payment-service providers (PSPs) guarantee refunds for fraudulent payments in excess of £100.[60] Such a requirement would impose considerable additional costs on PSPs. By effectively transferring a considerable proportion of liability to those PSPs, it also would reduce payors’ incentives to undertake due diligence on payees. This, in turn, might lead PSPs to introduce more extensive screening of payments, which could well lead to overinclusive restrictions that harm smaller, less well-known but nonetheless legitimate payees.

At the same time, card issuers and payment systems continue to invest in improved methods for verifying the identity of persons making transactions, including most notably the development and deployment of a range of biometric technologies.[61] Meanwhile, many payment-card issuers are partnering with BNPL operators to provide alternative payment options for cardholders.[62]

IV.    The Market Reviews in the Context of the PSR’s Remit

Unfortunately, there is no evidence that the PSR intends to investigate the broader market for payments in the UK, of which payment cards represent only about 11%.[63] Instead, it has proposed to undertake two discrete reviews of very specific and narrow aspects of payments card systems’ operations, seemingly without any intention to consider the implications on the wider ecosystem. This seems doomed to draw inappropriate conclusions.

This section outlines the PSR’s remit and then discusses the two market reviews in the context of that remit, taking into consideration the foregoing discussion of the nature of payment systems and the dynamic competition that has driven their evolution.

A.      The PSR’s Remit

Section 49 of the Financial Services (Banking Reform) Act 2013 (FSBRA) states that “In discharging its general functions relating to payment systems the Payment Systems Regulator must, so far as is reasonably possible, act in a way which advances one or more of its payment systems objectives.”[64] It then lists three objectives: (a) the competition objective, (b) the innovation objective, and (c) the service-user objective, which are defined in the subsequent sections.[65]

Section 50 (1) of the FSBRA states that: “The competition objective is to promote effective competition in—(a) the market for payment systems, and (b) the markets for services provided by payment systems, in the interests of those who use, or are likely to use, services provided by payment systems.”

Section 50 (2) of the FSBRA states that: “The reference in subsection (1) to promoting effective competition includes, in particular, promoting effective competition— (a) between different operators of payment systems, (b) between different payment service providers, and (c) between different infrastructure providers.”

Section 50 (3) of the FSBRA states that:

The matters to which the Payment Systems Regulator may have regard in considering the effectiveness of competition in a market mentioned in subsection (1) include—

  • the needs of different persons who use, or may use, services provided by payment systems;

  • the ease with which persons who may wish to use those services can do so;

  • the ease with which persons who obtain those services can change the person from whom they obtain them;

  • the needs of different payment service providers or persons who wish to become payment service providers;

  • the ease with which payment service providers, or persons who wish to become payment service providers, can provide services using payment systems;

  • the ease with which payment service providers can change the payment system they use to provide their services;

  • the needs of different infrastructure providers or persons who wish to become infrastructure providers;

  • the ease with which infrastructure providers, or persons who wish to become infrastructure providers, can provide infrastructure for the purposes of operating payment systems;

  • the needs of different operators of payment systems;

  • the ease with which operators of payment systems can change the infrastructure used to operate the payment systems;

  • the level and structure of fees, charges or other costs associated with participation in payment systems;

  • the ease with which new entrants can enter the market;

  • how far competition is contributing to the development of efficient and effective infrastructure for the purposes of operating payment systems;

  • how far competition is encouraging innovation.

Section 51 (1) of the FSBRA states that: “The innovation objective is to promote the development of, and innovation in, payment systems in the interests of those who use, or are likely to use, services provided by payment systems, with a view to improving the quality, efficiency and economy of payment systems.” While Section 51 (2) states that: “The reference in subsection (1) to promoting the development of, and innovation in, payment systems includes, in particular, a reference to promoting the development of, and innovation in, infrastructure to be used for the purposes of operating payment systems.”

Section 52 of the FSBRA states that: “The service-user objective is to ensure that payment systems are operated and developed in a way that takes account of, and promotes, the interests of those who use, or are likely to use, services provided by payment systems.”

It is thus clear that, in principle, the PSR has a broad remit to investigate the functioning of payment systems. As such, it could undertake a broad review that considers the dynamic competition described earlier in this brief.

B.      The Market Reviews

Despite the PSR’s broad remit, it has chosen instead to undertake two very narrow market reviews. There is a grave danger that, in so doing, it will misconstrue the nature of the market for payments.

One is reminded of the rather wonderful 1986 “points of view” TV advertisement for The Guardian newspaper.[66] The ad began with a brief clip, from one angle, of a skinhead apparently running away from something. This was followed by a clip of the skinhead from another angle which shows him apparently trying to steal a besuited gentleman’s briefcase. Then, finally, we were shown an aerial view in which one can see that the skinhead is actually trying to save the other man from being crushed by a pallet of falling bricks. The point being that, if a policeman or other bystander had intervened to stop the skinhead on the presumption that he had committed or was about to commit a crime, based on seeing the situation only from the perspective of the first or second clips, the man in the suit might well have died or been grievously injured. As the advert notes at the end, “It’s only when you get the whole picture you can fully understand what’s going on.”

1.        Market review of UK-EEA cross-border interchange fees

In the case of the market review of UK-EEA consumer cross-border interchange fees, the PSR states:

We want to understand the rationale for and the impact of the rises in CNP IF levels for UK-EEA consumer debit and credit CNP transactions. We are concerned that the ability of Mastercard and Visa to increase these fees is an indication that there are market(s) which are not working well and may not support our statutory competition, innovation or service-user objectives.[67]

Here, the PSR seems to have assumed that an increase in prices is prima facie evidence of market failure. But a mere rise in prices does not provide such evidence. The fact is that, following the introduction of the IFR and prior to Brexit, the IFs were set by the EU, not by the market. Since then, domestic rates have been regulated at the same levels,[68] making it more likely that those IFs were (and, within the EEA, still are) not set at a level that reflects an optimal balance for the payments ecosystem.

Where prices for CNP IFs are set by market participants, they are generally higher than for card-present transactions. This is a straightforward consequence of the higher risks of fraud associated with CNP transactions.[69] Meanwhile, in markets where IFs for international transactions are set by market participants, those IFs include a premium to cover additional costs associated with operating the international system, as well as the higher counterparty risks (fraud and default) associated with such transactions. This leads to two conclusions:

  1. The appropriate prima facie assumption of the PSR, in response to the increase in IFRs for UK-EEA CNP transactions, should have been that it is a sign that the market is working well—e., the very opposite of the assumption that the PSR seems to have made.
  2. To investigate the appropriateness or otherwise of any IFR, it is necessary to understand fully the market in which it is being applied. In this case, the market is the entire global payments system, since UK-EEU transactions are but a tiny fraction of that system, which as discussed above has evolved over decades. At the very least, it entails a full analysis of both CNP and UK-EEA payments systems, not merely the narrow aspect of (and costs associated with) UK-EEA interchange fees.

2.        Market review of card scheme and processing fees.

In the case of the market review of cards’ scheme and processing fees, the PSR states:

We found that scheme and processing fees (which we referred to as ‘scheme fees’ in the market review) paid by acquirers increased significantly over the period 2014 to 2018 as shown in Figure 1.5 We also found that a substantial proportion of these increases are not explained by changes in the volume, value or mix of transactions.[70]

The PSR has decided emphatically to focus narrowly on how Mastercard and Visa set scheme and processing fees:

We will assess the factors that may influence and constrain how Mastercard and Visa set scheme and processing fees, and the impact of this. Such factors may include:

  • The extent of any barriers to entry or network effects involved in setting up and running card payment systems, which alone or in combination may mean that Mastercard and Visa face limited constraints when it comes to setting scheme and processing fees.

  • Whether Mastercard and Visa have a ‘must take’ status for merchants, which may mean that Mastercard and Visa face limited constraints from the ability of merchants (and their acquirers) to exercise choice about their acceptance when setting acquirer scheme and processing fees.[71]

Meanwhile, the PSR has already ruled out any consideration of the wider payments ecosystem, noting:

A number of comments in the consultation asked us to consider extending the market review to charges levied by other participants in the payments ecosystem (other card schemes, and other payment methods, including digital wallets). We agree that constraints from other participants and other payment methods could play an important role in Mastercard’s and Visa’s decisions about card scheme and processing fees. The scope of the market review we proposed in our draft ToR, however, would assess competitive constraints that may arise from other participants than Visa and Mastercard, to the extent this applies. We, therefore, do not think that it is necessary to extend the scope of the market review; and so, our market review will focus on card scheme and processing fees.[72]

This is troubling because, as discussed above, the payment systems in the UK and globally have evolved over many decades in such a way as to balance the two sides of the market: merchants on one side and consumers on the other. The fees charged by payment systems reflect this balance, not only within the card-payments ecosystem but also within the wider payments ecosystem of which card payments are only a relatively small part—about 11% in the UK.[73] Moreover, the scheme fees that appear to be a specific focus of the market review are only a small part of the total fees paid during a transaction. Visa offers the following example: when a consumer purchases a jumper for £30 at a small retailer using a Visa card, the MSC would be around £0.63, of which the scheme fee would be about £0.01.[74] So, the question is: why is the PSR focusing on a fee that makes up only 1.6% of the transaction fee and only 0.03% of the total transaction amount?

By seeking to investigate only a subset of card fees and not all the fees—which would necessitate also considering the effects of any adjustments to such fees on related offerings (such as rewards and cobranded cards, insurance, security upgrades, and new payment modes), let alone the wider payments ecosystem)—the PSR precludes a proper analysis of whether the market is operating efficiently.

In sum, intentionally or otherwise, the statements made by the PSR with respect to the terms of reference (ToR) for both market reviews look very much like the regulator has already decided its conclusions and is now looking for evidence to support its case, while expressly avoiding evidence that might point to other conclusions. They are classic examples of asking the wrong question and therefore getting the wrong answer.

V.      Conclusions

Payment systems have developed through a process of dynamic competition that has led to the emergence of extraordinarily complex and finely balanced ecosystems featuring an increasingly wide array of innovative technologies, incentives, and business models. As such, it is a little odd that the PSR should have chosen to undertake several discrete and very narrow reviews, rather than a more comprehensive review.

If the PSR were to undertake a more comprehensive review of payments, which would be more consistent with its remit under the FSBR, it might extend that to the wider payments ecosystem, of which card payments are only a relatively small part—approximately 11% in the UK, if larger payments made over CHAPS are excluded.

Despite stating—in the final ToR for the market review of card schemes and processing fees—that it does not intend to extend the market review, it left a window open by stating: “We expect our thinking to develop over the course of the market review, including the possibility that further issues or areas of analysis are added (if they relate to potential harm to competition, innovation or service users) or some issues are dropped.”[75] One can only hope that such thinking extends to a fuller examination of the payments ecosystem. If the PSR were to adopt such an approach, it might also drop the even more absurdly narrow market review of UK-EEA consumer cross-border interchange fees, a fuller (proper) review of which would entail looking not only at payments in the UK, but also internationally.


[1] Market Review of UK-EEA Consumer Cross-Border Interchange Fees, Payment System Regulator (Jun. 21, 2022), https://www.psr.org.uk/publications/market-reviews/mr22-2-1-market-review-of-uk-eea-consumer-cross-border-interchange-fees.

[2] Market Review of Card Scheme and Processing Fees, Payment System Regulator (Jun. 21, 2022), https://www.psr.org.uk/publications/market-reviews/mr22-1-1-market-review-of-card-scheme-and-processing-fees.

[3] Id.

[4] Todd J. Zywicki, The Economics of Credit Cards, 3 Chap. L. Rev. 79, 7 (2000), available at https://digitalcommons.chapman.edu/chapman-law-review/vol3/iss1/6.

[5] Snapshot of Payments in the UK Over Time, Payment Systems Regulator (Jan. 2, 2022), available at https://www.psr.org.uk/media/20ob5wee/payments-over-time.pdf.


[6] William F. Baxter, Bank Interchange of Transactional Paper: Legal and Economic Perspectives, 26 J. L. & Econ. 541 (1983); Jean-Charles Rochet & Jean Tirole, Two-Sided Markets: A Progress Report, 37 Rand J. Econ. 645 (2006); see also, Todd J. Zywicki, The Economics of Payment Card Interchange Fees and the Limits of Regulation, International Center for Law & Economics, ICLE Financial Regulatory Program White Paper Series (Jun. 2, 2010), available at http://laweconcenter.org/images/articles/zywicki_interchange.pdf.

[7] Bruno Jullien, Alessandro Pavan, & Marc Rysman, Two-Sided Markets, Pricing, and Network Effects, 4 Handbook of Indus. Org. 485-592 (2021).

[8] Thomas Eisenmann, Geoffrey Parker, & Marshall W. Van Alstyne, Strategies for Two-Sided Markets, Harv. Bus. Rev. (Oct. 2006), https://hbr.org/2006/10/strategies-for-two-sided-markets.

[9] David L. Stearns, Think of it as Money: A History of the VISA Payment System, 1970–1984, PhD Thesis, University of Edinburgh, at 42–43; Timothy Wolters, Carry Your Credit in Your Pocket: The Early History of the Credit Card at Bank of America and Chase Manhattan, 1 Enterprise & Society 315, (2000).

[10] In some cases, the interchange fee is established bilaterally by agreement between issuers and acquirers. The default interchange fee applies when such agreements are not in place.

[11] See, e.g., UK Payment Processing Companies & Merchant Account Providers, MerchantSavvy, https://www.merchantsavvy.co.uk/payment-processors (last visited Feb. 22, 2023).

[12] PSR, supra note 1, at 13.

[13] Zywicki, supra note 6.

[14] For example, 10 EU members had a domestic card scheme in 2018: Card Payments in Europe- Current Landscape and Future Prospects, European Central Bank (Apr. 2019), https://www.ecb.europa.eu/paym/intro/mip-online/2019/html/1904_card_payments_europe.en.html.

[15] PSR, supra note 2, at 7.

[16] Payment and Settlement Statistics, Bank of England (Feb. 16, 2023), https://www.bankofengland.co.uk/payment-and-settlement/payment-and-settlement-statistics.

[17] BACS Monthly Volumes and Values 1990-2022, Pay.uk (2023), https://newseventsinsights.wearepay.uk/media/iyral1oo/historical-monthly-payment-statistics-1990-to-dec-2022.xls.

[18] Card Spending, UK Finance (Feb. 16, 2023), https://www.ukfinance.org.uk/data-and-research/data/card-spending.

[19] Emily Sherman & Holly Johnson, Understanding Third-Party American Express Cards, credicards.com (Mar. 30, 2022), https://www.creditcards.com/card-advice/american-express-third-party-cards.

[20] Diners Club History, Diners Club International, https://www.dinersclub.com/about-us/history (last visited Feb. 22, 2023).

[21] Who We Are, American Express, https://about.americanexpress.com/our-company/who-we-are/who-we-are/default.aspx (last visited Feb. 22, 2023).

[22] Stearns, supra note 9.

[23] Id.

[24] Id.

[25] Dave Ahern, The Amazing Story of Mastercard: History and Making Money, eB (Nov. 10, 2021), https://einvestingforbeginners.com/the-history-of-mastercard-daah/#:~:text=of%20America%2C%20ironically.-,How%20Did%20Mastercard%20Start%3F,became%20known%20globally%20as%20Visa.

[26] Brand History, Mastercard, https://brand.mastercard.com/brandcenter/more-about-our-brands/brand-history.html (last visited Feb. 22, 2023).

[27] 1963: American Express Comes to Britain, BBC, http://news.bbc.co.uk/onthisday/hi/dates/stories/september/10/newsid_3031000/3031968.stm (last visited Feb. 22, 2023).

[28] Id.

[29] Id.

[30] Stearns, supra note 9, at 120.

[31] BBC, supra note 27.

[32] Stearns, supra note 9, at 120.

[33] Id. at 131.

[34] Id. at 180.

[35] Eurocard (Credit Card), Wikipedia, https://en.wikipedia.org/wiki/Eurocard_(credit_card) (last visited Feb. 22, 2023).

[36] History 1966-72, Access, https://www.accesscreditcard.info/history66-72.aspx (last visited Feb. 22, 2023).

[37] History 1973-77, Access, https://www.accesscreditcard.info/history73-77.aspx (last visited Feb. 22, 2023).

[38] Paul Doocey, MasterCard and Europay Merge to Form a Global Payments Company, BankTech (Jul. 16, 2002), https://www.banktech.com/payments/mastercard-and-europay-merge-to-form-a-global-payments-company/d/d-id/1288945.html.

[39] Sean Brierley, Mastercard and UK Banks Strike 40m Access Deal, MarketingWeek (Apr. 19, 1996), https://www.marketingweek.com/mastercard-and-uk-banks-strike-40m-access-deal.

[40] EMV 3-D Secure, EMVCo, https://www.emvco.com/emv-technologies/3-d-secure (last visited Feb. 22, 2023).

[41] Raynor de Best, Total Number of In-Store Debit or Credit Card Payments that Are Contactless, or Done with NFC, in the United Kingdom (UK) from January 2015 to October 2021, Statista (Jan. 11, 2023), https://www.statista.com/statistics/488054/number-of-contactless-cards-transactions-united-kingdom.

[42] David Bounie & Youssouf Camara, Card-Sales Response to Merchant Contactless Payment Acceptance, 119 J. of Banking & Fin. 105938 (Oct. 2020), available at https://www.sciencedirect.com/science/article/abs/pii/S0378426620302004; Emma Marie Fleck & Michael E. Ozlanski, Cash: Never Leave Home with It? 17 The CASE J. 182–201 (2021), available at https://www.emerald.com/insight/content/doi/10.1108/TCJ-06-2019-0055/full/html.

[43] Adrian Buckle, The Impact of Covid-19 on UK Card Payments In 2020, UK Finance (Jun. 16, 2021), https://www.ukfinance.org.uk/news-and-insight/blogs/impact-covid-19-uk-card-payments-2020.

[44] UK’s First Major Rollout of CEMV Outside of London Commences in Oxfordshire, VIX Technology (Nov. 14, 2016), https://vixtechnology.com/press-release/uks-first-major-rollout-of-cemv-outside-of-london-commences-in-oxfordshire; Dan Balaban, UK Transit Agency Plans London-Style Multimodal Contactless System with Fare Capping, Mobility Payments (Sep. 12, 2022), https://www.mobility-payments.com/2022/09/12/uk-agency-plans-london-style-multimodal-contactless-system-with-fare-capping.

[45] Stearns, supra note 9.

[46] Protection You Need, Peace of Mind You Deserve, PayPal, https://www.paypal.com/us/webapps/mpp/paypal-safety-and-security (last visited Feb. 22, 2023).

[47] Add Cards and Banks, PayPal, https://www.paypal.com/us/digital-wallet/ways-to-pay/add-payment-method (last visited Feb. 22, 2023).

[48] Buy Now, Pay Later with PayPal, PayPal, https://www.paypal.com/us/digital-wallet/ways-to-pay/buy-now-pay-later (last visited Feb. 22, 2023).

[49] Erin Gregory, How Does Buy Now Pay Later (BNPL) Work for Businesses?, Techradar (Mar. 4, 2022), https://www.techradar.com/features/how-does-buy-now-pay-later-bnpl-work-for-businesses; Jarosław Ściślak, Top 10 Buy Now Pay Later Companies to Watch in 2022, Code & Pepper (May 8, 2022), https://codeandpepper.com/buy-now-pay-later-2022.

[50] Square, Inc. Announces Plans to Acquire Afterpay, Strengthening and Enabling Further Integration Between Its Seller and Cash App Ecosystems, Square (Aug. 1, 2021), https://squareup.com/us/en/press/square-announces-plans-to-acquire-afterpay; Bring in More Business with Buy Now, Pay Later, Square, https://squareup.com/us/en/buy-now-pay-later (last visited Feb. 22, 2023).

[51] John Stewart, As Consumers Embrace BNPL, Square Brings It to the U.K. Across All Platforms, Digital Transactions (Aug. 23, 2022), https://www.digitaltransactions.net/as-consumers-embrace-bnpl-square-brings-it-to-the-u-k-across-all-platforms.

[52] Buy Now, Pay Later, Stripe, https://stripe.com/docs/payments/buy-now-pay-later (last visited Feb. 22, 2023).

[53] Id.

[54] Bring in More Business with Buy Now, Pay Later, Square, https://squareup.com/us/en/buy-now-pay-later (last visited Feb. 22, 2023).

[55] Id.

[56] Free Your Cash Flow with Flexipay, Funding Circle, https://www.fundingcircle.com/uk/payments/flexipay (last visited Feb. 22, 2023).

[57] £1 Million Faster Payments Now Possible, Pay.UK (Feb. 10, 2022), https://newseventsinsights.wearepay.uk/media-centre/press-releases/1-million-faster-payments-now-possible.

[58] Julian Morris, Is Pix Really the End of Credit Cards?, Truth on the Market (Sep. 28, 2022), https://truthonthemarket.com/2022/09/28/is-pix-really-the-end-of-credit-cards.

[59] PSR Finalizes Plans for Wider Implementation of Fraud Prevention Tool, Confirmation of Payee, Payment Systems Regulator, https://www.psr.org.uk/news-and-updates/latest-news/news/psr-finalises-plans-for-the-wider-implementation-of-fraud-prevention-tool-confirmation-of-payee/#:~:text=account%20to%20another.-,Confirmation%20of%20Payee,details%20provided%20by%20a%20payer (last visited Feb. 22, 2023).

[60] PSR Sets Out Proposals to Give Greater Protection Against APP Scams, Payment Systems Regulator (Nov. 25, 2022), https://www.psr.org.uk/news-and-updates/latest-news/news/psr-sets-out-proposals-to-give-greater-protection-against-app-scams.

[61] MasterCard Biometric Card Driving Cardholder Security and Convenience, MasterCard, https://www.mastercard.us/en-us/business/overview/safety-and-security/authentication-services/biometrics/biometrics-card.html (last visited Feb. 22, 2023); Fingerprint Authentication Moves from Phones to Payment, Visa, https://usa.visa.com/visa-everywhere/security/biometric-payment-card.html (last visited Feb. 22, 2023).

[62] Kimberly Palmer & Melissa Lambarena, Buy Now, Pay Later Already Comes Standard on Many Credit Cards, Nerdwallet (Dec. 9, 2022), https://www.nerdwallet.com/article/credit-cards/buy-now-pay-later-is-already-standard-on-some-credit-cards.

[63] Supra Section III.

[64] Financial Services (Banking Reform) Act 2013, c. 33, §49 (UK).

[65] Id.

[66] The Guardian, Cannes Lion Award-Winning “Three Little Pigs Advert”, YouTube (Feb. 29, 2012), https://www.youtube.com/watch?v=_SsccRkLLzU.

[67] PSR, supra note 1, at 7.

[68] The Interchange Fee (Amendment) (EU Exit) Regulations 2019, SI 2019/284, https://www.legislation.gov.uk/uksi/2019/284/contents.

[69] Board of Governors of the Federal Reserve System, Changes in U.S. Payments Fraud from 2012 to 2016, Federal Reserve (Oct. 2018), https://www.federalreserve.gov/publications/2018-payment-systems-fraud.htm.

[70] PSR, supra note 2, at 5.

[71] Id. at 10.

[72] Id. at 7.

[73] See Section III above.

[74] Paying with Visa: How Retailers and Consumers Benefit, Visa (Oct. 22, 2020), https://www.visa.co.uk/visa-everywhere/blog/bdp/2020/10/20/what-happens-when-1603211979840.html.

[75] PSR, supra note 1, at 11.

ICLE Issue Brief

Consumer Protection in the 21st Century

Executive Summary How do we know whether an apple we buy is safe to eat; whether the pound of butter on sale is really a . . .

Executive Summary

How do we know whether an apple we buy is safe to eat; whether the pound of butter on sale is really a pound (or really butter); whether our cell phone will blow up in our hands or send all of our data to the government; or whether a taxi driver will overcharge us (or worse)? Concerns such as these have driven the creation of consumer-protection laws. But with the emergence of new ways of sharing information and rating suppliers, do we still need such laws?

This brief describes the origin, development, and implications of government-mandated consumer-protection laws and contrasts these with emergent, bottom-up solutions of various kinds, especially those made possible by the internet. Section I offers a brief history of consumer-protection legislation and its effects. Section II discusses some traditional alternatives to such top-down controls, including contract law and reputation. Section III explains the growth of the regulatory state. Section IV describes some modern alternatives to regulation that have been made possible by the internet. Section V offers examples of how the regulatory state has reacted to these new alternatives. Section VI addresses some of the major criticisms of online information sharing. Finally, Section VII concludes.

I.              A Brief History of Consumer-Protection Legislation

Consumer-protection legislation is nothing new. The Babylonian code of Hammurabi, written in about 1760 BC, set prices for various goods and services, ranging from a medical operation to a ship’s rent.[1] It also set “prices” for various harms, including theft and injuries (for example, rule number 196 states: “If a man puts out the eye of another man, his eye shall be put out.”). Roman emperors introduced various regulations to standardize weights and measures,[2] which were replicated in various guises by medieval monarchs and local governments. Some of these laws established very specific requirements. Henry III’s Assisa panis et cervisia (“Assize of bread and ale”), promulgated throughout England in 1256, regulated the sale price of bread and ale of varying quantities.[3] Meanwhile, in Bavaria, the Rienheitsgebot of 1516 specified that only hops, barley, and water may be used to produce beer.

A.      Perverse Effects of Early Consumer-Protection Regulation

While notionally justified on the grounds that they protected consumers, these laws often had the opposite effect: protecting incumbents against competition, driving up prices, and impeding innovation.

Under the Assisa, the prices of standard loaves of “wastrel” bread were fixed at a farthing (a quarter penny) and half-penny, but local authorities would vary the size of the loaf based on the prevailing cost of inputs, particularly the price of wheat.[4] Thus, when wheat prices rose, the mandated size would fall, and vice versa. Most towns had only a small number of bakers, however, and they sometimes would conspire with local authorities to set quantities at levels that created supernormal profits, to the detriment of consumers.[5] But this was not ubiquitous; in some towns, the level was set infrequently, with the result that, when wheat prices peaked, the level would be too high and bakers would have no incentive to bake, leading to artificial shortages of bread.[6]

Until 1987, when the European Court of Justice ruled that it violated the principle of the free movement of goods,[7] the Reinheitsgebot had been amended only once in nearly 500 years.[8] Following the ECJ decision, imported beers not compliant with the Reinheitsgebot could be sold in Germany, but German producers are still largely bound by the law. In 1993, Germany amended the Reinheitsgebot, leading to the adoption of modern craft-beer techniques—but with few exceptions, those beers still cannot be called beer.[9] As a 2016 article notes, “until the arrival of craft beers, the most recent innovation in German brewing was the advent of the very successful Pilsner in the 19th century.”[10]

B.      Origins of the Regulatory State

During the 19th century, advances in science and industry dramatically improved the accuracy of measurement—leading to better, more reliable standards, as well as better means of detecting potentially harmful additives. At the same time, industrialization and urbanization resulted in a proliferation of mass-produced processed foods. Many of these contained “adulterants” of various kinds, which reduced the quality of the food and some of which were harmful.

Following a series of studies by Arthur Hill Hassall on instances of adulteration, published in The Lancet in the early 1850s,[11] Parliament launched a select committee on the issue in 1855. Between 1860 and 1875, Parliament passed a series of acts intended to address the problem of food adulteration,[12] culminating in the Sale of Food and Drugs Act of 1875. These acts established strict rules prohibiting the use of “injurious ingredients” in food and drugs, required local governments to appoint analysts to sample food and drugs for sale in their jurisdictions, and empowered those same governments to prosecute merchants for violating the act.[13]

The Safe Food and Drug Act was the first comprehensive legislation of its kind and arguably was a foundational moment in the establishment of the regulatory state. Other legislatures followed suit with similar laws, including the U.S. Pure Food and Drug Act of 1906.[14] And in Britain and elsewhere, the model of establishing strict rules and empowering agencies to enforce them became pervasive.

C.      Regulation Gets a Red Flag

While various consumer-protection laws typically have been enacted on the premise that they would protect consumers, like the Assisa and the Reinheitsgebot, they have often had the unintended effect of limiting supply and undermining incentives to innovate, harming the very consumers they are intended to benefit. One of the most blatant examples of this was Britain’s Locomotives Act 1865—better known as the “Red Flag Act.” The law limited the speed of self-propelled vehicles on public roads to 4 mph in the countryside and 2 mph in towns, and required that a person walk in front of each vehicle carrying a red flag.[15] Far from protecting consumers, the act had the effect of denying consumers access to a desirable technology. In the 1860s, the vehicles on the roads were heavy, steam-powered contraptions. By disincentivizing innovation, the law likely held up the development in the United Kingdom of better, faster, lighter, and less expensive automobiles that used alternative means of propulsion until 1896, when the speed limit was raised to 12 mph and the red-flag requirement rescinded.[16]

II.            Contract, Reputation, and Brands as Consumer Protection

Fortunately, these public laws were not the only sources of consumer protection. Indeed, actual protection mainly came from two other sources: private law and public reputation.

A key element of consumer protection has been the existence of warranties, enforceable against a manufacturer and/or vendor, that a product will do what it says it will do. Since Babylonian times, consumers have been protected by laws that impose liability on sellers for fraud.[17] These early laws were likely quite narrow in scope, but they were broadened over time.

First, there was a shift toward a more formal concept of contract formation being by agreement between private parties, rather than being primarily subject to rules set in code. Thus, in Roman Law, parties to certain kinds of contracts could include express warranties if the contract was made face-to-face.[18] During the early phases of the Industrial Revolution, English law adopted a somewhat broader notion of consensus ad idem (“agreement [by both parties] to the [same] thing”—often abbreviated to “a meeting of minds”) as the basis for private contract,[19] along with the principle of caveat emptor (“buyer beware”).[20] Meanwhile, courts in England and other common-law jurisdictions, including the United States, gradually imputed terms into contracts pertaining to the quality of products sold, such as requirements that the products be “of merchantable quality” and “fit for purpose.”[21] Companies also developed express warranties that went beyond those imputed by judges.[22]

This combination of express and implied warranties created strong incentives on the part of producers to ensure that the goods and services they sell conform with buyers’ expectations. Meanwhile, implied warranties notwithstanding, the general principle of caveat emptor creates strong incentives for consumers to ensure that a product is appropriate for the intended use and to obtain express warranties to that effect. As George Winder explains:

In this Australian case some young ex-service men had rented a threshing machine and undertaken contracts to thresh wheat. The machine had not worked satisfactorily and had finally broken down. Whereupon, the young men sued the owner for the loss they had sustained by reason of the defective machine. There was much sympathy for the young men, and most people in the little town thought they were bound to win their case. They told the Magistrate how in good faith they had rented this machine to do a job of threshing for which it had been built, but it had let them down. To their surprise, the Magistrate, although most sympathetic, pronounced the fatal words “Caveat emptor,” of which they had never heard, and gave the case to the defendant.

The good people who had listened to the case were inclined to agree that “the law was an ass” and to hope that they might never be subject to court action.

Eventually, it appeared that the law was right. The thresher had been used with a very powerful engine entirely unsuited for the job and this had caused the breakdown. This fact had not been known to the Magistrate but, by accepting the principle, “Caveat emptor,” he had reached the right verdict. The young men should have known that the thresher would not work with such an engine and should not have hired it. Having done so, they were not entitled to claim damages against the owner when the machine failed them.[23]

In addition to the obligations associated with express and implied warranties, companies have strong incentives to avoid harming their consumers to ensure repeat business and avoid reputational damage. A notable instance of this is Crosse and Blackwell, a prominent U.K. food processor that was identified in one of Hassell’s Lancet articles as purveying preserved fruits and vegetables adulterated with copper sulphate.[24] Thomas Blackwell declared during the parliamentary inquiry that, following the Lancet report, the company immediately eliminated adulterants from its foods.[25] The company also put in place a system of farm-to-factory quality control, sourcing ingredients directly from farmers.[26] By the mid-1860s, Crosse and Blackwell had become one of the largest food companies in the world and continues to be a significant brand today, suggesting that the firm’s actions had the desired reputational effect.

This example highlights the importance of brands as signifiers of quality to consumers. When purchasing products and services, consumers now typically face a choice between several different brands, each of which represents different bundles of characteristics. The existence of such competition means producers of goods and services have incentives to identify and meet the felt needs of different consumers, using their brand(s) to signal to specific groups of consumers. It also provides incentives to innovate so that those felt needs can be met more cost-effectively, thereby increasing the firm’s market share.

III.          Explaining the Growth of the Regulatory State

Despite firms’ incentives to ensure their products meet high standards to avoid liability and reputational damage, governments continued to expand the regulatory state throughout the 20th century. In addition to a plethora of product regulations, entire industries—from mining to finance—have been subject to regulation, and systems of occupational licensing were established for professions ranging from medicine and law to hairdressing.

Economists have long recognized the problems inherent in such top-down government controls. In a seminal 1959 study, Ronald Coase noted that the Federal Communications Commission was not the most efficient or effective allocator of radio spectrum.[27] Coase argued that it would be better to establish property rights in spectrum and allow market transactions to determine allocations. Yet now, more than 60 years later, although the FCC has improved the efficiency of spectrum allocation by auctioning licenses—arguably heeding Coase’s analysis, at least in part—it continues to act as the ultimate controller.[28]

A key reason for the persistence of such top-down regulations, despite ample evidence of their folly, is the power of interest groups that benefit directly or indirectly from them. In “The Theory of Economic Regulation,” George Stigler argued that, even when regulations are intended to promote the public interest, regulators tend to be captured by those being regulated. Regulation thereby serves as a barrier to entry, benefiting regulated firms and individuals but at great cost to society.[29] This insight is, however, hardly new. Back in 1776, Adam Smith noted that guilds were apt to promote their interests through mandates that limited competition.[30]

Aside from often benefiting the companies and individuals subject to them, regulations may also benefit more ideological interest groups, leading to a form of tacit collusion between regulated firms and those interest groups. Bruce Yandle explained this phenomenon in his essay on “bootleggers and Baptists,” noting that Baptist ministers call for prohibitions on the sale of alcohol on Sundays at least in part because they want people to go to their churches, so they will fill the collection plates; meanwhile, bootleggers benefit from restrictions on the sale of alcohol on Sunday because they get to be the only suppliers of alcohol on those days.[31]

Such tacit collusion is pervasive. For example, during the 1990s, environmental and consumer-advocacy groups in Europe raised concerns over—and called for bans on—genetically modified crops (GMOs), in spite of the many benefits those technologies bring to consumers and the environment (and a lack of evidence of harm).[32] Meanwhile, producers of so-called “organic” food benefited from the scare stories by emphasizing that their foods did not contain GMOs.[33]

IV.          Alternatives to the Regulatory State

While regulatory capture may explain the persistence of many top-down regulations in the face of overwhelming evidence of better alternatives, it also suggests that there may be a way out. Over the past two decades, innovative ways to enable consumers to make better-informed purchases have emerged that are generally superior to existing top-down regulations.

A.      Online Information Sharing

Before the advent of the internet, consumers interested in comparing the quality of various goods and services generally relied on information provided by expert reviewers working for specialist magazines, such as Good Housekeeping (which even established its own institute dedicated to evaluating products and offering product warranties) or nonprofit organizations such as Consumer Reports.[34]

Today, websites and apps offer various means for consumers to access information pertaining to the quality of goods and services on offer. Thumbtack—a marketplace for services ranging from appliance installation to wedding planners—undertakes background checks on all its providers and enables users to rate the quality of services.[35] Ebay enables buyers to rate sellers. Amazon enables buyers to rate both products and vendors. To varying degrees, these sites also enable buyers to provide more detailed feedback on the products and services they purchase, allowing consumers to better match their preferences with those whose tastes and views are more relevant to them.

There are many websites that enable either expert or user-shared evaluations of products and services, offer price comparisons, and enable users to purchase those goods, either directly or indirectly. These include TripAdvisor (mainly focused on accommodation and experiences); Yelp (various services); OpenTable (restaurants); Expedia and Booking.com (flights, cars, accommodation); and, of course, Google (practically everything).[36]

These online rating systems have proven so effective that a 2015 survey from the Pew Research Center found that 40% of U.S. adults said they always use them when making a purchase for the first time, while an additional 42% said they sometimes use them.[37] Among those aged 18-29, the proportions were higher: 54% said “always” and 43% “sometimes,” while only 3% said they never used such sites.

Social media (Facebook, Twitter, YouTube, Snapchat, Discord, LinkedIn, Instagram, TikTok, Reddit, Pinterest, etc.) also increasingly offers a means for both companies and consumers to share information about products. Social media also facilitates far more effective feedback loops than was previously possible, with consumers evaluating products and sharing ideas about product improvements. Sometimes this information is helpful primarily to other consumers—e.g., at least one site is devoted to “hacking” Ikea products.[38] But in other cases, companies use the information to address criticisms and incorporate new ideas into products.

B.      Product Enhancement

In some cases, websites and forums have helped shape an entire industry’s product development cycle. A case in point is the crucial role that online forums played in the early days of e-cigarette technology.[39] The first e-cigarette—Ruyan, invented by Beijing-based pharmacist Hon Lik—was generally considered to be a poor substitute for combustible cigarettes. In response, users started “hacking” the product by independently developing bigger, rechargeable batteries and better liquids, among other enhancements, and shared information about these potential improvements with other users of online forums. Manufacturers then incorporated the innovations shared on these sites to develop better commercial products.

Some users even collaborated in developing standards, such as the types of thread that connected different parts of the e-cigarette, which were then adopted by manufacturers.[40] These interoperability standards resulted in a plethora of products and enabled users to choose their preferred combinations of parts.[41]

Since e-cigarettes are estimated to be considerably less harmful than combustible cigarettes, these product improvements have generated enormous benefits to those millions of smokers who had been unable or unwilling to quit before switching to e-cigarettes.[42] Meanwhile, the e-cigarette revolution emboldened cigarette manufacturers to develop less-harmful alternatives to their own products, something that a half-century of regulation had failed to achieve.

C.      Sharing Apps

Other internet-based technologies, such as sharing apps, have gone even further in usurping the role of regulation. Ridesharing apps  such as  Uber and Lyft offer riders and drivers a way to coordinate with one another, provide price transparency, and enable riders and drivers to rate one another. When a driver picks up a rider, both parties know with whom they are dealing: the driver knows where the rider is going (and is guided to the destination by a GPS-based mapping system) and the rider typically knows how much the trip will cost. Payment is taken through the app, providing protection for both driver and rider. If, for example, a driver takes an inappropriate route, there are systems to dispute excessive charges. In addition, drivers whose ratings fall below a specified level are kicked off the system.

But ridesharing-app companies do not rely exclusively on customer ratings. They also vet every new driver, undertaking background checks via services such as Checkr.[43] Ridesharing services thus provide consumers with the confidence that they will be taken safely from their pick-up point to their intended drop-off at an agreed price. Moreover, trip wait times and costs are generally lower for rideshare services than for taxis.[44] In addition, the popularity of ridesharing services has put pressure on taxi companies to improve the quality, and lower the cost, of their own services, thereby demonstrating that competition is a far more effective driver of quality than regulation.[45]

A 2020 Brookings Institution study estimated the value of Uber’s benefits to travelers. Despite slightly higher average fares, they found that Uber generates annual net benefits of approximately $1 billion in the Bay Area alone—and, by extension, many billions of dollars nationwide—through a combination of higher service quality, more transparent fares, personalized pricing and services, and expanded taxi service into new markets in response to competition from Uber.[46] Meanwhile, using data from the New York City metropolitan area, Caitlin Gorback found that, three years after the introduction of ridesharing services in previously less-accessible locations, net restaurant formation increased by between 6% and 11%, while overall additional amenity value to residents increased house prices by about 3%.[47]

Like ridesharing apps, short-term rental apps and websites such as Airbnb, VRBO, and Flipkey allow users to coordinate short-term stays in rooms or whole properties, make payment, and rate one another. A study recently published in the American Economic Review found that, in 2014, Airbnb significantly increased the supply of accommodation, especially in areas of high demand during peak periods.[48] The authors estimated that, in that single year, Airbnb generated more than $400 million in additional economic benefits to society.[49]

V.            The Regulatory State Pushes Back

Despite the superiority of these decentralized information-sharing mechanisms for allowing consumers to make better-informed decisions, the regulatory state has, in many cases, attempted to continue to “protect” consumers. It has often been supported in these both by various activists and academics and by other regulated businesses.

For example, in the United States, the U.S. Food and Drug Administration (FDA) has hit back at e-cigarettes in a massive way. In 2009, it blocked the importation of e-cigarettes, claiming that they were illegal drug-delivery devices.[50] Two e-cigarette manufacturers sued the FDA and had the ban overturned.[51] Unfortunately, the plaintiffs in the case argued that, while the FDA did not have authority to regulate e-cigarettes as drug-delivery devices under the Food, Drugs, and Cosmetics Act, it did have authority to regulate them as tobacco products under the Tobacco Control Act, and the judge agreed. This offered the FDA a justification to introduce regulations in 2016 “deeming” e-cigarettes to be tobacco products.[52] Since then, the agency has effectively decimated the industry.[53] Combustible cigarettes, which are plausibly at least 20 times more harmful than e-cigarettes, nonetheless remain widely available.

The restrictions imposed by the FDA, as well as regulators in many other jurisdictions, were sought by a classic “bootlegger-Baptist” coalition: the “bootleggers” are cigarette and pharmaceutical manufacturers, who benefit from continued sales of their products, while the “Baptists” are so-called public-health groups, who claim that cigarette smokers should “quit or die” and that new products will result in a new generation of nicotine addicts.[54] The predictable result has been to reduce the availability and increase the cost of e-cigarettes in markets subject to such restrictions, to the detriment of those who would otherwise use these products as an alternative to more harmful smoking.

Ridesharing services have, unsurprisingly, been subject to persistent challenges from the taxi industry, and governments in many jurisdictions have responded by forcing individuals who wish to offer ridesharing services to obtain taxi licenses. In some places, such services have been banned altogether.

Given the total net benefits of app-based systems, these bans are clearly harmful. Licensing requirements are likely unnecessary from a safety perspective, since both parties are arguably better protected by the app-based system, which requires user and supplier to share pertinent information in advance and creates a record of the identity of each party.[55] Meanwhile, by imposing costs on those who offer ridesharing services, licensing reduces supply and raises prices, generating net costs. These costs make it uneconomic for many potential suppliers to offer such services.

For example, the New York City Taxi and Limousine Commission requires all operators of ridesharing services to obtain a T&LC license and associated insurance, which comes at an annual cost of some $3,000.[56] For people who might otherwise engage in ridesharing only a few hours a week (for example, at peak times or during a commute), it may not be worth the cost and hassle to obtain such a license. Likewise, those who offer ridesharing services in other parts of the metropolitan area (such as in New Jersey or Connecticut, or even in nearby cities in New York State) may pick up passengers who wish to go to New York City, but without a T&LC license, will be unable to offer return rides. Such licenses unarguably reduce competition and harm consumer welfare – and ought to be challenged as violations of antitrust.

A.      When Governments Care About Consumer Welfare

Ironically, despite the de facto or de jure monopoly status they often enjoy, taxi services have sought to use antitrust law against ridesharing services—e.g., claiming that transportation-network companies circumvent employment and other regulations to gain unfair competitive advantage.[57] Fortunately, the courts have thus far generally found against such hubristic claims. For example, in 2016, taxi companies in Philadelphia sued Uber alleging that, by avoiding costly regulatory compliance, the company had engaged in anticompetitive behavior in violation of the Sherman Act. The trial judge dismissed the complaint and the 3rd U.S. Circuit Court of Appeals affirmed that dismissal, noting that the company’s entry into the market for on-demand rides actually promoted competition and consumer welfare.[58] The U.S. Supreme Court refused to hear an appeal, although that has not stopped other groups from making similar claims.[59]

When it comes to harm from products containing nicotine, U.K. agencies have generally been more mindful of consumer welfare than the FDA. While the FDA was trying to ban e-cigarettes in the early 2010s, then-Cabinet Secretary Jeremy Heywood supported e-cigarettes as a less harmful alternative to smoking and commissioned studies from the Behavioral Insights Team into ways to encourage smokers to switch.[60] Meanwhile, Public Health England (the then-research arm of the National Health Service) commissioned a series of reports into the nature, effectiveness, and health risks associated with e-cigarettes, which concluded that e-cigarettes were “at least 95% safer” than combustible cigarettes.[61] The U.K. government has continued to support e-cigarettes as a less-harmful alternative to combustible cigarettes.[62]

VI.     Addressing Criticisms of Online Information Sharing

While the examples above highlight the benefits that can come from sharing information using online platforms, it is important to acknowledge that “the internet” is hardly an inviolable source of impartial, objective information. There is much nonsense and disinformation available online. Indeed, misinformation about technologies such as GMOs,[63] vaccines,[64] e-cigarettes,[65] and even bread[66] are spread virally on websites and social media. Meanwhile, many product “reviews” are posted by companies or their agents seeking to promote their own products.[67]

But the existence of biased and inaccurate information no reason to dismiss crowdsourced information. [68] Rather, it suggests a need for systems that enable consumers to separate the wheat from the chaff. The operators of platforms are aware of these problems and are evolving mechanisms to address them, such as prioritizing reviews by verified purchasers, reviewers of multiple products, and other means.[69]

In many respects, despite their imperfections, the information and assurances that consumers obtain through these internet-based systems is far superior to the information and quality checks required by government-imposed regulations. A 2016 survey by the Pew Research Center found that 46% of respondents felt that consumer reviews on websites and apps made them feel confident about their purchases, compared with 26% for “government regulation”; meanwhile, 41% said such reviews make companies accountable to their customers, against 30% for government regulation; and 41% said consumer reviews helped ensure the safety of products and services, against 33% for government regulation.[70] A 2021 survey by YouGov found that 54% of respondents in the United States trusted crowdsourced online reviews, suggesting that trust in such reviews has increased since 2016.[71] Meanwhile, 57% found such reviews “somewhat useful” and a further 21% found them “very useful.”

VII.        Conclusions

Returning to the questions asked in the opening paragraph, it is by now perhaps clear that there are no definitive answers. But it is surely instructive that, when it comes to making purchases, a considerably greater proportion of consumers value the information and assurances provided by online services than value government regulation. Indeed, it is not unreasonable to conclude that these services are increasingly usurping the role of government regulations as validators of information.

But companies who have been protected from competition by regulation have, unsurprisingly, sought protection from the purveyors of goods and services that threaten their markets. Most obviously, taxi companies and medallion owners have lobbied fiercely to require ridesharing services to comply with taxi regulations—or ban them altogether. Likewise, hotel operators have sought to impose restrictions on the operation of home-sharing services. And cigarette manufacturers and pharmaceutical companies have likely benefitted from regulations that impose very onerous restrictions on the supply of e-cigarettes, hindering competition and harming consumer welfare.

These efforts by vested interests should be resisted. One way to do so would be for government agencies charged with promoting competition and the free movement of goods to use their powers to counter the actions of other governments to impose anti-competitive regulation—as the European Commission did when French brewers challenged the Reinheitsgebot.

Competition and consumer-protection authorities should recognize the benefits that new technologies can offer in promoting both competition and consumer welfare. Instead of regulating those products, as some demand, they should be liberated to innovate better ways to enable consumers to access information, goods, and services.

This is not to advocate for the elimination of all government-imposed consumer-protection regulation, but rather to advocate for scaling back such regulation so that it focuses narrowly on well-recognized harms that are not adequately addressed by private alternatives—including those provided through internet-based services—and to ensure that when regulations are imposed, the benefits of such regulation unambiguously outweigh the costs they impose on society.

[1] The Code of Hammurabi Translated by L. W. King, Yale Law School (no date),  https://avalon.law.yale.edu/ancient/hamframe.asp.

[2] Philip Smither, Roman Weights and Measures, University of Kent (Dec. 13, 2017), https://blogs.kent.ac.uk/lucius-romans/2017/12/13/roman-weights-and-measures.

[3] James Davis, Baking for the Common Good: A Reassessment of the Assize of Bread in Medieval England, 3 Econ. Hist. Rev. 465 (August 2004). While the assize promulgated in 1256 (51 Henry III) is the best-known and longest lasting, it built upon earlier similar laws, including those proclaimed by Henry II (1154–89), Richard I (1189–99), and John (1199—1216) in England, and others imposed across Europe from 794 AD onwards.

[4] Id.

[5] Id. at 472.

[6] Id.

[7] Commission of the European Communities v Federal Republic of Germany, European Court of Justice (Mar. 12, 1987), Case 178/84, https://eur-lex.europa.eu/legal-content/EN/TXT/?uri=CELEX%3A61984CJ0178.

[8] The amendment permitted the use of yeast, the presence of which had been unknown in 1516 (though other exceptions were made, including the grant, to one producer, to use wheat). Stephen R. Holle & Manfred Schaumberger, The Reinheitsgebot – One Country’s Interpretation of Quality Beer, 7 Brewing Techniques 1 (1999), https://www.morebeer.com/articles/Reinheitsgebot_Brewing_Germany_Purity_Law_Bavaria_1516_Malt_Barley_Water_Hops_Yeast.

[9] Kate Connolly, Medieval Beer Purity Law Has Germany’s Craft Brewers Over a Barrel, The Guardian (Apr. 18, 2016), https://www.theguardian.com/world/2016/apr/18/germany-reinheitsgebot-beer-purity-law-klosterbrauerei-neuzelle.

[10] Esme Nicholson, Germany’s Beer Purity Law Is 500 Years Old. Is It Past Its Sell-By Date?, National Public Radio (Apr. 29, 2016), https://www.npr.org/sections/thesalt/2016/04/29/475138367/germanys-beer-purity-law-is-500-years-old-is-it-past-its-sell-by-date.

[11] Arthur Hill Hassall, Food and Its Adulterations, The Lancet (1851-1854).

[12] Neil Coley, The Fight Against Food Adulteration, Education in Chemistry (Feb. 28, 2005), https://eic.rsc.org/feature/the-fight-against-food-adulteration/2020253.article.

[13] Sale of Food and Drugs Act 1875, c. 63, available at http://www.legislation.gov.uk/ukpga/1875/63/enacted.

[14] Pub. L. No. 59-384, available at https://govtrackus.s3.amazonaws.com/legislink/pdf/stat/34/STATUTE-34-Pg768.pdf.

[15] Locomotives Act 1865, UK Public General Acts 1865 c. 83

[16] Locomotives on Highways Act 1896, UK Public General Acts 1896 c. 36.

[17] Arvinder S. Loomba, A Chronicle of Global Evolution of Product Warranty, 55 J Jpn lnd Manage Assoc 311 (January 2005).

[18] Alan Watson, The Evolution of Law: The Roman System of Contracts, 2 LHR 1 (1984), at 9.

[19] Paradine v Jane (1647) Aleyn 26.

[20] Chandelor v Lopus (1603) 79 ER 3.

[21] These concepts were developed in case law and subsequently adopted as part of the Sale of Goods Act in the United Kingdom (Sale of Goods Act 1979, UK Public General Acts1979 c. 54 SCHEDULE 1, Section 14) and the Uniform Commercial Code in the United States (Uniform Commercial Code § 2-315. Implied Warranty: Fitness for Particular Purpose).

[22] Loomba, supra note 18.

[23] George Winder, Caveat Emptor, Foundation for Economic Education (Jan, 1, 1968), https://fee.org/articles/caveat-emptor.

[24] Hassall supra note 12, at 480.

[25] Peter Atkins, Vinegar and Sugar: The Early History of Factory-made Jams, Pickles and Sauces in Britain, in D.J. Oddy (Ed.) The Food Industries of Europe in the Nineteenth and Twentieth Centuries, Farnham, UK: Ashgate (2013). http://www.academia.edu/3550965/Vinegar_and_sugar_the_early_history_of_factory-made_jams_pickles_and_sauces_in_Britain.

[26] Id.

[27] Ronald H. Coase, The Federal Communications Commission, 2 J Law Econ 1 (1959); see also Thomas W. Hazlett, David Porter, & Vernon Smith, Radio Spectrum and the Disruptive Clarity of Ronald Coase, for the University of Chicago School of Law conference Markets, Firms, and Property Rights: A Celebration of the Research of Ronald Coase (Dec. 4-5, 2009), https://www.chapman.edu/esi/wp/porter-smith-hazlett-radiospectrum.pdf.

[28] See, e.g., Stepping In: The FCC ’s Authority to Preempt State Laws Under the Communications Act, Congressional Research Service (Sep. 20, 2021), https://crsreports.congress.gov/product/pdf/R/R46736.

[29] George J. Stigler, The Theory of Economic Regulation, 2 Bell J. Econ. & Mgmt. Sci 3 (1971).

[30] Adam Smith, The Wealth of Nations (1776), Book I, Chapter X. “People of the same trade seldom meet together, even for merriment and diversion, but the conversation ends in a conspiracy against the public, or in some contrivance to raise prices. …  But though the law cannot hinder people of the same trade from sometimes assembling together, it ought to do nothing to facilitate such assemblies; much less to render them necessary. . . . A regulation which enables those of the same trade to tax themselves in order to provide for their poor, their sick, their widows, and orphans, by giving them a common interest to manage, renders such assemblies necessary. An incorporation not only renders them necessary, but makes the act of the majority binding upon the whole.”

[31] Bruce Yandle, Bootleggers and Baptists-The Education of a Regulatory Economist, 7 Regulation 12 (June 1983), https://object.cato.org/sites/cato.org/files/serials/files/regulation/1983/5/v7n3-3.pdf.

[32] GMOs can enable increased productivity using fewer agrochemicals, increasing output and lowering the cost of foods and reducing the amount of land required to grow crops. Meanwhile, there is no evidence that consumption of such crops poses harms of a different kind or scale to those presented by conventionally bred crops. For a review of the evidence, see National Academy of Sciences, Genetically Engineered Crops: Experiences and Prospects, National Academies Press (2016), available at https://www.nap.edu/catalog/23395/genetically-engineered-crops-experiences-and-prospects.

[33] Robert Paarlberg, A Dubious Success: The NGO Campaign Against GMOs, 5 GM Crops Food 223 (2014), https://www.ncbi.nlm.nih.gov/pmc/articles/PMC5033189.

[34] See, e.g., Good Housekeeping Institute, https://www.goodhousekeeping.com/institute; Consumer Reports, https://www.consumerreports.org.

[35] Smart Hiring on Thumbtack, Thumbtack, https://www.thumbtack.com/safety.

[36] This list is very far from exhaustive. For a range of other popular sites, see Nicole Martins Ferreira, You Should Try These Website and Apps to Compare Prices, Oberlo (Oct. 5, 2020), https://www.oberlo.com/blog/25-best-price-comparison-websites.

[37] Aaron Smith & Monica Anderson, Online Reviews, Pew Research Center (Dec. 19, 2016), http://www.pewinternet.org/2016/12/19/online-reviews.

[38] See, e.g., Ikea Hackers, https://ikeahackers.net.

[39] Forums included, e.g., ECF, https://www.e-cigarette-forum.com.

[40] Personal communication with Luc van Daele, one of the vapers who encouraged the use of these thread standards.

[41] See Julian Morris & Amir Ullah Khan, The Vapour Revolution: How Bottom-Up Innovation Is Saving Lives, Reason Foundation (August 2016), available at https://reason.org/wp-content/uploads/files/vapour_revolution_working_paper.pdf.

[42] Nicotine Vaping in England: 2022 Evidence Update Summary, UK Office for Health Improvement & Disparities (Sep. 29, 2022), https://www.gov.uk/government/publications/nicotine-vaping-in-england-2022-evidence-update/nicotine-vaping-in-england-2022-evidence-update-summary.

[43] Background Checks for the Gig Economy, Checkr, https://checkr.com/use-cases/gig-marketplace.

[44] See Lisa Rayle, Danielle Dai, Nelson Chan, Robert Cervero, & Susan Shaheen, Just a Better Taxi? A Survey-Based Comparison of Taxis, Transit, and Ridesourcing Services in San Francisco, 45 Transp Policy 168 (January 2016), finding that wait times were significantly lower for rideshare services; See Ed Perkins, How Much an Airport Uber, Taxi, or Rental Car Costs Around the Globe, Smarter Travel (Dec. 21, 2017), https://www.smartertravel.com/airport-uber-versus-taxi, offering a comparison of the costs of using Uber versus taxis at various airports and finding that Uber was significantly less expensive in most locations.

[45] Scott Wallsten, The Competitive Effects of the Sharing Economy: How Is Uber Changing Taxis?, Technology Policy Institute (June 2015), https://techpolicyinstitute.org/wp-content/uploads/2017/06/Wallsten_The-Competitive-Effects-of-Uber.pdf.

[46] Hyeonjun Hwang, Jia Yan & Clifford Winston, Measuring the Benefits of Ridesharing Services to Urban Travelers: The Case of The San Francisco Bay Area, Brookings Institution (Oct. 19, 2020, https://www.brookings.edu/research/measuring-the-benefits-of-ridesharing-services-to-urban-travelers.

[47] Caitlin Gorback, Your Uber has Arrived: Ridesharing and the Redistribution of Economic Activity, unpublished PhD thesis (April 2022), available at https://www.dropbox.com/s/12j62po4y3lwzj9/Gorback_draft_apr2021.pdf?dl=0.

[48] Chiara Farronato & Andrey Fradkin, The Welfare Effects of Peer Entry in the Accommodation Market: The Case of Airbnb, 112 Am Econ Rev 1782 (June 2022).

[49] Specifically, they found that it generated $305 million in consumer surplus and $112 million in producer surplus.

[50] Sottera, Inc. v. Food Drug Admin., 627 F.3d 891 (D.C. Cir. 2010); Smoking Everywhere, Inc., et al v. FDA, et al, No. 10-5032 (D.C. Cir. 2010).

[51] Id.

[52] 21 CFR Parts 1100, 1140, and 1143.

[53] Guy Bentley & Julian Morris, The FDA Has Decimated the E-Cigarette Market, Reason Foundation (Sep. 22, 2021), https://reason.org/commentary/the-fda-has-decimated-the-e-cigarette-market.

[54] Jonathan H. Adler, Roger E. Meiners, Andrew P. Morriss, & Bruce Yandle, Baptists, Bootleggers & Electronic Cigarettes, 33 JREG 313 (2016).

[55] Matthew Feeney, Is Ridesharing Safe?, Cato Institute Policy Analysis (Jan. 27, 2015), available at https://www.cato.org/sites/cato.org/files/pubs/pdf/pa767.pdf.

[56] Daniel Prendergast, 700 Uber Drivers Could Be Fired Under New Bill, New York Post (Jul. 12, 2015), https://nypost.com/2015/07/12/700-uber-drivers-to-be-fired-under-new-bill.

[57] Nick Passaro, Uber Has an Antitrust Litigation Problem, Not an Antitrust Problem, CPI Antitrust Chronicle (May 2018), available at https://www.competitionpolicyinternational.com/wp-content/uploads/2018/05/CPI-Passaro.pdf.

[58] Philadelphia Taxi Association Inc. v. Uber Technologies Inc., No. 17-1871 (3d Cir. 2018), https://law.justia.com/cases/federal/appellate-courts/ca3/17-1871/17-1871-2018-03-27.html.

[59] Mike Scarcella, Uber, Lyft Drivers Claim Price-Fixing in Lawsuit Against Companies, Reuters (Jun, 21, 2022), https://www.reuters.com/business/autos-transportation/uber-lyft-drivers-claim-price-fixing-lawsuit-against-companies-2022-06-21.

[60] How the Nudge Unit Threw Light on Lighting Up, Civil Service Blog (Aug. 11, 2015), https://civilservice.blog.gov.uk/2015/08/11/how-the-nudge-unit-threw-light-on-lighting-up; see also David Hencke, Lord Heywood of Whitehall Obituary, The Guardian (Nov. 4, 2018), https://www.theguardian.com/politics/2018/nov/04/lord-heywood-of-whitehall-obituary, (“Heywood had been a heavy smoker and no doubt understood at a personal level the importance of offering safer alternatives. Sadly, in spite of quitting in 2011, he died of lung cancer in 2018 at the age of 56.”).

[61] See, e.g., Anne McNeil et al., E-cigarettes: An Evidence Update, Public Health England (August 2015), available at https://assets.publishing.service.gov.uk/government/uploads/system/uploads/attachment_data/file/733022/Ecigarettes_an_evidence_update_A_report_commissioned_by_Public_Health_England_FINAL.pdf.

[62] E-Cigarettes and Vaping: Policy, Regulation and Guidance, UK Office for Health Improvement and Disparities (October 2022), https://www.gov.uk/government/collections/e-cigarettes-and-vaping-policy-regulation-and-guidance.

[63] Shahla Wunderlich & Kelsey A. Gatto, Consumer Perception of Genetically Modified Organisms and Sources of Information, 6 Adv Nutr. 842 (Nov. 10, 2015), https://www.ncbi.nlm.nih.gov/pmc/articles/PMC4642419.

[64] Alexander Muacevic et al., The Anti-Vaccination Movement: A Regression in Modern Medicine, 10 Cureus e2919 (Jul. 3, 2018), https://www.ncbi.nlm.nih.gov/pmc/articles/PMC6122668.

[65] Linda Bauld, The Evidence Keeps Piling Up: E-Cigarettes Are Definitely Safer Than Smoking, The Guardian (Dec. 29, 2017), https://www.theguardian.com/science/sifting-the-evidence/2017/dec/29/e-cigarettes-vaping-safer-than-smoking.

[66] Michael Specter, Against the Grain: Should You Go Gluten-Free? The New Yorker (Oct. 27, 2014), https://www.newyorker.com/magazine/2014/11/03/grain.

[67] Yuanyuan Wu et al., Fake Online Review: Literature Review, Synthesis, and Direction for Future Research, 132 Decis. Support Syst. 113280 (May 2020.

[68] Counterintuitively, the presence of some inaccurate information may actually improve users’ ability to make good decisions, at least with regard to estimates of the size of effects, which is subject to cognitive biases. See Bertrand Jayles et al., How Social Information Can Improve Estimation Accuracy in Human Groups, 114 Proc. Nat. Acad. Sci. 12620 (Nov. 8, 2017), http://www.pnas.org/content/114/47/12620.

[69] Geoff Donaker, Hyunjin Kim, &Michael Luca, Designing Better Online Review Systems, Harv. Bus. Rev. (December 2019), https://hbr.org/2019/11/designing-better-online-review-systems.

[70] Aaron Smith & Monica Anderson, Online Shopping and E-Commerce: Online Reviews, Pew Research Center (Dec. 19, 2016), http://www.pewinternet.org/2016/12/19/online-reviews.

[71] Graeme Bruce, Most Consumers Trust Review Sites. Here’s What They Use Them for Most, YouGovAmerica (May 19, 2021), https://today.yougov.com/topics/technology/articles-reports/2021/05/19/most-consumers-trust-review-sites.

ICLE Issue Brief

The FTC’s UMC Policy Statement: Untethered from Consumer Welfare and the Rule of Reason

On Nov. 10, 2022, the Federal Trade Commission (FTC) issued a new policy statement regarding the scope of “unfair methods of competition” (UMC) under Section 5 of the FTC Act. The new statement fills the gap left by the Commission’s July 2021 rescission of its 2015 policy statement.

On Nov. 10, 2022, the Federal Trade Commission (FTC) issued a new policy statement[1] regarding the scope of “unfair methods of competition” (UMC) under Section 5 of the FTC Act. The new statement fills the gap left by the Commission’s July 2021 rescission[2] of its 2015 policy statement.[3] Democratic appointees Chair Lina Khan and Commissioners Rebecca Slaughter and Alvaro Bedoya voted in favor of the new policy statement, while Commissioner Christine Wilson, a Republican appointee, dissented.[4]

The new statement describes the policy changes that the Commission majority previewed in 2021: the FTC will target a much broader range of conduct than it has in the past, as it untethers “unfair methods of competition” from, inter alia, consumer welfare, the rule of reason, and actual or likely harm to competition.

The policy statement sketches an architecture for UMC determinations that, on closer inspection, is ephemeral or, at best, radically unspecified. Under the new statement, unfair methods of competition mean “conduct undertaken by an actor in the marketplace—as opposed to merely a condition of the marketplace, not of the respondent’s making, such as high concentration or barriers to entry.”[5] That seems largely unhelpful. But for the suggestion that, following established law, monopoly (or high concentration) or structural barriers to entry are still not to be deemed prohibited in or of themselves, this seems a statement that conduct will not be deemed unfair unless it is, in fact, commercial conduct. The contrast with “competition on the merits” lacks content: the FTC has no statutory charge to define competition on the merits, except in the breach; it has not defined “competition on the merits” in the past and it does not do so in the present policy statement.

We are provided with a necessary conjunction. Conduct will only be deemed unfair if it is both:

  1. “unfair”; and
  2. “tend[s] to negatively affect competitive conditions.”[6]

The first term of the conjunction is satisfied by conduct fitting under a complex, if vague, disjunction: conduct that is “coercive, exploitative, collusive, abusive, deceptive, predatory” or acts that “involve the use of economic power of a similar nature,” or conduct that “may” be “otherwise restrictive or exclusionary.”

The second term is noteworthy mostly for what it is not. It does not specify either harm to competition or harm to consumers, but rather a tendency (not necessarily a likelihood) to “negatively affect” (perhaps to harm) “competitive conditions.”

We are told UMC will apply only to conduct that satisfies both sides of the conjunction, but we are also told that the FTC will evaluate conduct under these two complex criteria on a sliding scale, such that, where the markers of “unfairness” are clear, a lesser showing of a tendency to have a negative impact on competitive conditions may suffice for a finding of liability, and vice versa.

Before we try to unpack the conditions proffered by the Commission’s new policy statement, we are told to disabuse ourselves of familiar terms and standards. First, the Commission expressly abandons the consumer welfare standard. In its place, we have a sort of any-party-in-the-marketplace standard, concerned with effects on “consumers, workers, or other market participants.”[7] Second, whether conduct “tends to” affect (negatively) any party “does not turn to whether the conduct directly caused actual harm in the specific instance at issue.” Effects need not be “current” or “measurable” or even “actual,” the distinctions between “unmeasurable” and “immeasurable,” and between “actual,” “likely,” and “possible,” notwithstanding,

Some of this relaxation of standards is supposed to be necessary to get at incipient harms under Section 5, and not just under Section 7 of the Clayton Act. But there’s a bit of a fudge on established notions of incipiency, and on the broader antitrust notion of actual or likely harm. An invitation to collude may be more or less likely to succeed, but it is, in any case, an attempt to do something that is per se unlawful; that is, something that is extremely likely to cause actual harm to competition and consumers should it come to fruition. There is no procompetitive rationale for an invitation to collude. But here, incipiency is divorced even from the notion that a given course of conduct by some specific party is likely to harm competition and consumers, whether it comes to fruition or not.

Second, the Commission expressly disavows the rule of reason, calling it “open ended” and capable of delivering “inconsistent and unpredictable results.”[8] At the same time, the new statement lacks any limiting principle, and it is hard to see how it could be more consistent or in any way predictable in application.

When we come to positive criteria, we find the unfairness laundry list catalogued above. Yet most of those terms lack any clear meaning under U.S. antitrust law, even if they occur here and there in dicta in Supreme Court or lower-court opinions. For example, after reeling off six terms of the “unfair” disjunction (coercive, exploitative, collusive, abusive, deceptive, and predatory), the statement first cites Sperry & Hutchinson for the proposition that Section 5 reaches conduct “shown to exploit consumers.” True, 50 years ago, the Court did wax expansive on the scope of Section 5.[9] In doing so, the Court opined that a showing of the exploitation of consumers—harm to consumers—could constitute a violation of Section 5. But the current policy statement does not require harm to either competition or consumers; and the notion that the Court would today sustain a finding of UMC liability absent harm to either competition or consumers is dubious. Moreover, the Sperry & Hutchinson Court’s discussion of “exploitation” was in no way necessary to its decision in that matter; that was, namely, that the Commission had not made its case without the bounds of the antitrust laws:

The opinion is barren of any attempt to rest the order on its assessment of particular competitive practices or considerations of consumer interests independent of possible or actual effects on competition. Nor were any standards for doing so referred to or developed.[10]

In brief, the Court’s hoary discussion of “exploitation” has no clear precedential value. But if it did, the discussion would give no guidance to industry or the bar on the question what today’s Commission means by “exploitation.” The Commission’s statement offers no clue at all about the limits to the conduct the Commission purports to proscribe.

Elsewhere in the statement, the Commission cites Leegin in support of the proposition that Section 5 reaches “parallel exclusionary conduct that may cause aggregate harm.” The citation seems inapt, at best, given Leegin’s holding, “that Dr. Miles should be overruled and that vertical price restraints are to be judged by the rule of reason.”[11] The Commission characterizes Leegin as “holding that the extent of adoption of resale price maintenance across the industry is relevant to legality.” The Court does opine that “the number of manufacturers that make use of the practice in a given industry can provide important instruction” in a rule-of-reason inquiry into the legality of a practice.[12] But that is not the holding in Leegin, which reversed a 5th U.S. Circuit Court of Appeals decision applying a per se standard of liability, as had the trial court below it. Leegin emphasized the importance of the rule of reason (rejected by the current policy statement) and consumer welfare (rejected by the current policy statement) and noted that conduct such as retail price maintenance “may not be a serious concern unless the relevant entity has market power”[13] (again, rejected by the current policy statement). The Commission might also recall the 9th U.S. Circuit Court of Appeals’ decision in Boise Cascade: “to allow a finding of a Section 5 violation on the theory that the mere widespread use of a practice makes it an incipient threat to competition would be to blur the distinction between guilty and innocent commercial behavior.”[14]

Having provided an essentially vague and open-ended account of “unfair methods of competition,” the Commission rejects the notion that it must consider any justifications for conduct it deems facially violative of that “standard.” It may, but the statement is clearest on the question of what will not suffice. Neither a demonstration of “net efficiencies” nor a “numerical cost-benefit” test will suffice;[15] neither will benefit in another market, no matter how inextricably tied to the one in which there’s a purported tendency to foster the open-ended harms. We are told that “[s]ome well-established limitations on what defenses are permissible in an antitrust case apply in the Section 5 context as well”—as if, perhaps, we wondered whether pretextual justifications might do when net efficiencies or net consumer benefits would not.

To justify the broad expansion of its interpretation of its UMC authority, the Commission reaches extensively, if selectively, into the legislative history of the FTC Act. The statement argues that, when Congress passed the FTC Act in 1914, it intended the law to be broader than the Sherman Act. That claim, at that level of abstraction, is uncontroversial. The question had never been whether the bounds of Section 5 exceed those of the Sherman Act, to any degree, in any context. Rather, there were live questions about the extent to which Section 5 does so, and the methods by which standalone Section 5 violations might be determined. The FTC portrays the new statement as a “restoration” of “rigorous enforcement” of the ban on unfair methods of competition,[16] but it does so without any rigor of its own, or any clear justification for fixing on some certain days past as halcyon.

As Commissioner Wilson observes in her dissenting statement, the Commission’s selective appeals to legislative history elides the congressional backlash triggered by the FTC’s overplaying its hand in the 1970s. It also ignores much of the past century’s development of antitrust jurisprudence, in which the Sherman and Clayton Acts have proved effective, and the courts (and the antitrust agencies) have developed principles to provide guidance as to what makes conduct unlawful.

It is well-established, as Commissioner Wilson acknowledges, that Section 5 reaches “incipient violations” of the antitrust laws. But eliminating the need to show likely anticompetitive effects, market power, or consumer harm attached to any given course of conduct, along with the repudiation of measurement (or estimation) and efficiency—as the statement does—in favor of a focus on an ill-defined “tendency to generate negative consequences” for some market participant or other can only serve to diminish rigor in FTC analysis and predictability in its conclusions. Rather, as Commissioner Wilson suggests, it is likely to favor the personal views or intuitions of a sitting majority of commissioners.

Commissioner Wilson observes that the statement “resembles the work of an academic or a think tank fellow” with dreams of “remaking the economy.”[17] Adopting only vague notions of the meaning of unfairness, and lacking grounding in established antitrust analysis, the FTC promises enforcement and possible rulemaking based on the idea that appointed “expert” commissioners will be best suited to determine what conduct is unlawful. This increases the odds of arbitrary actions by the FTC. Commissioner Wilson explains that the policy statement reflects an “I know it when I see it” approach “premised on a list of nefarious-sounding adjectives” without antitrust or economic meaning or any clear methodology.[18]

Chair Khan responds to Commissioner Wilson by arguing that Congress purposefully created an expert agency that would target conduct outside the scope of the antitrust laws under a definition of unfair methods of competition that the agency itself would create.[19] Perhaps, but in 1914, “outside the scope of the antitrust laws” meant beyond the scope of the 1890 Sherman Act, as then understood, not beyond all antitrust statutes and amendments to follow, come what may. And however the Commission’s UMC authority was (and mostly was not) specified in the FTC Act, it is clear that the agency—as an institution—was supposed to develop its expertise and the notion of UMC with oversight by (and input from) Congress and the courts. Reaching past several decades of established agency practice and decisions of the federal courts, including those of the Supreme Court, was never part of the institutional design. Not incidentally, it calls into question the subject matter of the Commission’s purported expertise.

The FTC has provided some clues as to what it hopes to accomplish, if not by any definite method or subject to any limiting principle. In the new policy statement, the Commission states that the “size, power, and purpose of the respondent” may be relevant to its UMC inquiry.[20] Abandoning the protection of consumer welfare, and looking to possible effects on “other market participants,” the FTC is setting its sight on so-called “bigness” and the protection of weaker competitors.

In his supporting statement, Commissioner Bedoya makes plain that the FTC should ensure a “level playing field for small business” and “all competitors,” arguing that it is not the FTC’s job to promote efficiency.[21] Commissioner Bedoya provides examples of conduct that the FTC may bring under the UMC umbrella, including conduct that may pass muster under the antitrust laws (or specifically, the rule of reason): local price cutting, tying conduct, exclusive contracts, rebates and preferential contracts, dominant control of inputs, manipulation, certain forms of refusal to deal, information collection on rivals, and coercion, threats, and intimidation. What Commissioner Bedoya and the Commission majority do not provide is a method for assessing when such conduct runs afoul of Section 5, or a policy rationale for condemning conduct without a showing of actual or likely harm to competition or consumers.

Finally, the policy statement also reiterates that the current FTC believes it has the power to create binding, substantive UMC rules. The combination of an assertion of overly broad and loosely defined substantive coverage of conduct, together with an assertion of broad remedial and legislative powers, previews an aggressive agency with heavy-handed enforcement and rulemaking to come.

* Daniel Gilman is a senior scholar with the International Center for Law & Economics (ICLE) and a former advisor at the Federal Trade Commission. Gus Hurwitz is ICLE’s director of law & economics programs.

[1] Policy Statement Regarding the Scope of Unfair Methods of Competition Under Section 5 of the Federal Trade Commission Act, Federal Trade Commission (Nov. 10, 2022), available at https://www.ftc.gov/system/files/ftc_gov/pdf/P221202Section5PolicyStatement.pdf [hereinafter “2022 UMC Policy Statement.”]

[2] Statement of Chair Lina M. Khan, Joined by Commissioner Rohit Chopra and Commissioner Rebecca Kelly Slaughter, on the Withdrawal of the Statement of Enforcement Principles Regarding “Unfair Methods of Competition” Under Section 5 of the FTC Act, Federal Trade Commission (Jul. 1, 2021), available at https://www.ftc.gov/system/files/documents/public_statements/1591498/final_statement_of_chair_khan_joined_by_rc_and_rks_on_section_5_0.pdf [hereinafter “2021 Withdrawal Statement.”]

[3] Statement of Enforcement Principles Regarding “Unfair Methods of Competition” Under Section 5 of the FTC Act, Federal Trade Commission (Aug. 13, 2015), available at https://www.ftc.gov/system/files/documents/public_statements/735201/150813section5enforcement.pdf.

[4] Dissenting Statement of Commissioner Christine S. Wilson, Federal Trade Commission (Nov. 10, 2022), available at https://www.ftc.gov/system/files/ftc_gov/pdf/P221202Section5PolicyWilsonDissentStmt.pdf [hereinafter “Wilson Dissent.’]

[5] 2022 UMC Policy Statement, supra note 1, at 8.

[6] 2022 UMC Policy Statement, supra note 1, at 9.

[7] Id.

[8] 2021 Withdrawal Statement, supra note 2, at 3.

[9] FTC v. Sperry & Hutchinson Co., 405 U.S. 233 (1972).

[10] Id., at para. 40.

[11] Leegin Creative Leather Products, Inc. v. PSKS, Inc., 551 U.S. 877 (2007).

[12] Id., at 17.

[13] Id., at 18.

[14] Boise Cascade v. FTC, 637 F.2d 573, 582 (9th Cir. 1980).

[15] 2022 UMC Policy Statement, supra note 1, at 11.

[16] FTC Restores Rigorous Enforcement of Law Banning Unfair Methods of Competition, Federal Trade Commission (Nov. 10, 2022), https://www.ftc.gov/news-events/news/press-releases/2022/11/ftc-restores-rigorous-enforcement-law-banning-unfair-methods-competition.

[17] Wilson Dissent, supra note 4, at 2.

[18] Id.

[19] Statement of Chair Lina M. Khan, Federal Trade Commission (Nov. 10, 2022), available at https://www.ftc.gov/system/files/ftc_gov/pdf/Section5PolicyStmtKhanSlaughterBedoyaStmt.pdf.

[20] 2022 UMC Policy Statement, supra note 1, at 9.

[21] Statement of Commissioner Alvaro M. Bedoya, Federal Trade Commission (Nov. 10, 2022), available at https://www.ftc.gov/system/files/ftc_gov/pdf/P221202Section5PolicyStmtBedoyaStmt.pdf.

ICLE Issue Brief

The Income Conundrum: Intent and Effects Analysis of Digital Discrimination

Section 60506 of the Infrastructure Investment and Jobs Act (“IIJA”)—signed by President Joe Biden on Nov. 15, 2021—requires the Federal Communications Commission (“FCC”) to adopt final rules facilitating equal access to broadband Internet.

Executive Summary

Section 60506 of the Infrastructure Investment and Jobs Act (“IIJA”)—signed by President Joe Biden on Nov. 15, 2021—requires the Federal Communications Commission (“FCC”) to adopt final rules facilitating equal access to broadband Internet. More specifically, the statutory text directs the FCC to prevent discrimination in broadband access based on income level, race, ethnicity, color, religion, or national origin, while also directing the Commission to consider issues of technical and economic feasibility.

Evaluating digital discrimination based on race, ethnicity, color, religion, or national origin should be relatively straightforward. But Section 60506 adds income level as a protected class. This presents what we call the “income conundrum.” It is virtually impossible to disentangle the factors affecting economic feasibility from factors correlated with membership in this particular protected class.

In this issue brief, we focus on the tension between the goals of preventing discrimination based on income level and ensuring that broadband-deployment projects are economically feasible, as well as the relevant distinctions between the application of intent-based or effects-based tests of discrimination. We find that some tests of so-called “digital discrimination” on the basis of income level—particularly in the context of effects-based “disparate impact” tests—can be misleading, and their application could be counterproductive.

First, it is important to note that Section 60506 refers to discrimination in the provision of broadband access and not to levels or rates of broadband adoption. While access is a necessary precondition to adopt broadband services, policymakers should be cautious not to infer that lack of adoption is necessarily caused by lack of access. Research finds that consumer income and the affordability of broadband services are key factors influencing whether those who enjoy broadband access will ultimately adopt broadband service. Other factors broadly correlated with income—such as age, educational attainment, and home-computer ownership and usage—similarly affect broadband-adoption decisions.

Thus, the use of income as a heuristic to determine whether providers’ deployment decisions are discriminatory is inherently fraught. Income level will influence consumer decisions to adopt broadband, which in turn affects providers’ ability to deploy to a given area. Therefore, while correlations between income and broadband adoption certainly can be found, research to date does not find evidence that—all else being equal—broadband providers intentionally discriminate against similarly situated groups on the basis of income, race, or other protected characteristics when it comes to broadband access.

Further, it is broadly agreed that Section 60506’s reference to “economic feasibility” refers to profitability—e.g., to whether broadband providers can earn a competitive return from their investments in deployment. Because broadband providers’ investment decisions are always constrained by their limited resources, they must prioritize deployment projects. As a consequence, they must decide not only whether a given project is likely to be profitable, but also how profitable it is likely to be relative to all other potential projects.

The expected profitability of any given broadband-deployment decision depends on a range of cost and demand factors. On the cost side, providers must consider a given territory’s population density and terrain, as well as such factors as state and local rules and taxes. On the demand side, the propensity of consumers who would be served by the deployment to both adopt and purchase broadband are key factors. Thus, the general willingness within a given territory to adopt broadband factors into deployment decisions. Where there is insufficient willingness to purchase broadband service, deployment may not be profitable.

Population density is generally acknowledged as the most important cost factor driving broadband-deployment decisions. The U.S. Government Accountability Office reports that population density is the cost factor most cited as “a critical determinant of companies’ deployment decisions,” a conclusion supported by academic research. Population density also figures into the demand side of the equation, as the GAO notes that low-density rural areas often struggle to “aggregate sufficient demand” to purchase broadband service. Because population density also can be correlated with demographic factors like income, race, age, educational attainment, and home-computer use, however, there may be a temptation for policymakers to infer digital discrimination in deployment decisions that were, in fact, based on population density or other permitted cost and demand considerations.

Further complicating the evaluation of digital-discrimination claims based on income is that, not only is income a key factor influencing whether a given consumer will adopt broadband, but it is also highly correlated with race, ethnicity, national origin, age, education level, and home-computer ownership and usage. Any rules promulgated under Section 60506 that fail to recognize this “income conundrum” will invite costly and time-consuming litigation based on allegations of digital discrimination either where it does not exist or where it is excused by economic-feasibility considerations. Moreover, this threat of litigation could hinder, rather than foster, further broadband deployment.

The U.S. Supreme Court has established tests governing when it is appropriate to conduct an effects-based “disparate impact” analysis in the context of discrimination law. Applying this rubric to Section 60506, we find that it lacks “results-oriented language.” The prohibition against digital discrimination “based on income level, race, ethnicity, color, religion, or national origin” would therefore apply only in cases of intentional discrimination in deployment decisions.  Mere statistical correlation between deployment and protected characteristics is insufficient to support a finding of discrimination.

Finally, to close the so-called “digital divide,” it would be wise to avoid creating inefficient bureaucratic processes through which broadband providers would be forced to defend economically justified deployment decisions. For this reason, FCC rules should articulate a presumption of non-discrimination, in which allegations of digital discrimination must be demonstrated, rather than a presumption of discrimination that must be rebutted for each deployment decision. Direct user support—such as that offered by the Affordable Connectivity Program and programs operated under the Universal Service Fund—is a much more direct and economically efficient way to help close the “adoption gap” component of the digital divide.

I. Introduction

As part of 2021’s Infrastructure Investment and Jobs Act (“IIJA”), Congress tasked the Federal Communications Commission (“FCC”)  with investigating and remedying “digital discrimination” in broadband deployment.[1] The law directs the Commission to adopt rules that “facilitate equal access to broadband internet access service,” which is defined as “preventing digital discrimination of access based on income level, race, ethnicity, color, religion, or national origin.”[2]  To this end, the Commission issued a Notice of Inquiry (“NOI”)[3] as a first step toward an ultimate rulemaking.[4]

The NOI states that “one of the Commission’s foremost goals is to ensure that every person in the United States has equal access to high-quality, affordable broadband internet access service… Every person across our Nation deserves—and must have—equal access to this crucial technology in the increasingly digital world; a person’s zip code should not determine their destiny.”[5]

But Section 60506 of the IIJA[6] creates a tension between the goals of encouraging greater broadband deployment and remedying alleged discrimination; indeed, some efforts to address the latter concern could result in slower investment in buildout. Importantly, the NOI does not focus on extending broadband deployment to the truly unserved—i.e., to those who lack any broadband Internet options at all.[7] In fact, the word “unserved” does not appear in the NOI at all, while the NOI instead declares that its target is the “underserved.”[8] But rather than define “underserved” consumers by reference to their relative inability to access broadband Internet service, the NOI defines the set as those who are members of categories that “have been historically underserved, marginalized, or adversely affected by persistent poverty or inequality” because of their income level, race, color, religion, or national origin.[9] The NOI therefore includes in the ranks of the “underserved” individuals who do have the ability to access broadband service, although potentially at slower speeds than some of their neighbors, or who have otherwise opted not to adopt broadband service.

Getting faster Internet to those who live where broadband service already exists, or assisting them in paying for access to the service that already exists, are fundamentally different problems than that faced by Americans who lack Internet access because they live in geographic areas without broadband infrastructure. Moreover, onerous or poorly implemented requirements that seek to curtail “digital discrimination” may be more likely to generally slow further broadband deployment than to speed it. An overly broad enforcement regime—one that sought to apply effects-based “disparate impact” tests or that operated from a presumption of discrimination—could force providers to constantly justify everything from decisions around actual deployment to decisions regarding whether to bid on particular deployment programs offered by governments.

Indeed, were the Commission to pursue economically ill-considered rules to curtail alleged “digital discrimination,” it could lead to intractable litigation. As we discuss below, the U.S. Supreme Court has in the recent past imposed limits on how “disparate impact” tests may be imposed by legislation.[10] These limits apply even to sectors with a demonstrated history of discriminatory redlining, such as housing.

It is undoubtedly important to examine patterns of deployment to discover how best to connect underserved communities. But if we are to overcome impediments that stand in the way of reaching every potential broadband consumer, it is essential that the FCC carefully consider how and why investment decisions are made in broadband markets.[11]

In short, we generally question the NOI’s framing of broadband-connectivity issues as being primarily or even substantially a matter of “discrimination.” Indeed, the IIJA’s project to eliminate “digital discrimination of access based on income level”[12] may not usefully forward efforts to connect the underserved at all. While there remains much work to be done to achieve the goal of universal connectivity, the FCC is already well-aware of the technical, economic, regulatory, and geographical issues that can impede deployment. The Commission should continue the important work it is already doing to address those issues and should ensure that its implementation of Section 60506 is focused on remedying cases where there is strong evidence of intentional discrimination against consumers based on protected characteristics.

In Part II, we analyze the relevant legal concerns for the Commission, should it seek to undertake a “disparate impact” rulemaking. In Part III, we discuss the theoretical and practical challenges that attend treating “income level” as a protected category. We address the economics of “access vs. adoption” and how, if not treated carefully, the issue would substantially skew any effects-based analysis of broadband-deployment patterns. We also discuss the economics of broadband deployment, including the factors that best explain deployment patterns. Part IV concludes with a brief set of policy recommendations.

II. Disparate Impact & Digital Discrimination: A Legal Analysis

Section 60506 requires that:

[T]he Commission shall adopt final rules to facilitate equal access to broadband internet access service, taking into account the issues of technical and economic feasibility presented by that objective, including… preventing digital discrimination of access based on income level, race, ethnicity, color, religion, or national origin; and… identifying necessary steps for the Commissions to take to eliminate discrimination… .[13]

Pursuant to this, the FCC asks in its NOI for:

… comment on how we should understand when digital discrimination is “based on” one of the listed characteristics. Does the term “based on” require discriminatory intent? If so, how would we determine the presence or absence of discriminatory intent? Would such an approach be practicably difficult to enforce? Alternatively or in addition, should we establish a “discriminatory effects” or disparate impact test? [14]

Advocates who support greater FCC authority to pursue alleged digital discrimination argue that the use of impermissible factors has contributed to underinvestment in minority communities and that “digital redlining has left unserved and underserved neighborhoods on the wrong side of the digital divide.”[15] Thus, a number of comments submitted to the record have called for the FCC to employ an effects-based “disparate impact” analysis under Section 60506.[16] As we discuss below, however, both the structure of Section 60506 and the Supreme Court’s established jurisprudence on disparate-impact analysis suggest that it would be much more reasonable for the Commission to construe Section 60506 as directing an analysis of intentional discrimination in deployment.

Statutes that define impermissible discrimination, such as the Civil Rights Act of 1964, can be analyzed legally either as addressed toward explicit discriminatory intent, referred to as “discriminatory treatment,” or toward behavior inferred from discriminatory effects, such as the “disparate impact” that the challenged behavior or policy has on a protected class.[17] A case involving discriminatory treatment is somewhat more straightforward,[18] insofar as it demands evidence demonstrating that decisions adversely affecting some protected class were made because of bias toward members of that class. In this context, where deployment decisions are made on the basis of discriminatory intent, the Commission is on much firmer legal ground to pursue them.

By contrast, were the Commission to adopt a “disparate impact” assessment as part of Section 60506, it would face an uphill legal climb. Among the primary justifications for disparate-impact analysis is to remedy those historical patterns of de jure segregation that left an indelible mark on minority communities.[19] While racial discrimination has not been purged from society, broadband only became prominent in the United States well after all forms of de jure segregation were made illegal, and after Congress and the courts had invested decades in rooting out impermissible de facto discrimination. Any policy intended to tackle disparate impact in broadband deployment needs to take this history into account.

Moreover, there is little evidence that IIJA’s drafters intended the law to be read so broadly. The legislative record on Section 60506 is exceedingly sparse, containing almost no discussion of the provision beyond assurances that “broadband ought to be available to all Americans,”[20] and also that the provision was not to be used as a basis for the “regulation of internet rates.”[21] Given that sparse textual basis, reading Section 60506 as granting the Commission expansive powers to serve as a broadband civil-rights czar could also run afoul of the “major questions” doctrine.[22] That doctrine requires Congress “to speak clearly if it wishes to assign to an agency decisions of vast ‘economic and political significance.’”[23]

More specifically, it does not appear that Section 60506 can be reasonably construed as authorizing disparate-impact analysis. While the Supreme Court continues to uphold disparate-impact analysis in the context of civil-rights law, it has recently imposed some important limitations. For example, in Texas Department of Housing & Community Affairs v. The Inclusive Communities Project, Inc., the Court upheld the disparate-impact doctrine, but noted that disparate-impact claims arise under statutes explicitly directed “to the consequences of an action rather than the actor’s intent.”[24] For example, in the Fair Housing Act, Congress made it unlawful:

To refuse to sell or rent after the making of a bona fide offer, or to refuse to negotiate for the sale or rental of, or otherwise make unavailable or deny, a dwelling to any person because of race, color, religion, sex, familial status, or national origin.[25] [Emphasis added.]

The Court noted that the presence of language like “otherwise make unavailable” is critical to construing a statute as demanding an effects-based analysis.[26] Such phrases, the Court found, “refer[] to the consequences of an action rather than the actor’s intent.”[27] Further, the structure of a statute’s language matters:

The relevant statutory phrases… play an identical role in the structure common to all three statutes: Located at the end of lengthy sentences that begin with prohibitions on disparate treatment, they serve as catchall phrases looking to consequences, not intent. And all [of these] statutes use the word “otherwise” to introduce the results-oriented phrase. “Otherwise” means “in a different way or manner,” thus signaling a shift in emphasis from an actor’s intent to the consequences of his actions.[28]

The Court reached this holding after reviewing a number of its previous decisions developing the distinction between effects-based and intent-based interpretations of a law. Particularly relevant here, in Univ. of Texas Sw. Med. Ctr. v. Nassar, the Court considered statutory language that prohibited discrimination “because of … age” and found that it only prevented intentional discrimination.[29] The Court also noted that, in previous cases, it had construed “because of” to mean “‘based on’ and that ‘based on’ indicates a but-for causal relationship.”[30]

Further, even where disparate analysis is appropriate, the Court held that it is significantly constrained by the need to ensure that the free-enterprise system continues to function:

[Supreme Court precedent] also teach[es] that disparate-impact liability must be limited so… regulated entities are able to make the practical business choices and profit-related decisions that sustain a vibrant and dynamic free-enterprise system. And before rejecting a business justification…a court must determine that a plaintiff has shown that there is “an available alternative … practice that has less disparate impact and serves the [entity’s] legitimate needs.”[31] [Emphasis added.]

In practice, this means that lower courts are free to probe a disparate-impact claim rigorously in order to avoid such claims becoming a club to wield against regulated entities.[32] It also suggests that, in a context such as Section 60506’s proscriptions against digital discrimination, they may not be so broad as to render it impossible for broadband providers to make effective decisions about which deployment projects are economically feasible.

Thus, as Section 60506 was drafted without “results-oriented language”[33] and instead frames the prohibition against digital discrimination as “based on income level, race, ethnicity, color, religion, or national origin,”[34] this would put the rule squarely within the realm of prohibitions on intentional discrimination.[35] That is, to be discriminatory, the decision to deploy or not to deploy must have been intentionally made because of the protected characteristic. Mere statistical correlation between deployment and protected characteristics is insufficient.

In enacting the IIJA, Congress was undoubtedly aware of the Court’s history with disparate-impact analysis. Had it chosen to do so, it could have made the requirements of Section 60506 align with the requirements of that precedent. But it chose not to do so, thereby reinforcing that it intended the FCC to have some discretion, but to err on the side caution when declaring practices an impermissible form of discrimination.

This is not to say that Section 60506 has no effect. As mentioned above, it can be reasonably read to encompass intentional discrimination, given appropriate evidence. Further, the means available to the FCC to remedy undesirable patterns of deployment are manifold. The only options rendered off the table would be requirements that are technologically or economically infeasible, such as an unfunded mandate that providers deploy at maximum speeds to all households simultaneously. As discussed further below, the FCC also has broad authority over various funding programs that it could use to generate both user subsidies and provider incentives to deployment, which could go a long way toward closing the digital divide.

III. Using Income as a Measure of Digital Discrimination

Evaluating digital discrimination based on race, ethnicity, color, religion, or national origin should be relatively straightforward. But Section 60506 adds income level as a protected class. This presents what we call the “income conundrum.” It is virtually impossible to disentangle the factors affecting economic feasibility from factors correlated with membership in this particular protected class.

The expected profitability of any given broadband-deployment decision will hinge on a range of cost and demand factors. On the cost side, providers must consider a given territory’s population density and terrain, as well as such factors as state and local rules and taxes. On the demand side, the propensity of consumers who would be served by the deployment to both adopt and purchase broadband are key factors. Thus, the general willingness within a given territory to adopt broadband weighs heavily in providers’ deployment decisions. Where there is insufficient willingness to purchase broadband service, deployment may not be profitable.

As we explain below, economic feasibility is essentially synonymous with return on investment. While income may be correlated with some factors that drive decisions to deploy, animus against potential customers with protected characteristics is almost certainly not an important factor in deployment decisions. Thus, even if the Commission engages in an intent-based analysis under Section 60506, there are many economic-feasibility factors it needs to take into consideration, which we set forth below.

A.   Access vs. adoption

The text of Section 60506 refers to discrimination in the provision of broadband access and not to levels or rates of broadband adoption. While access is a necessary precondition to adopt broadband services, policymakers should be cautious not to infer that lack of adoption is necessarily caused by lack of access. Research finds that consumer income and the affordability of broadband services are key factors influencing whether those who enjoy broadband access will ultimately adopt broadband service. Other factors that may be broadly correlated with income—such as age, educational attainment, and home-computer ownership and usage—similarly influence broadband-adoption decisions. Thus, comparing relative levels of income in territories that are, or are not, chosen for broadband deployment is a poor heuristic to determine whether providers’ deployment decisions are discriminatory. Local income will influence consumer decisions to adopt broadband, which in turn affects whether it will be economically feasible for providers’ to deploy to a given area.

The Commission therefore should not summarily conclude that deployment patterns correlated with income are a form of impermissible discrimination. As explained above, in order to run afoul of Section 60506, the Commission should insist that challenged deployment decisions are directly attributable to an intentional choice not to serve consumers who are members of a protected category. To apply analysis that ignores intent and instead looks at whether members of such categories are impacted disparately by deployment decisions would threaten to create an unmanageable and open-ended legal standard that ultimately slows deployment overall.

Broadband access alone also may not be sufficient to drive greater rates of broadband adoption. For example, Brian Whitacre and his co-authors found that, while the reduced levels of broadband access in rural areas explained 38% of the rural-urban broadband-adoption gap in 2011, differences in other general characteristics—such as income and education—explain “roughly half of the gap.”[36] A report by the U.S. Government Accountability Office concluded that “even where broadband service is available … an adoption gap may persist due to the affordability of broadband and lack of digital skills.”[37] The GAO report notes that nearly one-third of those with access to broadband do not subscribe to it and that “lower-income households have lower rates of home broadband subscriptions.”[38]

The price of broadband services is another significant factor that affects adoption. A National Telecommunications and Information Administration survey of Internet use identified “affordability as a driving factor around why some households continue to remain offline, confirming that cost of service is an essential part of increasing Internet adoption.”[39] The survey reported that the average price that offline households wanted to pay for Internet access was approximately $10 per month, and about 75% of households gave $0 or “none” as their answer. Kenneth Flamm and Anindya Chaudhuri’s empirical research finds that broadband price is a “statistically significant driver” of broadband demand.[40] They conclude that broadband-price declines in the early 2000s explain “some portion” of increased broadband adoption.[41] Victor Glass and Stela Stefanova’s empirical study indicates that higher prices “depress” demand for broadband.[42]

Price sensitivity is closely tied to income. Christopher Reddick and his co-authors concluded that “[i]ncome is a major factor that is likely to influence broadband adoption especially where technology is available.”[43] Glass and Stefanova find broadband service to be a normal good, which means that increased incomes are associated with increased broadband adoption—a finding consistent with previous research.[44] Similarly, the GAO reports: “A recent nationally representative survey by Consumer Reports reported that nearly a third of respondents who lack a broadband subscription said it was because it costs too much, while about a quarter of respondents who do have broadband said they find it difficult to afford.”[45] Alison Powell and her co-authors report that a significant number of low-income Americans engage in a cycle of broadband adoption and “un-adoption,” in which they adopt broadband and then drop it for financial or other reasons, and then re-adopt when circumstances improve for them.[46]

In addition to price and income guiding a household’s broadband-adoption decisions, other factors are also relevant. Tonny Oyana’s empirical research concludes that income, the share of a population who are senior citizens, and the share with some college education are the “three most important demand-side factors” affecting both access and adoption.[47] The GAO reports that “[o]ther barriers include lack of digital skills,” citing a 2016 Pew Research Center report finding that “about half of American adults were hesitant when it comes to new technologies and building their digital skills.”[48]

It can be argued that the gap between broadband access and adoption may present the real digital divide. That is, large numbers of American who have access to broadband do not adopt it, and some who do may “un-adopt” it. While income is a key factor in a household’s adoption choice, it is only one of several important factors, which also include age, educational attainment, and home-computer ownership and usage—each of which is, in turn, also correlated with income. As discussed below, deployment decisions are based on many factors, including a territory’s projected broadband adoption. If firms do not expect sufficient levels of adoption, then deployment may be unprofitable. It would be a mistake to infer that income discrimination in deployment causes low rates of broadband adoption in low-income communities when low income itself—and other factors correlated with income—may be a primary cause of low rates of broadband adoption.

B.   Equal access and economic feasibility

Section 60506 requires the Commission to take account of “issues of technical and economic feasibility.” There is broad consensus that “economic feasibility” here refers to profitability.[49] More precisely, a project is economically feasible if it provides an adequate return on investment (ROI). Like all firms, broadband providers have limited resources with which to make their investments. While profitability is a necessary precondition for investment, not all profitable investments can be undertaken. Among the universe of potentially profitable projects, firms are likely to give priority to those that promise greater returns on investment relative to those with lower ROI. Thus, any evaluation of potential digital discrimination must examine not only whether a given deployment is likely to be profitable, but also how its expected returns compare to other investment opportunities.

Returns on investment in broadband depend on several factors. As noted earlier, population density, terrain, regulations, and taxes are all important cost factors, while a given consumer population’s willingness to adopt and pay for broadband are key demand-related factors.

In addition to these cost and demand factors, the timing of both investment and adoption affect the ROI of a deployment investment. Consider two hypothetical investments, shown in Table I below. Both Deployment A and Deployment B require the same initial investment of $100 million and both ultimately generate the same income of $44 million a year. However, Deployment B has a slower adoption rate. Not only does Deployment B generate lower income over the hypothetical 20-year life of the investment, but its ROI is less than half that of deployment A. While both deployments are profitable and both eventually generate the same annual income, relative to deployment A, deployment B is unprofitable.

Table 1: How Timing Affects ROI in Hypothetical Deployments A and B

Source: Authors

Because the timing of investment returns is critical in a firm’s deployment decisions, local regulations that slow broadband buildout can have significant effects on a deployment investment’s ROI.

C.   Density in broadband deployment

By far, population density is widely acknowledged to be the most important cost factor driving broadband-deployment decisions. For example, the GAO reports that population density is the “most frequently cited cost factor” and “a critical determinant of companies’ deployment decisions.”[50]

Academic research supports the GAO’s conclusions. For example, Brian Whitacre and Roberto Gallardo describe population density as one of “the main determinants of Internet availability.”[51] Similarly, Oyana—citing earlier research—concludes that “[l]imited broadband access is common in rural communities because of geographic remoteness and low population density.”[52] Juan Schneir and Yupeng Xiong identify that firms are more likely to deploy broadband in urban and suburban areas, rather than rural areas, due to both cost and demand factors. They note this is “because of the high density of users willing to pay for high-speed broadband services and the relatively low network rollout costs in urban and suburban areas.”[53] Consistent with Schneir & Xiong’s conclusion, the GAO also finds that population density is an important factor on the demand side of deployment decisions. In particular, the GAO concludes that it is more difficult to “aggregate sufficient demand” to pay for broadband service in low-density rural areas.[54]

Several other factors also affect the profitability of broadband-deployment investments. The GAO identifies terrain as an important factor, concluding that “it is more costly to serve areas with low population density and rugged terrain with terrestrial facilities than it is to serve areas that are densely populated and have flat terrain.”[55] The GAO also reports that the cost of “backhaul” can affect broadband deployment to rural areas. “Backhaul” is the cost of routing Internet traffic from rural areas to larger cities in order to connect to a major Internet backbone provider.[56] Whitacre & Gallardo find that state-level broadband-funding programs are associated with a modest increase (1.2–2.0 percentage points) in broadband availability.[57] On the demand side, the GAO reports that “demand will be greater in areas where potential customers are familiar with computers and broadband.”[58]

Population density is also correlated to varying degrees with such demographic factors as income, race, age, educational attainment, and home-computer use. Thus, one should be cautious about inferring digital discrimination based on such factors from deployment decisions that are likely to be based on population density.

D.   The income conundrum

As noted above, the evaluation of digital-discrimination claims based on income level is complicated by the fact that income is a key factor—and perhaps the key factor—affecting broadband adoption. Moreover, it is also correlated with race, ethnicity, national origin, age, education level, and home-computer ownership and usage. Adoption of Section 60506 rules that do not recognize this “income conundrum” will invite costly and time-consuming disparate-impact litigation alleging digital discrimination, both where no such discrimination exists and where it is excused by economic-feasibility considerations. The threat of litigation from injudicious rulemaking also may hinder, rather than foster, further broadband deployment.

Randolph Beard and George Ford report:[59]

Survey evidence and empirical research on broadband adoption show that income has a demonstrable effect on demand. Also, empirical research and survey evidence show that some racial minorities—in particular, Hispanic, Black, and Native Americans—are less likely to adopt fixed-service broadband services in the home. Moreover, income is correlated with many factors that affect demand including, among other things, employment, education levels, and housing stability, which makes the determination of “income discrimination” extremely difficult since it is the discriminatory treatment of low-income households, and not these other correlated factors, that is mentioned in the statute. Minority population shares and income levels are also correlated with population density, which affects the cost of network deployment and upgrades. Quantifying “digital discrimination” is, therefore, an extremely challenging endeavor.

In addition to the factors identified by Beard & Ford, income is correlated with several factors associated with broadband adoption. For example, Pew reports that, among lower-income adults:[60]

  • 41% do not have a desktop or laptop computer and a majority are not tablet owners. Pew indicates that each of these technologies is “nearly ubiquitous” among adults in households earning more than $100,000 annually.
  • 13% of adults with annual household incomes below $30,000 do not have access to any of these technologies at home (e., home-broadband services, a smartphone, a desktop or laptop computer, or a tablet); by contrast, only 1% of adults from households making more than $100,000 a year report a similar lack of access.
  • 27% of adults living in households earning less than $30,000 annually are smartphone-only Internet users, meaning they own a smartphone but do not have broadband Internet at home.

Some argue that broadband has become more of a necessity over time,[61] akin to utilities for home heating, cooling, and cooking.[62] According to Ryan Finnigan and Kelsey Meagher, low-income households spend approximately half their monthly income on housing and another 10-20% on utilities.[63] The incidence of utility disconnections can provide an indication of ability or willingness to pay for broadband. If a household is more likely to experience a utility disconnection, the household is likely to have a lower ability to pay for a broadband connection. In this sense, broadband disconnections for non-payment can be seen as an extreme form of “un-adoption,” as described by Powell, et al. Diana Hernández and Jennifer Laird’s empirical research on utility disconnections finds that disconnections are correlated with income, education, and home-ownership status, as well as race:[64]

Disconnections are disproportionately high among households with low incomes, a Black head of household, a head who does not have a high school diploma, mobile homes, older homes, poorly insulated homes, rentals, rural homes, and homes in the Northeast. Among those households with an income less than $20,000, nearly 8% have experienced a disconnection—a rate about 2.5 times as high as those with incomes between $20,000 and $59,999.

If a broadband provider determines a given territory is likely to have a low adoption rate or a high “un-adoption” rate, it is likely to conclude that deployment to that locality is less economically feasible than other territories. Empirical evidence suggests that race and income are among the factors associated with broadband adoption and un-adoption. Other factors like population density, education, age, familiarity with computers, and computer ownership are also known to be correlated with race and income and, indeed, race and income are widely known to be correlated with each other. For example, Beard & Ford show that U.S. Census blocks with higher population densities are associated with a higher share of minority residents and lower average incomes. They also report that blocks with a higher share of minority residents have lower fixed-broadband adoption rates and a higher share of mobile-only broadband use.[65]

Beard & Ford attempt to statistically untangle the income conundrum.[66] Their empirical model includes four demand factors for each Census block: fixed-broadband adoption rate, mobile-broadband adoption rate, the share of persons with a tertiary education, and the share of homes with a computer. The model also includes five cost factors: population density, the share of rural blocks within the Census-block group, and three cost categories from CostQuest. Using this information, they evaluate: (1) fiber deployment by race, (2) fiber deployment by income level, (3) download speeds by race, and (4) download speeds by income level. Beard & Ford conclude from their statistical analysis that there is “no meaningful evidence of digital discrimination in either race or income for fiber deployments or for download speeds.” But Beard & Ford is just a single study looking at the possibility of nationwide discrimination. While their approach is rigorous and provides compelling results, it would be challenging to “scale down” the approach to evaluate digital discrimination by firms or locality.

Consider a hypothetical FCC rule mandating that broadband providers must completely exclude income level, race, ethnicity, color, religion, and national origin from their deployment calculus. Instead, firms must rely on their estimates of deployment costs—including population density, terrain, local regulations, and local taxes—and non-protected demand factors, such as population density, education, age, utility-disconnection rates, and rates of computer ownership and usage. This would be one plausible implementation of an intent-based test of digital discrimination under Section 60506. So long as providers’ deployment decisions are not made “because of” any of the protected characteristics, then they would not be found to be practicing digital discrimination. Whether these other factors—education, age, population density, computer usage—are sufficient on their own to determine the economic feasibility of a deployment project is a separate empirical question beyond the scope of this brief.

But because each of these other factors are correlated with income level—and with other protected characteristics—applying an effects-based statistical analysis is likely to produce a false positive concluding the presence of digital discrimination, even when there was an explicit effort to avoid such discrimination. This is a version of Nobel laureate Ronald Coase’s well-known quote: “If you torture the data long enough, it will confess.”[67]

IV. Conclusion

The economics discussed above underscore that the FCC must be particularly cautious when promulgating rules under Section 60506. In particular, the Commission should adopt an intent-based discriminatory-treatment standard, rather than one that opens the doors to disparate-impact claims. The high risk of false positives under a disparate-impact standard would stifle broadband deployment through additional costs, delays, and risk of litigation. Similarly, FCC rules should articulate a presumption of non-discrimination in which allegations of digital discrimination must be demonstrated, rather than a presumption of discrimination that must be rebutted for each deployment decision. Otherwise, given the economic realities discussed above, there is an unacceptably high chance that every one of a provider’s decisions will be subject to challenge, wasting the resources of both the Commission and the providers.

The largest takeaway is that adoption matters quite a bit. Indeed, one of the biggest issues affecting economic feasibility is consumers’ willingness to pay. Moreover, Congress has recognized this reality in its recent legislation. The IIJA’s Broadband Equity and Access program provides more than $42 billion in grants to state programs to help them support providers and give assistance directly to users.[68] The Affordable Connectivity Program provided another $14 billion in funding to help users pay for devices and broadband connections.[69]

If the Commission has good evidence of intentional discrimination in the deployment of broadband, it has a role to play in preventing it. But without strong, compelling evidence of intentional discrimination, the FCC will waste scarce resources chasing bogeymen.

[1] H.R. 3684, 117th Cong. (2021).

[2] 47 U.S.C. § 1754(b).

[3] Notice of Inquiry, In the Matter of Implementing the Infrastructure Investment and Jobs Act: Prevention and Elimination of Digital Discrimination, GN Docket No. 22-69 (Feb. 23, 2022), at para. 1 [hereinafter “NOI”].

[4] This issue brief supplements and extends the comments we submitted to the Commission as part of the NOI: Comments in the Matter of Implementing the Infrastructure Investment and Jobs Act: Prevention and Elimination of Digital Discrimination, GN Docket No. 22-69, International Center for Law & Economics (2022), accessed at: https://laweconcenter.org/resource/icle-comments-to-the-fcc-on-prevention-and-elimination-of-digital-discrimination.

[5] NOI, supra note 4, at para. 1.

[6] 47 U.S.C. § 1754 [hereinafter “Section 60506”]

[7] Currently defined by the FCC as 25/3 Mbps for terrestrial fixed broadband and 10/1 for mobile broadband. See Fourteenth Broadband Deployment Report, In the Matter of Inquiry Concerning Deployment of Advanced Telecommunications Capability to All Americans in a Reasonable and Timely Fashion, GN Docket No. 20-269 (Jan. 19, 2021), at para. 12 (defining terrestrial fixed broadband), para. 15 (defining mobile broadband) [hereinafter “Fourteenth Broadband Deployment Report”].

[8] NOI, supra note 4, at para. 2 (quoting 47 U.S.C. § 1754(b)(1)).

[9] Id. at para. 3, n. 5; id. at para. 40 (both quoting Executive Order 13985).

[10] Texas Dept. of Housing & Community Affairs v. The Inclusive Communities Project, 576 U.S. 519, (2015).

[11] See, Geoffrey A. Manne, Kristian Stout, & Ben Sperry, A Dynamic Analysis of Broadband Competition: What Concentration Numbers Fail to Capture, ICLE White Paper (June 2021), available at https://laweconcenter.org/wp-content/uploads/2021/06/A-Dynamic-Analysis-of-Broadband-Competition.pdf [hereinafter “ICLE Broadband Competition Paper”].

[12] NOI, supra note 4, at para. 2.

[13] Section 60506, supra note 6, at (b)(1)-(b)(2).

[14] NOI, supra note 4, at para. 22.

[15] Comments of the Joint Advocates on Digital Discrimination, GN Docket No. 22-69 (May 16, 2022).

[16] See Comments of Public Knowledge, GN Docket No. 22-69 (May 16, 2022), pp 7-10; see also, Comments of the Multicultural Media Telecom and Internet Council, GN Docket No. 22-69 (May 16, 2022); Reply Comments of the National Digital Inclusion Alliance, GN Docket No. 22-69 (June 30, 2022).

[17] Ricci v. DeStefano, 557 U.S. 557, 577, (2009).

[18] See, id. (Intentional discrimination cases “present the most easily understood type of discrimination…[that] occur[s] where [a party[ has treated [a] particular person less favorably than others because of a protected trait.”).

[19] Texas Dep’t of Hous. & Cmty. Affs., 576 U.S. at 528–29.

[20] 167 Cong. Rec. 6046 (2021).

[21] 167 Cong. Rec. 6053 (2021).

[22] See, e.g., West Virginia v. EPA, 142 S. Ct. 420, (2021).

[23] Util. Air Regulatory Group v. EPA, 573 U.S. 302, (2014) quoting FDA v. Brown & Williamson Tobacco Corp., 529 U.S. 120, (1999); see also, West Virginia v. EPA, 142 S. Ct. 420.

[24] Texas Dep’t of Hous. & Cmty. Affs., 576 U.S. at 534.

[25] 42 U.S.C. § 3604(a) (emphasis added).

[26] Texas Dep’t of Hous. & Cmty. Affs., 576 U.S. at 534.

[27] Id.

[28] Id. at 534-35.

[29] Univ. of Texas Southwestern Med. Ctr. v. Nassar, 570 U.S. 338, 350, (2013) (citing Gross v. FBL Fin. Servs., Inc., 557 U.S. 167, 176, (2009)).

[30] Id. (citing Safeco Ins. Co. of America v. Burr, 551 U.S. 47, 63–64; n. 14, (2007)).

[31] Texas Dep’t of Hous. & Cmty. Affs., 576 U.S. at 533 (emphasis added).

[32] Texas Dep’t of Hous. & Cmty. Affs., 576 U.S. at 521–22 (“Courts should avoid interpreting disparate-impact liability to be so expansive as to inject racial considerations into every housing decision. These limitations are also necessary to protect defendants against abusive disparate-impact claims.”).

[33] Id.

[34] Section 60506, supra note 6 (emphasis added).

[35] See, e.g., Ricci, 557 U.S. 557.

[36] Brian Whitacre, Sharon Strover & Roberto Gallardo, How Much Does Broadband Infrastructure Matter? Decomposing the Metro–Non-Metro Adoption Gap with the Help of the National Broadband Map, 32 Gov’t Info. Q. 261 (2015).

[37] U.S. Gov’t Accountability Off., GAO-22-104611, Broadband: National Strategy Needed to Guide Federal Efforts to Reduce Digital Divide (May 31, 2022) [hereinafter “GAO-22-104611”].

[38] Id. See also, How Do Speed, Infrastructure, Access, and Adoption Inform Broadband Policy?, Pew Research Center (Jul. 7, 2022), https://www.pewtrusts.org/en/research-and-analysis/fact-sheets/2022/07/how-do-speed-infrastructure-access-and-adoption-inform-broadband-policy (“nearly 1 in 4 Americans do not subscribe to a home broadband connection, even where one is available”).

[39] Michelle Cao & Rafi Goldberg, New Analysis Shows Offline Households Are Willing to Pay $10-a-Month on Average for Home Internet Service, Though Three in Four Say Any Cost is Too Much, National Telecommunications and Information Administration (Oct. 6, 2022), https://www.ntia.doc.gov/blog/2022/new-analysis-shows-offline-households-are-willing-pay-10-month-average-home-internet.

[40] Kenneth Flamm & Anindya Chaudhuri, An Analysis of the Determinants of Broadband Access, 31 Telecomm. Pol’y. 312 (2007).

[41] Id.

[42] Victor Glass & Stela K. Stefanova, An Empirical Study of Broadband Diffusion in Rural America, 38 J. Reg. Econ. 70 (Jun. 2010).

[43] Christopher G. Reddick, Roger Enriquez, Richard J. Harris & Bonita Sharma, Determinants of Broadband Access and Affordability: An Analysis of a Community Survey on the Digital Divide, 106 Cities 102904 (2020).

[44] Victor Glass & Stela K. Stefanova, supra, note 43 at 70.

[45] GAO-22-104611, supra note 37.

[46] Alison Powell, Amelia Bryne & Dharma Dailey, The Essential Internet: Digital Exclusion in Low-Income American Communities, 2 Pol’y & Internet 161 (2010).

[47] Tonny J. Oyana, Exploring Geographic Disparities in Broadband Access and Use in Rural Southern Illinois: Who’s Being Left Behind?, 28 Gov’t. Info. Q. 252 (2011).

[48] GAO-22-104611, supra note 37.

[49] Notice of Inquiry, Implementing the Infrastructure Investment and Jobs Act: Prevention and Elimination of Digital Discrimination, GN Docket No. 22-69 (2022) (“If underlying cost or geographic hurdles exist in conjunction with demand in an area that makes it unprofitable, how should the Commission address such a situation?”).

[50] U.S. Gov’t Accountability Off., GAO-06-426, Telecommunications: Broadband Deployment Is Extensive Throughout the United States, but It Is Difficult to Assess the Extent of Deployment Gaps in Rural Areas (May 2006), https://www.gao.gov/assets/gao-06-426.pdf. [hereinafter “GAO-06-426”].

[51] Brian Whitacre & Roberto Gallardo, State Broadband Policy: Impacts on Availability, 44 Telecomm. Pol’y. 102025 (2020).

[52] Tonny J. Oyana, supra note 47 at 252.

[53] Juan Rendon Schneir & Yupeng Xiong, A Cost Study of Fixed Broadband Access Networks for Rural Areas, 40 Telecomm. Pol’y. 755 (2016).

[54] GAO-06-426, supra note 50.

[55] Id.

[56] Id.

[57] Brian Whitacre & Roberto Gallardo, State Broadband Policy: Impacts on Availability, 44 Telecomm. Pol’y. 102025 (Oct. 2020).

[58] GAO-06-426, supra note 50.

[59] T. Randolph Beard & George S. Ford, Digital Discrimination: Fiber Availability and Speeds, by Race and Income, Phoenix Ctr. for Advanced Legal & Econ. Pol’y Stud., Phoenix Ctr. Pol’y Paper No. 58 (September 2022).

[60] Emily A. Vogels, State Broadband Policy: Impacts on Availability, Pew Research Center (Jun. 22, 2021), https://www.pewresearch.org/fact-tank/2021/06/22/digital-divide-persists-even-as-americans-with-lower-incomes-make-gains-in-tech-adoption.

[61] Victor Glass & Stela K. Stefanova, An Empirical Study of Broadband Diffusion in Rural America, 38 J. Reg. Econ. 70 (2010) (“The low price elasticity found in the 2009 study indicates that broadband access has become more of a necessity than it used to be in 2005.”).

[62] Meredith Whipple & Aden Hizkias, We Already Knew Broadband Should Be a Public Utility. The Pandemic Made It Obvious, Public Knowledge (Mar. 15, 2021), https://publicknowledge.org/we-already-knew-broadband-should-be-a-public-utility-the-pandemic-made-it-obvious.

[63] Ryan Finnigan & Kelsey D. Meagher, Past Due: Combinations of Utility and Housing Hardship in the United States, 62 Sociological Persp. 91 (2018).

[64] Diana Hernández & Jennifer Laird, Surviving a Shut-Off: U.S. Households at Greatest Risk of Utility Disconnections and How They Cope, 66 Am. Behav. Sci. 856 (2022).

[65] T. Randolph Beard & George S. Ford, Digital Discrimination: Fiber Availability and Speeds, by Race and Income, Phoenix Ctr. for Advanced Legal & Econ. Pol’y Stud., Phoenix Ctr. Pol’y Paper No. 58 (2022).

[66] Id.

[67] Garson O’Toole, If You Torture the Data Long Enough, It Will Confess, Quote Investigator (Jan. 18, 2021), https://quoteinvestigator.com/2021/01/18/confess.

[68] Broadband Equity, Access, and Deployment Program, BroadbandUSA, https://broadbandusa.ntia.doc.gov/resources/grant-programs/broadband-equity-access-and-deployment-bead-program (last visited Oct. 23, 2022).

[69] Affordable Connectivity Program, Federal Communications Commission, https://www.fcc.gov/acp (last visited Oct. 23, 2022).

Source: SSRN

ICLE Issue Brief