Carveouts at Checkout: Small Savings, Large Costs, and the Payment-Card Settlement

All Related Posts

Carveouts at Checkout: Small Savings, Large Costs, and the Payment-Card Settlement

Executive Summary The proposed settlement of the longstanding multidistrict Visa and Mastercard antitrust litigation would reduce interchange fees and expand merchants’ options for card acceptance, . . .

Executive Summary

The proposed settlement of the longstanding multidistrict Visa and Mastercard antitrust litigation would reduce interchange fees and expand merchants’ options for card acceptance, surcharging, and steering. Meanwhile, various state legislative carveouts, led by Illinois’ Interchange Fee Prohibition Act, seek to eliminate interchange fees on taxes and/or gratuities. Both approaches aim to lower merchants’ acceptance costs, but the multidistrict litigation settlement would deliver broader relief with far lower merchant compliance costs—in addition to weakening the case for legislative carveouts.

The settlement’s average interchange reduction would equal roughly 0.1% of covered credit card sales, comparable to Illinois’ projected gross carveout savings. Merchants on interchange-plus pricing would receive the reduction directly, while savings under blended pricing would depend on processors’ adjustments. Carveouts would also require costly system upgrades or reimbursement claims, potentially consuming smaller merchants’ savings. Lower settlement rates would further shrink carveout benefits, concentrating gains among large retailers. Merchants recovering their acceptance costs through surcharges would have little additional benefit to gain.

The two interventions would also interact in costly ways. The settlement’s caps would constrain efforts to offset carveout losses through interchange adjustments, shifting costs toward cardholders through reduced rewards or higher fees. Federal preemption also appears likely to concentrate the remaining institutional losses on local banks and credit unions. Carveouts could count toward the settlement’s nationwide reduction, reducing relief elsewhere, while implementation would compete for engineering capacity. Both interventions might also shift transactions toward more expensive three-party cards, including American Express and Discover.

The settlement itself would likely impose net economic costs through reduced cardholder benefits and higher fees. State carveouts would add compliance burdens and distortions for increasingly narrow gains. Whether or not the settlement is ultimately approved, Illinois should repeal its carveout, and other states should abandon similar proposals. Capped compensation for electronic tax remittance offers a more direct way to address merchants’ tax-collection costs.

I. Introduction

Judge Brian Cogan of the U.S. District Court for the Eastern District of New York granted preliminary approval June 9, 2026, to the proposed settlement of In re Payment Card Interchange Fee and Merchant Discount Antitrust Litigation, a multidistrict litigation proceeding. The 21-year-old antitrust action involves a mandatory class of more than 12 million U.S. merchants—who cannot opt out—suing Visa, Mastercard, and their member banks.[1]

Court-appointed experts value the settlement at roughly $38 billion through 2031. It would reduce average credit interchange rates—the fees merchants’ banks pay card-issuing institutions—by 10 basis points, or 0.1% of transaction value, for five years. It would also freeze posted rates at March 2025 levels, cap standard consumer credit card rates at 1.25% for at least eight years, repeal the honor-all-cards rule requiring merchants to accept all cards within a network, and expand merchants’ rights to surcharge, discount, and negotiate collectively.[2]

While negotiating the settlement, merchant groups pursued a parallel campaign in state legislatures to exclude specific portions of card transactions from interchange fees. Only Illinois has thus far enacted legislation, which remains in legal limbo, with implementation deferred until July 1, 2027.[3] If implemented, the Illinois Interchange Fee Prohibition Act (IFPA) would prohibit retaining interchange fees on the portions of a card transaction attributable to state and local taxes and gratuities.[4]

Similar bills were defeated 46 times in more than two dozen states in 2025 and 2026. None became law. Colorado’s version passed the legislature in May 2026 before Gov. Jared Polis vetoed it.[5] Delaware has considered a bill directed at gratuities, Rhode Island has held hearings, Pennsylvania continues to advance carve-out measures, and Massachusetts has convened a special commission whose remit includes interchange regulation.[6] These proposals rest on the premise that merchants pay too much to accept payment cards, particularly on amounts they collect for the state or pass on as gratuities.

This issue brief builds on my recent commentary on the settlement, earlier papers on state interchange-fee carveouts, and evidence on the effects of interchange regulation across jurisdictions.[7] It examines the settlement’s likely effects in greater detail, summarizes the likely effects of the carveouts, and compares the two interventions and their interactions.

The settlement’s net economic effect is almost certainly negative, but its social cost would likely be significantly lower than that of the state carveouts. It also achieves much of what the carveouts purport to achieve, while making them less effective on their own terms and more expensive to implement.

The settlement would directly reduce the fees many merchants pay by 0.1% of transaction value, with few, if any, compliance requirements. It would also reduce interchange revenue for card-issuing banks and credit unions, which would likely respond by raising other fees, reducing card benefits such as rewards, or both. Some merchants would likely introduce surcharges and steer customers toward cards with lower fees. Evidence suggests that most merchants would retain the savings from lower fees, while those that pass savings on to consumers would share only a small fraction.[8] Cardholders would thus face higher fees and fewer benefits, with largely unchanged prices.

The carveouts would allow merchants to reduce their fees, but most, if not all, would need to make substantial investments in payment-processing systems. For smaller merchants, the cost of systems that automatically exclude taxes and tips from interchange calculations may exceed the savings. Some might instead seek reimbursement by saving receipts and submitting them manually—a costly, error-prone process that would likely require additional auditing. Both approaches would add significant costs to payment processing, leading to higher fees, reduced investment elsewhere, or both.

The carveouts also assume that card issuers will process the exempt portion of each transaction for free. If issuers refuse, customers will have to pay taxes and tips by cash or check. As with the settlement, consumers would see little, if any, reduction in costs, while facing greater inconvenience. Smaller banks would also bear a disproportionate burden because of the high fixed costs of compliance.

The settlement would therefore deliver larger, guaranteed, and more evenly distributed fee reductions to merchants, with practically none of the merchant compliance costs associated with the carveouts. It would also allow merchants to surcharge up to 3% of transaction value, or their processing cost, whichever is lower. Merchants that surcharge could recover all their processing fees, including those attributable to sales taxes and tips.

Section II of this brief examines interchange fees’ role in the broader card-payments system. Section III describes the settlement’s core elements and implications for issuers and merchants. Section IV summarizes the state carveout laws’ aims, mechanics, and current legal status. Section V compares the settlement and carveouts, examines their interactions, and assesses their effects on three-party card systems, in which one company issues cards, serves merchants, and operates the network. Section VI concludes.

II. Interchange Fees and Merchant Payment Costs

Interchange fees help coordinate payment networks and balance participation by merchants and cardholders. This section explains how three- and four-party card systems perform those functions and how merchant pricing arrangements affect the pass-through of interchange reductions. These distinctions help explain why the settlement and state carveouts affect merchants differently and may shift transactions toward three-party systems, which fall outside both interventions

A. How Payment Card Systems Work

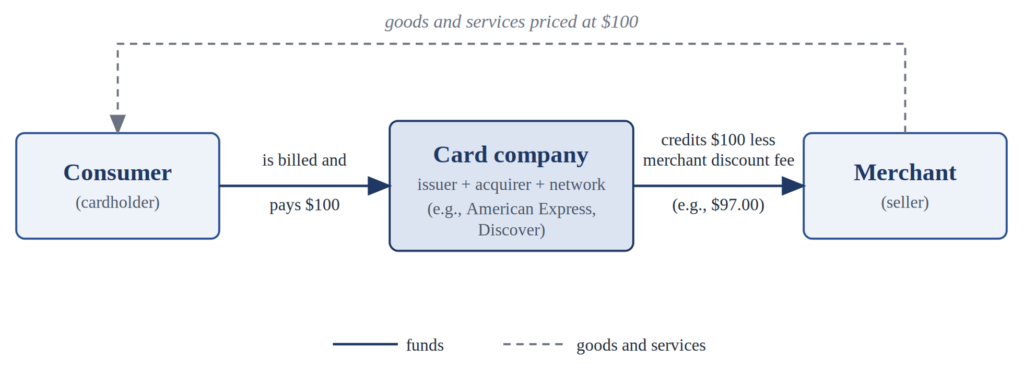
Payment cards in the United States operate under one of two architectures. In a three-party system, such as American Express or Discover, a single company performs all intermediary functions. It issues cards to consumers, acquires payments on merchants’ behalf, and operates the network that authorizes, clears, and settles transactions—approving payments, reconciling transaction details, and transferring funds.

FIGURE 1: Transactions in a Three-Party Card System

 SOURCE: Author’s illustration.

When a cardholder spends $100 at a merchant, the card company bills the cardholder, credits the merchant with $100 less a merchant discount fee, and retains that fee as compensation for its services (Figure 1). Because one firm serves both cardholders and merchants, it balances what cardholders receive against what merchants pay through its pricing on each side.[9]

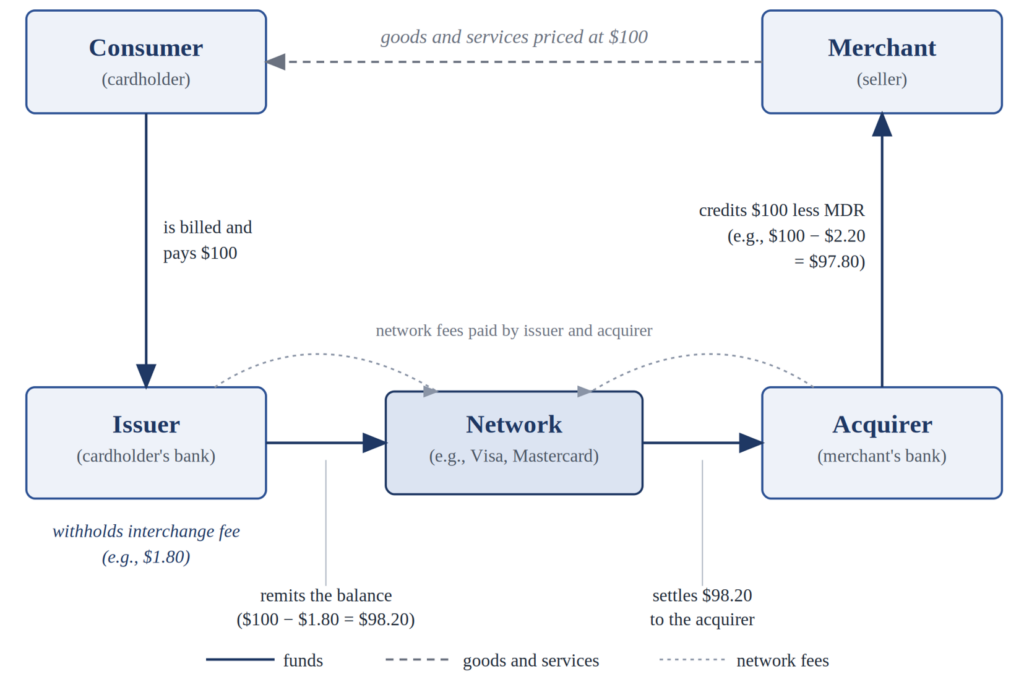
In a four-party system, separate financial institutions issue cards and acquire payments, connected by a network such as Visa or Mastercard (Figure 2). The cardholder’s bank (the issuer) bills the cardholder. The merchant’s bank (the acquirer) credits the merchant. The network carries the messages needed to authorize or decline, clear, and settle each transaction, charging fees to both banks.

FIGURE 2: Transactions in a Four-Party Card System

SOURCE: Author’s illustration.

When the issuer transfers funds to the acquirer, it withholds an interchange fee. With roughly 8,500 card-issuing institutions in the United States, bilateral negotiation of these fees would require millions of separate agreements. The networks instead set schedules of default interchange rates that apply unless the parties negotiate their own terms.[10]

The interchange fee typically amounts to between 1% and 2% of a transaction’s value. Treating it simply as compensation for processing a payment dramatically understates its role. It originated as a way to reduce coordination costs and align independent issuers’ and acquirers’ incentives within an open four-party payment network, as I explained in my Truth on the Market post:

A common misconception treats interchange as little more than compensation for processing a transaction. Its role is much broader. Interchange arose as a practical solution to a coordination problem in the original BankAmericard system and later became a way to balance the interests of merchants and consumers.

When BankAmericard, the forerunner of Visa, launched in 1958, it operated as a three-party network. Bank of America issued the cards, signed up merchants, and processed the transactions.

That changed when Bank of America began licensing other banks to issue BankAmericard cards in 1966. At first, the amount an acquiring bank paid to the issuing bank depended on the merchant discount the acquirer charged, or claimed to charge, sometimes adjusted for processing costs. The arrangement proved difficult to administer and audit.

Merchant discounts varied across banks and merchants, which gave acquirers an incentive to understate them. The formula also left acquirers with little or no margin on transactions involving cards issued by other banks. Issuers could receive too little, acquirers had weaker incentives to recruit and serve merchants, and the system encouraged strategic misreporting.

In 1970, Bank of America and its licensees created National BankAmericard Inc., an independent company owned by participating banks. The new organization replaced the uncertain formula with a uniform interchange reimbursement fee.

Set at 1.95% in 1971, the standardized fee separated the issuer’s payment from the merchant discount negotiated by the acquirer. The acquirer could retain the difference between the merchant discount and the interchange fee to cover its own costs.

Interchange therefore began as a way to align the incentives of independent issuers and acquirers in an open payment network. The Interbank Card Association, which operated MasterCharge, the precursor to Mastercard, adopted a similar approach about a year later. Economists later developed a fuller account of why the mechanism worked.[11]

Interchange continues to serve those functions. But arguably, its larger role today is to support subsidies between merchants and cardholders that encourage participation on both sides.

A card network creates value only if enough merchants and cardholders participate. As William F. Baxter showed in a seminal 1983 article, this often requires one side to subsidize the other.[12] Jean-Charles Rochet and Jean Tirole subsequently showed that when the two sides differ in their responsiveness to price, the fee structure that maximizes value typically involves the less price-sensitive side (usually merchants) subsidizing the more price-sensitive side (usually consumers).[13]

These analyses help explain why issuing banks use interchange revenue to fund cardholder benefits, including rewards, interest-free credit during the billing cycle, zero-liability fraud protection, and chargeback rights (the ability to dispute and reverse certain payments). That revenue also supports continuing investment in authorization, tokenization (the replacement of sensitive card details with secure identifiers), and fraud-detection infrastructure, all of which help secure card payments.

Three-party systems instead balance the two sides internally. They have no separate interchange fee because one institution performs all the functions. Instead, the merchant discount fee funds the subsidy. That fee is typically higher than the merchant discount rate acquirers charge in four-party networks.[14]

B. What Merchants Pay

Merchants receive the transaction amount from their acquirer, less a merchant discount fee calculated using the merchant discount rate (MDR). That fee typically covers interchange, the acquirer’s network fees, and its margin for processing, underwriting, and servicing the transaction. Interchange is by far the largest component, particularly for larger merchants, whose scale reduces the acquirer’s per-transaction margin.

How merchants pay these fees depends on their acquiring arrangement. Larger merchants typically use “interchange-plus” pricing, which transparently passes through the interchange component. Changes in interchange rates therefore flow directly into what the merchant pays.[15]

Smaller merchants often purchase card acceptance on a blended or flat-rate basis. The acquirer or payment processor charges the same all-in rate across multiple card types, despite differences in the interchange fees on individual transactions. Square, for example, lists a standard rate of 2.6% plus $0.15 for in-person card transactions across the major card brands. Square and Stripe also offer online payment products, for transactions in which the card is not physically present, at 2.9% plus $0.30.[16]

Under these arrangements, a change in interchange does not necessarily reach the merchant immediately or proportionately. It initially changes the processor’s margin and affects the merchant’s MDR only if and when the processor revises its blended price.

Both interventions this brief examines target four-party interchange fees exclusively. The settlement binds only Visa, Mastercard, and their issuers. The state carveout statutes address “interchange fees,” which exist as distinct fees only in four-party systems. American Express and Discover’s merchant discount fees therefore fall outside both the settlement and the carveouts.

Section V examines the implications of this asymmetry. In essence, policies that make four-party cards less attractive tend to shift transaction volume toward three-party cards, which have historically cost merchants more to accept.

III. The Settlement and Its Likely Effects

The proposed settlement would reduce interchange fees and give merchants more flexibility over card acceptance, surcharging, and steering. This section examines those changes, issuers’ likely responses to lost revenue, and the resulting effects on cardholder benefits, payment choices, and merchant costs. The rate relief would require no merchant action, but its broader effects would depend on how issuers, merchants, and consumers respond.

A. Fee Reductions and Merchant Flexibility

The settlement would make the following changes to interchange fees and card-network rules:[17]

  1. Visa and Mastercard would each reduce their combined volume-weighted average effective interchange rate on domestic credit transactions by at least 10 basis points—equivalent to 0.1% of transaction value—from the average for the year ending March 31, 2025. This measure weights rates by transaction volume. The reduction would last five years, with annual verification by an independent auditor. Merchants paying individually negotiated rates would receive a proportional reduction.
  2. The networks would cap all posted credit card interchange fees at their March 31, 2025 levels for five years.
  3. The networks would cap posted interchange fees on standard consumer credit cards at 1.25% for at least eight years, a reduction of 62 basis points from those products’ current average posted rate.
  4. The networks would replace the honor-all-cards rule with a rule allowing merchants to decline entire card categories—debit, standard consumer credit, premium consumer credit, and commercial.
  5. Merchants could surcharge at the brand or product level, up to their cost of acceptance or 3% of transaction value, whichever is lower.
  6. Merchants could expressly offer discounts and otherwise steer customers toward cards from particular issuers, supplementing existing brand- and product-level steering.
  7. Merchants could form buying groups to negotiate rates collectively.[18]

These provisions would take effect quickly. The surcharging changes would begin within 90 days of the Settlement Approval Date, and the rate reductions and caps within roughly four months, timed to the networks’ semiannual rule-release cycle.[19] The Settlement Approval Date turns on the district court’s entry of final judgment. Relief would therefore begin while appeals remain pending unless a court grants a stay.

B. Issuer Revenue and Responses

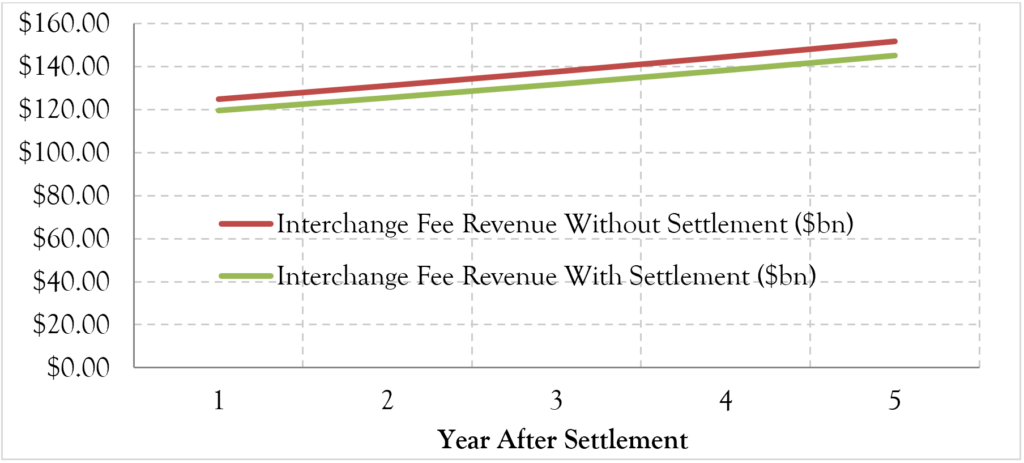
The proposed changes could significantly reduce issuer revenue. Current card-purchase volume, projections based on recent growth rates, and the settlement’s 10-basis-point reduction provide a starting estimate. Assuming card-purchase volume grows 5% annually, issuers would lose roughly $29 billion over five years, as Figure 3 shows.

The actual revenue loss would depend on how four-party issuers respond to lower interchange fees, how three-party issuers react, and how consumers respond to both. These adjustments would, in turn, prompt further changes in pricing and card use.

Interchange revenue helps fund rewards, introductory offers, fraud protection, and the fixed costs of maintaining card accounts. Four-party issuers would therefore likely recoup at least some lost revenue by reducing rewards, tightening eligibility for richer benefits, raising annual or other account fees, or combining these approaches.

Where regulation has reduced interchange revenue, issuers have responded by cutting costs or recovering income elsewhere. When Regulation II roughly halved the debit interchange retained by covered U.S. banks in 2011, debit rewards programs largely disappeared, free checking at those banks contracted sharply, and monthly maintenance fees and minimum-balance requirements rose. Lower-income customers bore a disproportionate share of that burden. Australian issuers responded to the Reserve Bank of Australia’s interchange standards by cutting rewards and raising annual fees by around 50%. The European Union’s (EU) Interchange Fee Regulation prompted similar adjustments.[20]

FIGURE 3: Effects of the Ten-Basis-Point Reduction on Interchange-Fee Revenue

If four-party issuers reduce benefits or raise annual fees, cardholders would likely use those cards somewhat less. That could alter competition with three-party networks such as American Express and Discover. Because the caps do not constrain three-party systems, they could preserve rewards and other benefits, or launch products with higher rewards. Cardholder demand could shift from Visa and Mastercard products toward three-party cards, even as merchants generally pay less to accept four-party cards.

Four-party issuers would anticipate these competitive effects. They might therefore absorb some losses or recover revenue through other charges, such as higher interest rates.

Their choices would ultimately depend on how sensitive different cardholders are to price. If cardholders who carry balances from month to month (revolvers) are less price-sensitive than those who pay in full (transactors), issuers would likely recover more of the loss from revolvers through higher interest charges. Similarly, less price-sensitive holders of ultrapremium cards might face disproportionately higher annual fees. The response would likely vary by card. Holders of airline co-branded cards, for example, might be less price-sensitive than holders of cashback cards, many of whom could switch to three-party cards offering higher rewards.

Merchants’ responses to the new acceptance, surcharging, and discounting rules would also affect issuer revenue, prompting further adjustments by networks and issuers. Merchants would likely surcharge where consumers would accept the added charge or switch to a payment method with lower processing costs. Surcharging would be less attractive where consumers would abandon the transaction or switch to a method that costs the merchant more to accept.

Australia’s experience broadly supports this expectation. After networks removed their no-surcharge rules, surcharging remained far from universal and concentrated among certain merchants and industries. The Reserve Bank of Australia identified airlines and taxis as sectors where unusually high surcharges persisted, and noted that higher surcharges were more common online, where customers generally could not pay cash.[21] In these settings, switching payment methods or abandoning a transaction may impose substantial costs on consumers, giving merchants more room to surcharge.

C. Merchant Steering and Acceptance Costs

By allowing surcharges that vary by card category and substantially reducing interchange fees on standard consumer cards, the settlement could help merchants steer consumers toward cards with lower interchange fees. That, at least, is the intention.[22]

But steering carries risks. Some consumers may switch to more expensive payment methods when merchants surcharge certain four-party cards. Uncertainty about surcharges may also prompt cardholders to use an alternative payment method preemptively.

If consumers choose lower-cost cards or other cheaper payment methods, merchants’ acceptance costs could fall. But consumers might instead choose more expensive three-party cards or cash, which also costs merchants more to accept.[23] Declining particular card categories therefore has an uncertain effect on acceptance costs. Some customers would also likely abandon the transaction altogether, potentially reducing merchant income.

Two other features of the settlement deserve attention before turning to the state laws. First, as Judge Cogan observed when granting preliminary approval, no court could have ordered the rate relief after trial because courts lack the power to set rates or regulate prices.[24] Merchants thus secured through settlement relief they could not have obtained at trial.

Second, merchants need take no action to receive the rate relief. The networks would implement the reductions and caps within their existing rate schedules, with an independent auditor verifying compliance at the defendants’ expense. Merchants would not need to buy equipment, alter checkout processes, or submit documentation.

IV. State Carveouts: Compliance Costs and Legal Limits

The IFPA prohibits issuers, networks, acquirers, and processors from receiving or charging interchange fees on the tax or gratuity portion of a transaction, provided the merchant transmits that information during authorization or settlement. Merchants that do not transmit the data in real time may instead submit tax documentation within 180 days and receive a credit from the issuer within 30 days. Financial institutions face a $1,000 civil penalty per transaction for violations. Merchants face no liability or penalty for inaccurate or fraudulent reimbursement requests.[25]

As I have described in earlier work, neither point-of-sale terminals nor network messaging standards currently distinguish the tax or tip component of a consumer transaction, largely because they have had no reason to do so. Systems operating identically in every state have always calculated interchange on the total transaction amount.[26] Implementing a carveout would therefore require one of three costly mechanisms:

  • Dual authorizations. Merchants could split each sale into exempt and nonexempt transactions, dramatically slowing checkout.
  • Additional transaction data. Merchants could transmit tax and tip data through Level 2 and Level 3 message fields, which carry more detailed transaction information. This would require terminal upgrades and reprogramming throughout the payment system. Single-message debit networks, which authorize and settle payments through one message, generally cannot process these fields.
  • Retrospective rebates. Merchants, acquirers, and issuers could maintain linked records of encrypted transaction data for seven months or more to support reimbursement requests. This approach would invite error and fraud.[27]

A significant share of these costs is fixed, placing a disproportionate burden on small and medium-sized merchants and small issuers. Evidence from comparable compliance regimes suggests that these costs can consume much or all of smaller firms’ gross savings. After South Dakota v. Wayfair, Inc. allowed states to require remote sellers to collect sales tax, the U.S. Government Accountability Office found that large businesses absorbed the change with minimal new setup costs, while smaller sellers faced a significant compliance burden. One small online seller spent about $2.25 on compliance for every $1 of tax collected.[28]

Other recent state proposals follow the IFPA’s basic design but differ in ways that compound the problem. For example, while the IFPA covers taxes and gratuities and applies to all issuers, Colorado’s vetoed S.B. 26-134 covered only taxes and exempted issuers with $60 billion or less in assets. That exemption would have excluded more than a third of debit cards and perhaps a quarter of credit cards issued nationwide, along with every card issued by a Colorado-domiciled institution. Merchants would have had to determine, card by card, whether the exemption applied.[29]

Delaware’s bill, meanwhile, addresses gratuities alone. If several such laws took effect, the payment system would face mutually inconsistent carveout standards, each requiring separate screening rules for every transaction processed nationwide.[30]

The IFPA’s legality—and, by extension, that of similar state carveouts—remains contested and precarious. In February 2026, the federal district court hearing the banking industry’s challenge declined to enjoin the IFPA’s interchange-fee provision, reasoning that networks, rather than banks, set the fees.[31]

In April, the Office of the Comptroller of the Currency issued an interim final order finding that federal law preempts the IFPA for national banks and federal savings associations. It also issued an interim final rule confirming that banks’ authority to charge fees extends to fees set by third parties. Following those actions, the 7th U.S. Circuit Court of Appeals vacated the district court’s judgment. On remand, the district court permanently enjoined the interchange-fee provision as applied to national banks, federal savings associations, out-of-state state banks, and payment-card networks.[32]

The National Credit Union Administration then issued a similar rule for federal credit unions, and the district court recently expanded its injunction to cover them as well.[33] Illinois subsequently deferred the IFPA’s effective date a second time, to July 1, 2027.[34]

Unless courts overturn the federal regulators’ actions, the IFPA and similar laws will bind only institutions chartered by the enacting state, which issue a small fraction of cards in circulation. The analysis that follows assumes, for the sake of argument, that the carveouts could take effect at full scope, although that outcome appears unlikely.

V. Comparing the Settlement and State Carveouts

Both the settlement and state carveouts aim to lower merchants’ card-acceptance costs. This section compares their likely savings and compliance burdens, then examines how the settlement could further reduce carveout benefits, shift costs toward consumers and local issuers, and complicate implementation. It also considers how surcharging could make carveouts redundant for some merchants and how both interventions could shift transactions toward more expensive three-party cards.

A. Merchant Savings and Compliance Costs

The settlement would reduce merchant acceptance costs directly. The 10-basis-point reduction in average effective interchange equals 0.1% of covered credit card sales and applies automatically across merchants in every state, on the entire transaction amount. For merchants on interchange-plus pricing, the reduction would pass through to the MDR immediately. The settlement expressly provides a proportional reduction for merchants paying negotiated rates. Even many merchants on blended pricing could expect a share over time, as acquirers compete for their business and pass through a durable, independently verified reduction in their largest input cost.[35]

The carveouts promise savings of a similar magnitude. In earlier work, I estimated the IFPA’s gross savings to merchants at roughly 0.1% of the sale amount, reflecting an average combined Illinois sales tax of about 8.86%, gratuities on some transactions, and prevailing interchange rates.[36] The settlement’s average rate reduction is comparable, but merchants need no particular acquiring arrangement to qualify. They need not transmit tax data, buy new terminals or software, or submit rebate claims within a 180-day documentation window. The settlement also covers transactions on cards issued by institutions beyond the state statute’s reach.

The IFPA and similar carveouts would therefore deliver considerably smaller net fee reductions than the settlement. Moreover, once the settlement takes effect, lower interchange rates would further reduce the amounts available through carveouts.

Even at pre-settlement rates, most smaller merchants would see little, if any, net savings from a carveout. Fixed costs for upgraded terminals, software integration, and recordkeeping—or the administrative burden of rebate claims—would absorb much or all of the gross benefit. Merchants on blended pricing might receive no gross benefit at all.[37]

Reducing the gross benefit by a third or more would further narrow the group of merchants for whom a carveout’s benefits exceed its costs. The remaining beneficiaries would principally be the largest retailers, which already spread compliance costs across a large volume of transactions and stood to gain the most from carveouts. Before the settlement, just 10 national chains would receive more than one-fifth of the IFPA’s projected savings.[38] The settlement would intensify that concentration, making the carveout an even more pronounced subsidy to big-box retailers financed by consumers, smaller merchants, and local financial institutions.

The settlement would also give merchants concerned about high-fee cards more options. Under its terms, they could decline premium and commercial cards outright, surcharge them, or offer discounts to steer customers toward cheaper products. Indeed, merchants could surcharge their full processing cost, up to 3% of transaction value.

Merchants using that tool could recover far more than the IFPA or similar carveouts would offer, making the carveouts redundant for them. As discussed below, when a surcharge equals or exceeds the amount a merchant could recover under a state carveout, the merchant’s recovery weakens the rationale for that carveout.

B. Shifting Costs to Consumers and Local Issuers

National issuers could respond to a state carveout by seeking adjustments to interchange schedules that spread the loss across merchants nationwide. The settlement, however, largely forecloses that response. It freezes posted rates, caps standard consumer rates, and requires the average effective rate to remain 10 basis points below the benchmark, subject to annual audit.[39] For at least five years, issuers or networks would therefore find it difficult, if not impossible, to lawfully offset carveout losses by adjusting interchange schedules.

Consumers would bear the carveout’s costs more directly through reduced rewards and higher fees. Those costs would reach consumers both inside and outside the enacting state because national issuers adjust terms nationally rather than maintain state-specific rewards schedules.[40] Indeed, most affected consumers would live outside the state, making the effects predominantly extraterritorial.

Local banks and credit unions that remain within the statutes’ reach after the preemption rulings would face a different constraint. They could neither offset the lost revenue through the frozen interchange schedules nor spread it across a national portfolio. The loss would come on top of settlement-driven reductions in their card-program revenue.

The settlement therefore changes who bears a carveout’s costs, making the distribution of those costs worse. A state considering a carveout would still impose diffuse harms on consumers, while concentrating institutional losses on the banks and credit unions its charter system exists to serve.

C. How Carveouts Could Reduce Settlement Relief Elsewhere

The settlement measures the average effective interchange rate by dividing the network-set default interchange fees actually assessed on domestic credit transactions by the corresponding sales volume.[41] A state carveout that eliminates interchange on taxes and tips reduces the fees assessed without reducing sales volume, lowering the measured national average.

Mechanically, that reduction would count toward the 10-basis-point reduction the networks owe the merchant class. The networks could then provide correspondingly less rate relief to merchants in the other 49 states. A state enacting a carveout would thus finance part of its local experiment through settlement relief owed to merchants elsewhere.

Whether the independent auditor would treat statutory exclusions this way remains an open question. The agreement addresses individually negotiated reductions but says nothing about state-mandated ones. Either approach creates problems. If statutory exclusions count, carveout states would draw on the class’s recovery to fund their own mandates. If they do not, the networks and auditor would need another layer of state-specific accounting to exclude them from the calculation.

D. Surcharging and the Case for Carveouts

The settlement permits merchants to surcharge at the brand or product level up to their cost of acceptance or 3% of transaction value, whichever is lower.[42] A merchant that recovers its full acceptance cost through a surcharge also recovers interchange on the entire transaction, including taxes and gratuities. For that merchant, a carveout offers no further recovery. Full-cost surcharging therefore removes the basis for that merchant’s argument for a state carveout.

The same reasoning applies, to a lesser extent, to merchants that decline premium and commercial cards or offer discounts to steer customers toward standard cards. Those choices eliminate or reduce the fees from which a carveout would provide a partial exemption.

The remaining benefit of carveouts would therefore accrue principally to merchants that forgo the settlement’s self-help options. The principal reason to do so would be to preserve fast, efficient checkout with minimal risk that customers abandon transactions. That preference would appear to conflict with seeking a carveout that would make payment processing more cumbersome.

E. Competing Implementation Demands

After the settlement’s final approval, networks, acquirers, processors, and issuers will have to undertake substantial changes to their systems on a court-supervised schedule. These include identifying premium and commercial cards at checkout, implementing three-tier acceptance, building surcharge notification and reporting systems, and supplying the data the independent auditor requires.[43]

This work would use the same messaging standards, processing systems, and semiannual release cycles needed to implement carveouts. The IFPA’s scheduled July 1, 2027, effective date falls squarely within the settlement’s rollout.[44] Implementing a carveout during that period would compete for engineering capacity with obligations the industry must meet under a federal court order, potentially increasing costs, delays, and errors for both.

The industry would also need to check every acceptance category, surcharge configuration, and rate schedule introduced by the settlement against each state’s carveout rules, and vice versa. These interaction costs did not exist when lawmakers drafted the carveout bills, and none of the states’ fiscal notes—their estimates of legislation’s budgetary effects—accounts for them.

F. Shifting Transactions to Three-Party Systems

Neither the settlement nor the carveouts apply to three-party systems. American Express and Discover remain free to fund rewards and benefits at whatever level their internal pricing supports. As Visa and Mastercard issuers respond to lower interchange revenue by trimming rewards and raising fees, three-party companies could attract premium cardholders by offering benefits no longer available on four-party cards.

Australia’s experience is instructive. After the Reserve Bank of Australia’s price controls reduced four-party interchange in 2003, banks shifted premium customers toward American Express companion cards—that is, cards offered alongside their Visa or Mastercard products. American Express’s market share rose by about 25% before the regulator extended its standards to cover the arrangement.[45]

Carveouts share this asymmetry and add further friction. The compliance mechanisms described in Section IV, including dual authorizations and expanded transaction messages, would apply only to four-party transactions, making them slower and more prone to checkout failures than unchanged three-party transactions. Merchants using dual authorizations, in particular, should expect greater use of American Express and Discover cards, alongside some shift back to cash.

These consequences undermine both interventions’ aims, especially those of the carveouts. First, migration toward three-party cards would erode merchant savings because those cards cost more to accept. Second, each transaction that shifts to a three-party card would fall outside the carveout, further reducing the law’s already-diminished benefits while leaving its fixed costs unchanged. Third, local banks and credit unions still subject to a carveout after the preemption rulings would lose card volume to three-party competitors, on top of the revenue the statute removes directly.

Consumers who qualify for three-party products could retain rewards, partially offsetting their losses. But that benefit would come with the costs and inconvenience of maintaining additional cards, and would reach only eligible customers. A law that steers transactions toward the most expensive card-acceptance channel would be a strange way to lower merchants’ acceptance costs.

VI. Conclusion

State interchange carveouts arose from merchants’ objection to paying fees on amounts they collect for the state or pass on as gratuities, with no relief in prospect from Congress or the courts. The proposed settlement substantially weakens that rationale. It would reduce interchange across covered transactions nationwide by roughly the same share of sales that carveouts promised in their best case, without imposing merchant compliance costs. Pass-through would depend on merchants’ pricing arrangements, but the settlement would also give them more ways to recover acceptance costs through surcharging and steering.

A carveout would add only a diminished exemption from an already-reduced fee. Merchants would need to incur fixed costs that the settlement makes harder to recover, and relief would reach only cards issued by the shrinking set of institutions left within the statutes’ scope after federal preemption.

The carveouts’ costs would remain and, in several respects, grow. If courts ultimately reject federal preemption, national issuers would spread much of the burden to out-of-state consumers through reduced rewards and changed account terms. Out-of-state merchants could also face lower demand and potentially less settlement relief. If preemption holds, losses would concentrate on local banks and credit unions and their customers.

In either case, small and medium-sized merchants in the enacting state would face compliance costs that could exceed their savings. Many would likely forgo the carveout, further weakening their position relative to larger competitors. Implementation would also compete with the settlement’s court-supervised rollout, while slower four-party transactions and reduced cardholder benefits could shift spending toward more expensive three-party cards.

The settlement itself would likely impose net economic costs, particularly through reduced cardholder benefits and higher fees. Its comparatively lower compliance burden nonetheless makes the case for additional state carveouts weaker.

States seeking to reduce merchants’ tax-collection costs have a more direct tool in the form of capped compensation for electronic remittance, of the kind most states already provide.[46] Requiring a national payment system to administer a local subsidy would add costs and distortions while delivering increasingly narrow benefits. Illinois should repeal its carveout, and other states should abandon similar proposals, regardless of whether the settlement receives final approval.

[1] Memorandum Decision and Order, In re Payment Card Interchange Fee & Merch. Disc. Antitrust Litig., No. 05-md-1720 (BMC) (E.D.N.Y. June 9, 2026) [hereinafter Preliminary Approval Order].

[2] Id. at 6–10; Visa Inc., Current Report (Form 8-K) (Nov. 10, 2025) (attaching Superseding and Amended Definitive Class Settlement Agreement of the Rule 23(b)(2) Class Plaintiffs [hereinafter Settlement Agreement]); Nandita Krishnaswamy, In re Payment Card Interchange Fee and Merchant Discount Antitrust Litigation: Summary of the November 2025 Proposed Settlement, ABA Antitrust L. Sec. (Apr. 1, 2026), https://www.americanbar.org/groups/antitrust_law/resources/newsletters/in-re-payment-card-interchange-fee-merchant-discount-antitrust-litigation.

[3] See Ill. Bankers Ass’n v. Raoul, No. 1:24-cv-07307, slip op. at 2–4, 27–28 (N.D. Ill. June 1, 2026); see also 815 Ill. Comp. Stat. 151/150-1, 151/999-99 (2026) (effective July 1, 2027).

[4] Interchange Fee Prohibition Act, 815 Ill. Comp. Stat. 151/150-1 et seq. (2024).

[5] Colorado Bill To Cut Sales Tax from Interchange Calculation Vetoed, Digital Transactions (June 2026), https://www.digitaltransactions.net/colorado-bill-to-cut-sales-tax-from-interchange-calculation-vetoed; S.B. 26-134, 2026 Reg. Sess. (Colo. 2026).

[6] Patrick Cooley, State Interchange Fee Laws Progress, Payments Dive (Mar. 18, 2026), https://www.paymentsdive.com/news/state-interchange-fee-laws-progress/815072; Gail Cole, Can States Ban Swipe Fees on Taxes and Fees?, Avalara (May 2026), https://www.avalara.com/blog/en/north-america/2026/05/states-ban-swipe-fees-on-taxes-and-fees.html.

[7] Julian Morris, The Price of Peace in the Swipe-Fee Wars, Truth on the Mkt. (July 23, 2026), https://truthonthemarket.com/2026/07/23/the-price-of-peace-in-the-swipe-fee-wars [hereinafter Morris, Price of Peace]; Julian Morris, State Regulation of Interchange Fees (Int’l Ctr. L. & Econ., Nov. 15, 2024), https://laweconcenter.org/resources/state-regulation-of-interchange-fees [hereinafter Morris, State Regulation]; Julian Morris & Ben Sperry, Regulating State Interchange Fees: Evaluating the Likely Effects of the IFPA 8 (Int’l Ctr. L. & Econ., July 7, 2025), https://laweconcenter.org/wp-content/uploads/2025/07/IFPA-Paper-2025.pdf [hereinafter Morris & Sperry, IFPA].

[8] See Julian Morris, Todd J. Zywicki & Geoffrey A. Manne, The Effects of Price Controls on Payment-Card Interchange Fees: A Review and Update 24–27 (Int’l Ctr. L. & Econ., White Paper, Mar. 4, 2022), https://laweconcenter.org/wp-content/uploads/2022/03/Payments-2021-Lit-Review.pdf; Todd J. Zywicki, Ben Sperry & Julian Morris, Credit Cards and the Reverse Robin Hood Fallacy: Do Credit Card Rewards Really Steal from the Poor and Give to the Rich? 14–16 (Int’l Ctr. L. & Econ., Issue Brief, Nov. 4, 2021); Zhu Wang, Scarlett Schwartz & Neil Mitchell, The Impact of the Durbin Amendment on Merchants: A Survey Study, 100 Econ. Q. 183, 189, 198–200 (2014); Vladimir Mukharlyamov & Natasha Sarin, Price Regulation in Two-Sided Markets: Empirical Evidence from Debit Cards, 172 J. Fin. Econ. 104094, 10–11, 15–16 (2025), https://doi.org/10.1016/j.jfineco.2025.104094.

[9] Morris, State Regulation, supra note 7, at 6 (describing three-party networks, in which the card company acts as issuer, acquirer, and network operator, subsidizing cardholders directly through fees charged to merchants).

[10] Id. at 7–9. The number of bilateral agreements required among n institutions is n(n − 1)/2.

[11] Morris, Price of Peace, supra note 7.

[12] See William F. Baxter, Bank Interchange of Transactional Paper: Legal and Economic Perspectives, 26 J.L. & Econ. 541 (1983).

[13] Jean-Charles Rochet & Jean Tirole, Cooperation Among Competitors: Some Economics of Payment Card Associations, 33 RAND J. Econ. 549 (2002); Jean-Charles Rochet & Jean Tirole, Platform Competition in Two-Sided Markets, 1 J. Eur. Econ. Ass’n 990 (2003); Todd J. Zywicki, The Economics of Payment Card Interchange Fees and the Limits of Regulation (Int’l Ctr. L. & Econ., June 2, 2010), https://laweconcenter.org/images/articles/zywicki_interchange.pdf; Ohio v. Am. Express Co., 585 U.S. 529, 545 (2018).

[14] Jack Caporal, Average Credit Card Processing Fees and Costs in America, Motley Fool Money (updated June 23, 2026), https://www.fool.com/money/research/average-credit-card-processing-fees-costs-america (reporting Helcim’s 2026 weighted effective rates).

[15] Morris, State Regulation, supra note 7, at 9–10 (describing interchange-plus and blended acquirer pricing); Morris & Sperry, IFPA, supra note 7, at 14–18.

[16] Understanding Our Fees, Square, https://squareup.com/us/en/payments/our-fees (last visited Aug. 9, 2026) (listing standard processing fees of 2.6% plus $0.15 for card-present transactions and 2.9% plus $0.30 for online transactions using Square’s API); Pricing, Stripe, https://stripe.com/pricing (last visited Aug. 9, 2026) (listing standard U.S. pricing of 2.9% plus $0.30 per successful transaction for domestic cards).

[17] Settlement Agreement, supra note 2, ¶¶ 48–53; Preliminary Approval Order, supra note 1, at 9–10.

[18] Settlement Agreement, supra note 2, ¶¶ 39–47; Preliminary Approval Order, supra note 1, at 6–9. A group must include at least two merchants, incorporate as a U.S. nonprofit, and comply with applicable antitrust standards. Groups may submit proposals concerning interchange rates and rate categories, merchant rules and fees, acceptance, surcharging, and other network practices. Visa and Mastercard must consider qualifying proposals in good faith and engage in reasonable, bona fide negotiations when a proposal offers commercially reasonable benefits. They need not agree to the rates the group seeks.

[19] Settlement Agreement, supra note 2, ¶¶ 39, 48(a).

[20] Morris, Zywicki & Manne, supra note 8; Todd J. Zywicki, Geoffrey A. Manne & Julian Morris, Unreasonable and Disproportionate: How the Durbin Amendment Harms Poorer Americans and Small Businesses (Int’l Ctr. L. & Econ., Apr. 2017), https://laweconcenter.org/wp-content/uploads/2017/08/icle-durbin_update_2017_final-1.pdf.

[21] Reserve Bank of Austl., Regulatory Developments in Retail Payments, in Payments System Board Annual Report 2012 (2012) (reporting that approximately 36% of surveyed merchants imposed a surcharge on at least one accepted credit card and that very large merchants surcharged more often); Reserve Bank of Austl., The Payments System (Supplementary Submission to the Financial System Inquiry, Aug. 2014) (observing that market forces ordinarily constrain excessive surcharging because merchants consider its effect on the customer experience, while identifying the taxi and air-travel industries as exceptions); Cameron Dark, Chay Fisher, Kim McBey & Ed Tellez, Payment Surcharges: Economics, Regulation and Enforcement, Reserve Bank of Austl. Bull., Dec. 2018 (identifying airlines as a prominent source of excessive surcharging and noting reports of higher surcharges more often for online transactions, where customers generally could not pay cash); Reserve Bank of Austl., Excessive Surcharging, in Review of Card Payments Regulation: Conclusions Paper (May 2016) (discussing $7–$8 fixed-dollar airline surcharges and explaining why they could substantially exceed acceptance costs on low-value airfares).

[22] Preliminary Approval Order, supra note 1, at 9–10.

[23] Julian Morris & Ben Sperry, The Cost of Payments: A Review (Int’l Ctr. L. & Econ., Aug. 2024), https://laweconcenter.org/resources/the-cost-of-payments-a-review.

[24] Preliminary Approval Order, supra note 1, at 22 (citing Prentis v. Atl. Coast Line Co., 211 U.S. 210, 226 (1908)); Settlement Agreement, supra note 2, ¶¶ 48, 52–53 (Independent Auditor provisions).

[25] 815 Ill. Comp. Stat. 151/150-10, 151/150-15 (2024).

[26] Morris, State Regulation, supra note 7, at 16–21; Morris & Sperry, IFPA, supra note 7, at 14–18.

[27] Morris, State Regulation, supra note 7, at 17–21.

[28] Morris & Sperry, IFPA, supra note 7, at 16 (citing U.S. Gov’t Accountability Off., GAO-23-105359, Remote Sales Tax: Federal Legislation Could Resolve Some Uncertainties and Improve Overall System (2022)); South Dakota v. Wayfair, Inc., 585 U.S. 162 (2018).

[29] S.B. 26-134, 2026 Reg. Sess. (Colo. 2026); Bd. of Governors of the Fed. Rsrv. Sys., 2023 Interchange Fee Revenue, Covered Issuer Costs, and Covered Issuer and Merchant Fraud Losses Related to Debit Card Transactions (2023).

[30] See Morris & Sperry, IFPA, supra note 7, at 20–21 (discussing how differing state mandates could fragment the multilateral interchange-fee system).

[31] Ill. Bankers Ass’n v. Raoul, No. 1:24-cv-07307 (N.D. Ill. Feb. 10, 2026).

[32] Ill. Bankers Ass’n v. Raoul, Nos. 26-1354, 26-1371, 26-1440 & 26-1441 (7th Cir. May 8, 2026) (order vacating and remanding); Illinois Interchange Fee Law Maxes Out After Permanent Injunction and Legislative Postponement, Glob. Fintech & Digit. Assets Blog (June 2026), https://www.fintechanddigitalassets.com/2026/06/illinois-interchange-fee-law-maxes-out-after-permanent-injunction-and-legislative-postponement [hereinafter Illinois Interchange Fee Law Maxes Out].

[33] Order Preempting the Illinois Interchange Fee Prohibition Act, 91 Fed. Reg. 23,150 (Apr. 29, 2026); Preemption—Federal Credit Union Non-Interest Charges and Fees, 91 Fed. Reg. 34,725 (June 9, 2026).

[34]  815 Ill. Comp. Stat. 151/999-99 (2026) (deferring the effective date to July 1, 2027); see also Illinois Interchange Fee Law Maxes Out, supra note 32.

[35] On acquirers’ pass-through of interchange reductions, see Morris, Zywicki & Manne, supra note 8, at 31–38.

[36] Morris & Sperry, IFPA, supra note 7, at 18 & n.65.

[37] Morris, State Regulation, supra note 7, at 9–10, 22–23; Morris & Sperry, IFPA, supra note 7, at 14–18.

[38] Elec. Payments Coal., New Illinois Law Creates Windfall for Largest Corporate Mega-Stores (2024), https://guardyourcard.com/wp-content/uploads/2024/10/Illinois-State-Sales-Tax-Interchange-Report-9.24.24.pdf.

[39] Settlement Agreement, supra note 2, ¶¶ 48, 51–52.

[40] Morris & Sperry, IFPA, supra note 7, at 19–21.

[41] Settlement Agreement, supra note 2 (defining “Effective Interchange Rate” as network-set default interchange fees assessed to acquirers, divided by the sales volume of the corresponding transactions).

[42] Id. ¶¶ 39–41.

[43] Id. ¶¶ 39–42, 48, 51–53; Preliminary Approval Order, supra note 1, at 7 & n.7.

[44] Illinois Interchange Fee Law Maxes Out, supra note 32.

[45] Morris, Zywicki & Manne, supra note 8 (reviewing the Australian evidence, including the companion-card episode).

[46] Morris, State Regulation, supra note 7, at 26–27.

ICLE Issue Brief

The Permission Layer: Clearing the Way for AI-Era Broadband

Executive Summary AI and other next-generation technologies require more than data centers, computing power, and electricity. They also depend on communications networks installed underground, strung . . .

Executive Summary

AI and other next-generation technologies require more than data centers, computing power, and electricity. They also depend on communications networks installed underground, strung across utility poles, and built through corridors controlled by federal, state, local, and private gatekeepers.

Broadband networks require large upfront investments that providers may never recover if demand, technology, or regulation changes. They also create social benefits that providers cannot fully capture. Search, negotiation, permitting, and enforcement costs can therefore make valuable projects uneconomic, especially in rural and underserved communities.

Permitting compounds these risks. A single route may require federal reviews, state highway approvals, local permits or franchises, private crossing agreements, and access to thousands of poles. Each gatekeeper controls part of the project, but none bears its cumulative cost. Uncertain delays can matter more than fees because they postpone revenue, shorten an asset’s useful life, and create opportunities for hold-up.

Reform should make approvals faster and more predictable while preserving legitimate environmental, cultural, public-safety, and land-management interests. Policymakers should streamline federal reviews, impose firm shot clocks with deemed-granted remedies, limit fees to reasonable government costs, modernize cable franchising, and strengthen pole-access and cost-allocation rules. One-touch make-ready and dig-once policies can further reduce construction costs.

Recent agency actions and court decisions advance many of these goals, but future officials or courts could reverse them. Congress should codify their durable core. Stable rules would reduce investment risk across all projects and deliver the greatest gains where deployment remains hardest to finance.

I.               Introduction

Previous papers in this series have argued that technological leadership depends less on who invents the next breakthrough than on which jurisdictions build the full, low-friction infrastructure stack—spectrum, broadband, fiber, satellite, edge computing, data centers, and AI accelerators—that allows innovation ecosystems to form, cluster, and endure.[1] At its foundation, AI still relies on physical communications networks buried underground and strung along utility poles. But before providers can bury cable or mount an antenna, they must secure a web of permits and regulatory approvals.[2]

Broadband networks must cross land controlled by federal, state, and local authorities. Deployment typically requires zoning approvals, construction permits, and permission to occupy public rights-of-way.[3] When permitting is slow, inconsistent, or costly—or access to rights-of-way is delayed or priced unpredictably—deployment becomes more expensive and risky. Those barriers also postpone the point at which providers can begin recovering their investments.[4]

Access barriers can constrain new construction as much as a lack of funding. Even a provider ready to invest cannot build without timely, reasonably priced access to the corridors its network must follow.[5] Streamlined permitting and fair, predictable access to public rights-of-way will therefore help determine where—and how quickly—the infrastructure needed for next-generation applications gets built.

II.             The Broadband Investment Challenge

Debate over the infrastructure needed for artificial intelligence (AI) has focused largely on the data centers where models are trained and run and the electricity required to power them.[6] That focus is understandable. The scale of modern computing has strained electrical grids, renewed interest in additional generating capacity, and made data-center siting a major political issue.

Compute and electricity are, however, only part of the infrastructure these technologies require. AI and the immersive applications built on it cannot operate in isolation inside server farms.[7] They must exchange data with users and devices in real time, wherever those users happen to be. That requires high-capacity, low-latency communications networks capable of carrying large volumes of data with minimal delay. AI, augmented reality (AR), and virtual reality (VR) will therefore require substantial investment in broadband and related communications infrastructure.[8]

Broadband investment is not assured. Networks require large upfront expenditures that providers cannot recover once committed to a particular route or technology. Providers also capture only part of the social value their networks create. Search, negotiation, permitting, and enforcement costs can therefore make socially valuable projects uneconomic, while control over a single segment can give one gatekeeper the power to hold up an entire build.

Providers must invest amid uncertain demand, technological change, and regulatory risk. The prospect of obsolescence or new rules that reduce returns raises financing costs and discourages marginal projects, especially in rural and low-income communities. The following subsections examine these constraints and explain why predictable rules and well-designed incentives are essential to broadband deployment.

A.             The Economics of Broadband Investment

Broadband providers face significant barriers to entering and expanding within a market.[9] Chief among them are the high fixed costs that providers must incur before serving a single customer.[10] Recovering those costs depends on attracting enough subscribers, an uncertain prospect in a competitive market.[11]

Much of that investment also becomes a sunk cost—an expense that cannot be recovered if the project fails. Providers cannot easily remove fiber from an unsuccessful build and redeploy it elsewhere. They cannot recover the labor and regulatory costs at all. If subscriptions fall short, providers have few ways to limit their losses.

Economies of scale can offset these risks.[12] A provider can spread a network’s fixed costs across a larger customer base, while customers with a greater willingness and ability to pay can support higher revenue. Projects serving large or relatively affluent populations therefore tend to carry less risk than projects in rural or low-income communities.

Competition across different kinds of technologies, often called intermodal competition, adds another layer of uncertainty. Broadband markets once allowed one or two providers to capture large shares because consumers had few alternatives. Today, providers using different technologies compete across price, speed, reliability, coverage, and other dimensions.[13]

Home broadband may reach consumers through coaxial cable, fiber optics, fixed wireless service delivered over mobile networks, or low-Earth-orbit (LEO) satellites. Mobile broadband can offer enough capacity and performance for some consumers to forgo a fixed home connection altogether. At the same time, traditionally fixed providers have added mobile services so customers can remain connected outside the home. Because these technologies have different costs and infrastructure needs, multiple competing networks may prove more efficient than a single set of pipes.[14]

Competition and deployment both depend on continued network investment. In a competitive capital market, investment flows toward projects whose expected return, adjusted for risk, exceeds their cost.[15] Broadband providers calculate that return primarily from monthly subscription fees, supplemented by advertising and ancillary services.[16]

Broadband also creates substantial value that providers cannot capture through those revenue streams.[17] These spillover benefits—known as positive externalities—reach millions of people and many sectors, while providers bear the concentrated cost of deployment. A project is socially worthwhile when its private revenue and broader social benefits together exceed its cost.[18] Yet a rational provider will not build if its own expected revenue cannot cover that cost. It cannot charge for every increase in a farmhouse’s value, improvement in a student’s grades, or savings in a rural hospital’s budget.

Communities lose those benefits when broadband investment falls short. Real-estate prices can help measure broadband’s value because they incorporate local access to education, health care, employment, and other amenities.

Students without reliable home internet perform worse on standardized tests than their connected peers, which can reduce college enrollment and degree attainment.[19] Telemedicine can lower patients’ costs and make rural living practical for more people. It also helps rural health care facilities reach more patients and connect with specialists at major medical centers without employing them full time. Patients, in turn, can obtain care without traveling to a facility. Broadband also allows higher-earning remote workers to move to lower-cost rural areas, bringing income and spending into those communities.

These positive externalities create an underinvestment problem. Because providers cannot capture broadband’s full social value, expected private returns may not justify deployment even when a project would benefit society overall.[20]

AI, AR, and VR will intensify that problem. These technologies require high-capacity connections with minimal delay, reliable fiber links connecting local networks to the broader internet, processing located closer to users, and access to large-scale computing resources. Many applications must run AI models and exchange data continuously in real time, placing simultaneous demands on communications networks.

The benefits of these applications will extend far beyond what any one provider can monetize. Without policies that encourage investment, the communities least likely to attract private capital may also lack the infrastructure that AI, AR, and VR require. That outcome would widen the gap between served and unserved regions just as advanced connectivity becomes more important to economic competitiveness. Policymakers seeking broadband’s broader benefits must therefore give providers stronger incentives to invest in unserved and underserved areas.

B.             Transaction Costs and the Broadband Holdout Problem

In a world without transaction costs, parties would bargain toward an efficient allocation of resources regardless of who initially held the relevant property rights.[21] Applied to broadband, this principle suggests that a fiber provider will secure access to a utility pole, strip of land, or railroad crossing whenever it values that access more than the owner values excluding it. The parties will strike a deal, and the network will get built.

In practice, transaction costs—the costs of identifying the right parties, negotiating an agreement, and enforcing it—can make broadband deployment prohibitively expensive. These costs generally take three forms:

  • Search and information costs. Providers must identify who owns or controls each asset along a proposed route. That may require researching the ownership of thousands of utility poles divided among electric utilities and legacy telephone companies, tracing easements across private land, or determining which government agency controls a particular right-of-way.
  • Bargaining and decision costs. Providers incur legal fees, administrative expenses, and delays while negotiating access. A single project may require agreements with municipalities, private landowners, homeowners associations, and railroads, each subject to different legal requirements and each able to demand payment for its consent.
  • Policing and enforcement costs. Providers must monitor compliance and enforce their contractual and legal rights. These costs include policing pole-attachment agreements, protecting easement boundaries against encroachment, and litigating disputes over “fair and reasonable” rates.

Asset specificity can magnify each of these costs. The term describes investments tailored to a particular project that cannot easily be redirected elsewhere. Suppose a provider plans a 10-mile fiber route and obtains every approval except the one needed for the final mile. The owner controlling that segment can threaten the entire project and demand a payment far above the value of the access itself. The provider must either pay, redesign the route, or abandon investments already made along the other 9 miles.

For communications networks, transaction costs can exceed the price of the equipment itself. A mile of fiber-optic cable containing 144 strands costs roughly $5,000 to $8,000.[22] Make-ready work—the work needed to prepare a utility pole for a new attachment—can cost $600 to $6,000 per pole. Replacing a pole that cannot accommodate another attachment can cost $5,000 to $15,000.[23] Permitting and access to public rights-of-way can add $20,000 to $40,000 per mile, while railroad-crossing fees can make an otherwise viable project uneconomic.[24] Major projects also require substantial spending on construction crews, traffic control, and coordination among the parties working in public rights-of-way.

Costs accumulate when many parties hold vetoes over a single linear project and each seeks the greatest possible payment for its approval. Each gatekeeper considers the value of its own permission, not the cumulative burden on the network. The result resembles a linear anticommons—a project that requires consent from a long chain of independent parties, any one of which can block it.

These pressures can also push providers toward technologies that are less suitable for a particular community but easier to deploy. A fixed wireless project, for example, may require one tower-site approval, while a fiber build may require permission to attach equipment to 5,000 poles. Avoiding that chain of approvals can determine the technology a provider chooses, even if another option would deliver better service to consumers.

Government policy can raise or lower these transaction costs. When regulators can change rules abruptly or apply them subjectively, providers must account for the risk of an unfavorable policy shift.[25] That uncertainty weighs especially heavily on broadband projects because they require large upfront investments, take years to repay, and consist largely of sunk costs.[26]

A decision by the Federal Communications Commission (FCC) to subject broadband to common-carrier, utility-style regulation could reduce the expected return on an existing investment. So could changes by the National Telecommunications and Information Administration (NTIA) that tighten performance benchmarks under the Broadband Equity, Access, and Deployment (BEAD) Program. Providers must price these risks into a project even if the rules never change. Regulatory uncertainty can therefore sharply increase deployment costs and deter investments that would otherwise proceed.

C.             Demand, Obsolescence, and Regulatory Risk

Alongside high deployment costs, broadband providers face uncertainty about future demand. The FCC currently uses download speeds of 100 megabits per second and upload speeds of 20 megabits per second as its benchmark for fixed broadband.[27] That benchmark supports many current applications, but individual needs vary widely. A household with three children streaming separate programs requires more capacity than a single occupant who uses the internet mainly for email. Providers must design networks around expected use across their customer base, not the needs of any one household.

That task becomes harder as technology and consumer behavior change. AI, AR, and VR could sharply alter usage patterns and increase demand for network capacity. Providers can draw on lessons from the deployment of fourth-generation (4G) wireless networks and other technological shifts, but historical data cannot eliminate uncertainty about future demand.

Providers must also choose among technologies whose relative costs and capabilities will continue to change. Advances in LEO satellite service, sixth-generation (6G) wireless networks, or other technologies could undermine the economics of infrastructure built today. Physical assets could then become stranded, meaning they would no longer generate enough revenue to repay the debt used to finance them.

Investors account for this risk of obsolescence. If they cannot be confident that an asset will remain commercially useful for 10 years, they will demand a faster return of capital. That shorter recovery period can lead to higher prices, delayed construction, or no deployment in marginal markets. Regulation can compound the problem. Rules that calculate returns from historical costs over long recovery periods may fail to account for infrastructure that becomes obsolete before investors recover their capital.

Providers also face the risk of regulatory hold-up.[28] Before construction begins, providers retain leverage because capital is mobile. If one jurisdiction imposes excessive burdens, they can invest elsewhere. Governments may seek to attract investment by offering subsidies, regulatory stability, forbearance, or favorable franchise terms.

Once a provider has built the network, the balance of power shifts. The provider cannot move its fiber, recover most of its costs, or credibly threaten to leave. Regulators can then change the terms governing the investment by imposing rate controls, requiring competitors to receive access to the infrastructure, or adopting other rules that reduce the provider’s expected return.

This mismatch between regulatory assumptions and investment realities can produce underinvestment. Regulators may view broadband as a mature monopoly utility. In competitive markets, though, broadband deployment often carries risks closer to those of a technology startup than a traditional water or telephone company. Policy that ignores those risks will discourage investment precisely where uncertain demand already makes deployment hardest to justify.

III.           The Costs and Risks of Permitting

Broadband deployment requires costly, long-term investments that providers cannot easily recover or redirect. Regulators seeking to encourage deployment should therefore reduce avoidable costs and risks. Permitting offers a prime opportunity for reform.

A permit is more than a line item in a project budget. An outside party with discretion—and often an effective veto—controls both its price and its timing. Providers must identify the relevant authorities, navigate overlapping review processes, negotiate access and conditions, and comply with ongoing obligations. Each step adds transaction costs. Uncertain timelines, subjective standards, and litigation also delay revenue, shorten an asset’s useful economic life, and raise the return investors require. When a route needs approval from multiple gatekeepers, any one of them can hold up the entire build. Permitting can therefore become both one of a broadband project’s largest transaction costs and one of its greatest sources of investment risk.

A.             How Permitting Raises Transaction Costs

Permitting maps closely onto the three categories of transaction costs identified in Section II.B: finding the relevant decision-makers, securing their approval, and complying with or enforcing the resulting agreements.

The first category consists of search and information costs.[29] A rural broadband route may cross federal land administered by the Bureau of Land Management (BLM) or the U.S. Forest Service. That can trigger a right-of-way grant, environmental review under the National Environmental Policy Act (NEPA), historic-preservation review under Section 106 of the National Historic Preservation Act (NHPA), and tribal consultation.

The same route may follow or cross a state highway right-of-way, then pass through a patchwork of county and municipal permitting regimes as it approaches consumers. It may also require access to a railroad crossing controlled by a private carrier or to easements across private land. Before applying for approval, the provider must identify who controls each segment, which law governs, and which overlapping review processes apply. In areas where the federal government owns much of the land, a rural route may remain within the federal permitting system for most of its length.

The second category consists of bargaining and decision costs. Once a provider identifies the relevant authority or landowner, it must secure the right to enter the right-of-way and build. Each entity may impose its own applications, fees, engineering studies, surveys, and substantive standards. The provider must satisfy each one separately.

Many of these decisions involve discretion rather than a ministerial review based on an objective checklist. Providers must therefore do more than pay a posted fee. They may need to negotiate terms, commission studies, redesign routes, and accept project-specific conditions.[30] Multiplied across every jurisdiction along a route, these requirements create a substantial administrative burden before workers install a single strand of fiber.

The third category consists of policing and enforcement costs. After securing a permit, providers must comply with restoration requirements, seasonal work windows, inspection regimes, and other conditions. They must monitor those obligations and may need to challenge denials or disputed conditions through administrative proceedings or litigation.

Each authority and landowner along a route controls an independent point at which the project can stall. Each may seek to maximize the value of its own permission without accounting for the cumulative burden on the deployment.[31] A railroad may charge far more for a perpendicular crossing than the cost of the materials disturbed. A single county may withhold a right-of-way permit. Either can stop a project that has secured every other approval.

This dynamic helps explain why providers sometimes choose technologies that require a single approval over those that require thousands. Yet even that single approval may trigger NEPA and Section 106 review when a project crosses federal land. The holdout risk also grows as construction progresses. The last party controlling an unapproved segment gains bargaining power because the provider cannot readily redeploy the capital already sunk into the rest of the route.

On many routes, obtaining permission costs more than the hardware that permission allows the provider to install. The process meant to authorize construction can become costlier than construction itself.

B.             Delay, Discretion, and Litigation Risk

Permit fees account for only part of the risk that broadband providers must consider when investing in infrastructure. Delays, discretionary standards, and litigation can impose even greater costs.

Delay matters because broadband projects require large upfront investments in assets that providers cannot readily redeploy. Project economics depend heavily on when revenue begins relative to when costs accrue. Permitting pushes revenue further into the future, while financing and development costs begin accumulating before construction starts.

Providers must carry those costs through a review process of uncertain length. Each month of delay also consumes part of an asset’s useful economic life while the risk of technological obsolescence continues to grow. A 10-year asset that spends three years in review and litigation must repay its debt from seven years of revenue rather than 10. If a disruptive technology emerges in year five, the delay will have consumed much of the period during which the asset remained competitive. Permitting delays thus compress the recovery period on which the investment depends.

Discretion adds another layer of risk. Permitting standards often turn on open-ended questions: What constitutes a “reasonable period of time”? Does a denial rest on “substantial evidence”? Does a project qualify for a categorical exclusion from full environmental review?[32] A provider can incorporate a fixed fee into its budget. It cannot price a discretionary decision with the same confidence. Instead, it must estimate a range of possible outcomes and require a higher expected return to compensate for that uncertainty.

Completing agency review does not eliminate the risk. NEPA is the most frequently litigated federal environmental statute.[33] Research indicates that national advocacy organizations, rather than directly affected local parties, have filed most NEPA suits in recent years.[34] Litigants can challenge a categorical exclusion or a finding of no significant impact, adding years to a project that has already cleared agency review.

The Supreme Court narrowed that exposure last year in Seven County Infrastructure Coalition v. Eagle County.[35] The Court directed lower courts to give agencies substantial deference when reviewing the scope of their environmental analyses. It also held that NEPA generally does not require agencies to analyze attenuated upstream or downstream effects tied to separate projects in different places or at different times. The decision should narrow both the required analysis and the available grounds for litigation. But it did not eliminate NEPA review, its associated delays, or the possibility that a court could enjoin a project after an agency approves it. Investors must still account for those risks before committing capital.

Taken together, permitting adds fragmented veto points to projects that already require large, sunk investments exposed to technological obsolescence. It then makes both the duration and outcome of the process uncertain. Providers price that risk into every project, even when no delay or denial ultimately occurs. A project that proceeds on schedule still costs more ex ante because investors had to account for the possibility that it would not.

These burdens do not fall evenly. Delay and denial risk raise the hurdle rate—the minimum expected return needed to justify an investment—and eliminate marginal projects first. The effects therefore fall hardest in communities where deployment promises substantial social value but weak private returns. Streamlining permitting can help close that gap by allowing more of broadband’s diffuse social benefits to support actual investment.

IV.          The Broadband Permitting Stack

Section III explained how permitting operates as both a transaction cost and a source of investment risk. This section maps those burdens across federal, state, and local governments, as well as the separate regime governing pole attachments.

Although the requirements differ, their costs recur in familiar forms: application fees, recurring rents, in-kind obligations, consultant expenses, bonding and insurance requirements, compliance costs, and, above all, the carrying cost of delay. Federal environmental, historic-preservation, tribal, water, habitat, and land-use reviews may overlap with state highway-access and environmental rules. Local franchising, right-of-way, siting, street-cut, and inspection requirements add further approvals. Aerial deployments must also navigate pole-access, make-ready, and replacement processes controlled by utilities and existing attachers.

These layers compound rather than merely accumulate. Independent decision-makers control sequential veto points without bearing the project’s total cost. The resulting delays and uncertainty raise the return needed to justify investment and threaten marginal projects first—especially rural and underserved builds with limited private returns but substantial social value.

A.             Federal Environmental and Land-Use Permitting

A broadband project may require federal approval because it receives federal funding or because a federal agency must authorize part of it. The most consequential federal process is often review under NEPA, which requires agencies to assess the environmental effects of major federal actions.[36] For broadband projects, that duty may arise when a build receives federal support, including a BEAD subgrant, or when the FCC’s licensing authority makes a wireless deployment a federal action.[37]

The required analysis varies with the project’s likely effects. Agencies may apply a categorical exclusion to routine work requiring minimal documentation, prepare an environmental assessment to determine whether significant effects are likely, or require a full environmental-impact statement. Providers may need to hire consultants and wait for agency review, but uncertainty and litigation often impose the larger costs.[38]

Congress imposed deadlines and document-length limits in 2023, and the Supreme Court further narrowed NEPA exposure in Seven County Infrastructure Coalition v. Eagle County.[39] The Court directed lower courts to defer substantially to agencies and rejected demands that they analyze attenuated upstream and downstream effects tied to separate projects. These changes should limit the scope of review and the grounds for litigation. Neither eliminated NEPA’s underlying requirements or the delays they can create.

Section 106 of the NHPA adds a separate historic-preservation review. It requires agencies to assess a project’s effects on properties listed in, or eligible for, the National Register of Historic Places and to consult the relevant state or tribal historic preservation officer.[40] A single consultation can take six months or longer. In areas rich in historic or cultural resources, that review can determine the schedule for the entire build.[41]

Projects affecting tribal lands or cultural resources may require broader consultation. Section 106 reaches beyond tribes whose present-day lands contain the project. Agencies must also consult any tribe that attaches religious or cultural significance to an affected property, including ancestral sites far from current reservation boundaries.[42] For wireless facilities, the FCC’s notification process may require consultation with many tribes over one site.

This process serves genuine interests in tribal sovereignty and cultural preservation. It also adds per-site fees and another uncertain scheduling variable. Providers and some policymakers contend that some tribes have used review fees partly to generate revenue rather than solely to fund oversight, allowing revenue to rise with the pace of deployment.[43] Whatever the purpose of a particular charge, providers must include both its amount and its timing in the cost of a build.

Routes crossing wetlands, streams, or navigable waters face another layer of federal review, administered primarily by the U.S. Army Corps of Engineers (Corps).[44] The Corps offers nationwide permits for routine linear crossings that remain within defined limits on the area and degree of disturbance.[45] This streamlined process can keep the burden modest.

Costs and delays rise sharply when a crossing exceeds those limits and requires an individual permit. That process may demand a formal wetland delineation, public notice, and a review lasting more than a year. Section 7 of the Endangered Species Act can add consultation with the U.S. Fish and Wildlife Service, biological surveys, and seasonal work restrictions.[46] Those restrictions may affect a project’s schedule more than its budget by halting construction during breeding or migration periods.

As with NEPA review, uncertainty often costs more than the permit fee itself. Providers must account for the possibility of an individual permit, extended consultation, or a seasonal restriction at every crossing, including those that ultimately qualify for streamlined treatment.

Projects crossing federal land face a separate right-of-way process. This is especially common in the western United States, where the federal government owns large expanses of land. The Federal Land Policy and Management Act authorizes the BLM to grant rights-of-way across public lands.[47] The Forest Service, National Park Service, and Department of Defense administer separate regimes for their holdings.

These approvals can generate two fee streams: cost-recovery charges that reimburse agencies for processing and monitoring, and rental fees based partly on the population a facility serves. A 2024 BLM rule streamlined the communications-use program, required electronic filing, and established a 270-day deadline for decisions.[48] Those reforms implicitly acknowledged that the earlier process imposed delays substantial enough to deter deployment.

B.             State Permitting and Regulatory Fragmentation

The most common state-level requirement is permission to occupy or cross state highway rights-of-way, typically through an encroachment or utility-accommodation permit.[49] Because each state establishes its own regime, a provider operating across several states must navigate distinct fee schedules, technical standards, applications, and review timelines. This fragmentation raises search and bargaining costs before the provider pays a permit fee.

Many states also require a carrier to obtain a certificate of public convenience and necessity, or to register with the utility commission, before operating or occupying the right-of-way. A related designation, eligible-telecommunications-carrier status, is a precondition for most subsidy programs and carries obligations of its own.[50]

State law may duplicate or displace federal requirements. Roughly 16 states have enacted their own environmental-review statutes, often called “little NEPAs.”[51] California’s Environmental Quality Act is the best-known example.[52] These laws can add a parallel track of environmental study and litigation to projects already subject to NEPA.

In roughly 20 states, Section 224’s reverse-preemption provision displaces the federal pole-attachment regime. State rules therefore govern one of the largest infrastructure-access costs across much of the country. Many states have also replaced local cable franchises with statewide video-franchise systems.[53]

Other state requirements include dig-once policies that coordinate conduit installation, one-call rules requiring excavators to locate buried utilities, and pavement-restoration standards. These measures add procedural steps, but thoughtful design can reduce overall costs by coordinating construction, preventing damage, and avoiding repeated excavation.

C.             Local Franchising and Siting Controls

At the municipal level, cable operators must obtain a local franchise under Title VI of the Communications Act. Federal law caps the franchise fee at 5% of gross revenue.[54] Localities have also required in-kind contributions, including public-access channels, capacity on institutional networks serving public facilities, free service to public buildings, and buildout commitments. The FCC’s 2019 order counts many of these contributions toward the 5% ceiling, but disputes over additional obligations persist.[55]

Negotiating and renewing franchises can itself delay deployment. Reform proposals have therefore paired franchising requirements with a shot clock—a deadline for government action—and a deemed-granted remedy that automatically approves an application when the locality misses that deadline.[56]

Noncable providers generally use permits rather than franchises to access local rights-of-way.[57] Section 253 bars state and local requirements that prohibit or effectively prohibit telecommunications service. It also preserves local authority to manage public rights-of-way and require fair and reasonable compensation.[58] The FCC has generally treated fees closely tied to a locality’s actual costs as the most appropriate measure under that framework. Enforcement remains uneven, and some localities continue to impose above-cost or gross-revenue fees.

Above-ground facilities—including cabinets, equipment huts, small-cell antennas, and towers—may require conditional-use permits, variances, site-plan and aesthetic review, public hearings, and compliance with height and spacing limits. Some jurisdictions also require providers to place facilities underground. Section 332(c)(7) preserves substantial local authority over wireless siting while prohibiting decisions that ban or effectively ban wireless service.[59] FCC shot clocks limit the time for review, but the process can still take months or years.

Providers must obtain additional public-works approvals before trenching or boring. These may cover street cuts, lane closures, traffic control, and pavement restoration. Rules addressing pavement damage and moratoria on cutting newly paved streets can add large and highly variable costs.[60] Building and electrical permits and inspections may apply as well. Some localities also impose temporary siting moratoria that consume much or all of the applicable shot-clock period.[61]

Wireless facilities operate under a more developed federal timing framework. Under Section 332(c)(7), localities presumptively have 90 days to act on collocation applications (which seek to place equipment on existing structures) and 150 days to review new sites.[62] Missing those deadlines constitutes a “failure to act,” but it does not automatically approve the application. The provider must seek relief in court.

The FCC’s 2018 Small Cell Order shortened the review periods to 60 days for collocations and 90 days for new small wireless facilities. It also established presumptively reasonable fee levels.[63] Section 6409(a) requires localities to approve eligible modifications that do not substantially change the physical dimensions of an existing tower or base station. FCC rules apply a 60-day shot clock and a self-executing deemed-granted remedy to those requests.[64]

These provisions are among the strongest timing protections in the current permitting system. Their existence highlights how little comparable discipline governs many other approvals. Even here, localities can pause or restart the clocks by declaring applications incomplete or requiring supplemental studies.[65]

D.            Pole Attachments and Make-Ready Costs

To deploy aerial fiber, a provider must attach its lines to utility poles it usually does not own. Federal law, rather than private bargaining alone, largely governs the terms of that access. Section 224 of the Communications Act requires pole-attachment rates, terms, and conditions to be “just and reasonable.” The FCC administers that standard through formula-based rates in states that have not certified their own regulatory regimes.[66]

This framework aims to promote investment and facilitate deployment, but it does not cover poles owned by municipalities or rural electric cooperatives.[67] Providers seeking to use those poles must negotiate without a federal regulatory backstop.

The permit or rental rate represents only part of the cost. The larger and less predictable expense often comes from make-ready work: the rearrangement, relocation, or reinforcement of existing equipment needed to create space for a new line.[68] This work can cost several hundred to several thousand dollars per pole. It may also take months, because each company with equipment already on the pole must move its facilities in sequence.[69]

When a pole is too short or weak to support another attachment, make-ready work may require replacing it at a cost of roughly $5,000 to $15,000.[70] Utilities have historically charged the entire replacement cost to the new attacher, even when the pole had deteriorated, neared the end of its useful life, or otherwise required replacement.[71]

The FCC has found that a utility may not impose the full cost on a new attacher that did not solely cause the replacement. Instead, the pole owner must bear costs attributable to preexisting violations or a replacement it already had an obligation to make.[72] This approach prevents utilities from using a new attachment request to shift the cost of overdue maintenance onto the requesting provider.

The FCC has also adopted one-touch make-ready (OTMR) rules for simpler work. OTMR allows one qualified contractor to move existing equipment in a single pass rather than waiting for a succession of incumbent contractors.[73] The process can reduce delays that might otherwise consume much of a year.[74]

E.              How Permitting Burdens Compound

Each permitting layer can impede deployment on its own. Together, they impose a much larger burden. Independent authorities and landowners control separate veto points, yet none has an incentive to account for the project’s total cost. The provider therefore faces more than the price a single, coordinated decision-maker might charge. It must bear the cumulative demands of many actors, each seeking value for its own approval.

Each layer also adds more than a fee. It introduces a delay of uncertain length. Because broadband projects require large, sunk investments in assets exposed to obsolescence, those delays raise financing costs, shorten the period available to recover capital, and increase the project’s risk premium.

These burdens fall unevenly. Each additional cost or delay raises the hurdle rate, so the marginal project fails first. That project is disproportionately likely to serve a rural or underserved community where expected private returns are thin but the broader social benefits are substantial. Permitting barriers thus inflict their greatest harm where deployment may create the most social value. That mismatch supplies the central case for reform, to which the next section turns.

V.             A Reform Agenda for Faster, More Predictable Deployment

Effective reform must address more than posted fees. Uncertain delays, fragmented approvals, and the risk of regulatory reversal often do more damage because providers must price those risks into every project. These burdens fall hardest on marginal builds, especially networks serving rural and underserved areas.

Since mid-2025, the FCC’s “Build America” agenda has targeted many of these barriers. The agency has opened proceedings on wireless siting and wireline rights-of-way, revised its pole-attachment rules, and proposed changes to its environmental and historic-preservation reviews.[75] Further reforms should streamline federal reviews, constrain state and local fees and timelines, modernize cable franchising, expand pole-access protections, resolve pole-replacement disputes, coordinate fiber installation with roadwork, and codify durable rules that investors can rely on. Together, these changes would reduce the cost and uncertainty of building the communications networks that AI and other next-generation applications require.

A.             Streamlining Federal Reviews

Federal review regimes impose their greatest costs through delay, uncertainty, and litigation rather than permit fees. Reform should therefore limit full review to projects likely to cause significant effects, accelerate the reviews that remain, and give approved projects greater finality.

Categorical exclusions offer the most efficient tool for routine deployments. When experience shows that a defined class of projects does not ordinarily cause significant environmental effects, an exclusion can avoid repetitive case-by-case assessments while narrowing both direct costs and the grounds for litigation.[76] Programmatic agreements can serve the same function under Section 106. Rather than reconsidering recurring issues site by site, agencies, preservation officials, and tribes can establish one framework governing an entire category of deployments.[77]

Recent Supreme Court decisions have narrowed the governing federal obligations. In Seven County Infrastructure Coalition v. Eagle County, the Court reinforced agency discretion under NEPA and limited demands to analyze attenuated effects tied to separate upstream or downstream projects.[78] In Sackett v. EPA, the Court narrowed federal wetlands jurisdiction under the Clean Water Act.[79] These decisions provide meaningful limits, but their practical effect still depends on how agencies implement them and how courts apply them in later cases.

Congress and agencies should translate those boundaries into clear, durable rules. Agencies should adopt categorical exclusions for well-defined classes of communications facilities that reliably produce no significant effects. Firm review deadlines should govern the projects that remain, with automatic approval when an agency fails to act on time.

Reform must also respect the limits courts have already imposed. In United Keetoowah Band of Cherokee Indians v. FCC, the D.C. Circuit vacated the FCC’s attempt to exempt small wireless facilities from NEPA and Section 106 review.[80] The court found that the FCC had not adequately justified its public-interest determination or addressed potential effects on historic and tribal resources. The decision shows that streamlining measures need a well-developed record that squarely addresses environmental, historic-preservation, and tribal interests.

The same principles apply to projects crossing federal land. Agencies should use master right-of-way agreements, standardized applications, cost-based rather than value-based charges, and firm decision deadlines. The BLM’s 2024 communications-use rule offers a useful model for making federal approvals faster and more predictable without abandoning substantive review.

B.             Cost-Based Fees and Self-Enforcing Deadlines

For facilities outside the FCC’s small wireless framework, state and local reform should focus on two issues: fees and review deadlines. In both cases, the rule matters only if providers can enforce it effectively.

Fees for construction permits and access to public rights-of-way should recover the government’s actual costs. They should not capture the value of the provider’s investment or exploit the government’s monopoly control over the corridor. Value-based and gross-revenue fees operate as taxes on deployment. They fall hardest on thin-margin rural projects that policy should encourage.

Presumptively reasonable benchmarks can give providers and localities a clear reference point. The FCC’s small-cell safe harbors—$500 for certain applications and $270 per site each year—illustrate the approach. A locality could impose a higher fee, but it would bear the burden of showing why its actual costs justify the increase. Governments should not be able to evade fee caps by demanding in-kind contributions instead of money.

Deadlines require equally strong enforcement. A shot clock that merely allows a provider to sue after time expires preserves much of the delay and uncertainty it aims to eliminate. The provider must still account for the expense, duration, and risk of litigation.

A self-executing “deemed granted” remedy works differently. Under Section 6409(a), an eligible application receives automatic approval when the locality fails to act within the prescribed period. The provider therefore knows it will receive an answer by a date certain, regardless of the locality’s diligence. Extending this model to ordinary siting, right-of-way, and construction permits would provide the strongest available protection against permitting delay.

The American Broadband Deployment Act of 2025 and the BROADBAND Leadership Act reflect this approach by pairing deadlines across multiple permitting layers with cost-based fee limits.[81] The FCC is pursuing similar goals under its Section 253 and Spectrum Act authority, including a proposed “rocket docket”—an expedited process for resolving preemption disputes.[82]

Reform should still preserve local authority over legitimate concerns such as public safety, traffic management, and aesthetics. The aim should be to discipline fees and timing while allowing reasonable, evenhandedly applied substantive conditions.

C.             Reforming Local Franchising

Title VI’s local cable-franchising regime predates modern competition among fiber providers building their own networks. Today, it can operate as both a toll and a source of delay for video-capable broadband entrants. Moreover, the 5% gross-revenue franchise-fee cap cannot serve as a meaningful ceiling if localities may extract additional value through in-kind demands.

The FCC’s 2019 order, which counts many in-kind obligations toward the cap, was a sound response. Congress should codify that approach so it does not depend on changing FCC majorities. Governments should not be able to evade a monetary cap by demanding services, facilities, or other contributions instead.

The broader reform is to subject franchising to the same timing rules as other permits. The American Broadband Deployment Act of 2025, for example, would establish a 120-day deadline so localities cannot use a process negotiated with an incumbent to delay a second provider.[83] States that have replaced separate local regimes with a single statewide video franchise offer a model that other jurisdictions could expand.

Franchising can also obstruct providers that do not offer cable service. Some localities have conditioned ordinary right-of-way permits on a noncable provider first obtaining a cable franchise. This practice erases the distinction between permits and franchises and imports a slower, more demanding process into routine right-of-way access.

Gateway Fiber encountered this problem in Minnesota. After the company sought permits to build fiber in several cities, Maple Grove said it would defer action until Gateway completed the cable-franchising process. Gateway is not a cable operator, yet the city effectively refused to issue the right-of-way permits without a cable-franchise agreement.[84]

Gateway petitioned the FCC in June 2025 for a declaratory ruling preempting the requirement under Section 253(d). The company argued that Maple Grove’s refusal to act “has the effect of prohibiting” telecommunications service in violation of Section 253(a). According to Gateway, the city’s position prevents the company from operating its existing network and blocks expansion into new areas.[85]

The Wireline Competition Bureau placed the petition on public notice in July 2026 and situated the dispute within the FCC’s broader Section 253 wireline-deployment inquiry.[86] Whatever the Commission decides, the episode exposes a broader vulnerability. The line between a permit and a franchise can turn on disputed questions about a provider’s regulatory classification and a locality’s authority under state law. A locality can exploit that uncertainty to repurpose a legacy franchising process as a gatekeeping tool against a new fiber entrant—the kind of last-mile chokepoint that Section 253 is meant to police.[87]

D.             Closing the Pole-Attachment Gap

Because access to existing poles often represents one of the largest costs of a wireline build, policymakers should extend Section 224’s guarantee of just, reasonable, and timely access more broadly. Recent FCC orders have improved the federal regime. OTMR allows one approved crew to complete simple work rather than waiting for multiple attachers to act in sequence. The FCC’s July 2025 order also established access timelines for large and bulk applications, required parties to meet and confer, expanded self-help when utilities miss deadlines, and accelerated approval of qualified contractors.[88]

These reforms reach only part of the problem. Section 224 exempts poles owned by municipalities and cooperatively organized utilities, placing them outside the FCC’s jurisdiction.[89] Municipal utilities and rural electric cooperatives own a substantial share of the distribution poles in rural America—the same unserved and underserved areas targeted by federal broadband programs and where deployment economics are already most difficult.[90]

Providers seeking access to municipal or cooperative poles therefore face rates and timelines unconstrained by federal rules. In many states, no comparable state protections apply. Congress should extend Section 224—or an equivalent set of federally enforceable deadlines and cost-allocation rules—to these poles. Doing so would narrow the gap between the places where connectivity is most needed and those where access rules make deployment feasible.

Any extension should still allow pole owners to recover legitimate costs. Municipal and cooperative utilities are nonprofit entities owned by citizens or members, so ratepayers ultimately bear the cost of below-cost attachment rates. Reform should prevent monopoly pricing and unreasonable delay without forcing those ratepayers to subsidize broadband attachers.

E.              Enforcing Pole-Replacement Cost Sharing

Broadband providers and pole owners increasingly dispute who should pay when a pole must be replaced to accommodate a new attachment. The FCC’s December 2023 declaratory ruling clarified that an attachment does not “solely” necessitate replacement when the utility has already red-tagged the pole (marked it for replacement) or when a change in the utility’s construction standards requires the upgrade. In those circumstances, the new attacher should not bear the full cost.[91]

The central challenge is now enforcement. The rule helps providers only if they can invoke it quickly and at reasonable cost. Otherwise, the utility’s initial allocation governs while the dispute proceeds, and the FCC’s cost-sharing principle may have little practical effect.

Three complementary reforms could close that gap. First, the FCC should resolve these disputes through an expedited complaint process or “rocket docket” governed by firm deadlines.[92] Where authorized, fee shifting could further reduce the cost of asserting a valid claim. Faster and less expensive adjudication would make the proper allocation—not the utility’s opening demand—the operative result.

Second, Congress should codify the cost-allocation principle. Codification would protect it from reconsideration petitions and changes in FCC leadership, giving providers a more stable basis for investments expected to last 20 years.

Third, targeted public reimbursement funds could help resolve cases in which genuine cost sharing is warranted. Limited support for qualifying pole replacements could break deployment impasses without requiring the parties to litigate responsibility pole by pole.

F.              Coordinating Broadband with Roadwork

Excavation accounts for much of the cost of underground fiber, making coordination with planned roadwork one of the highest-return deployment reforms. A 2021 Federal Highway Administration rule requires state transportation departments receiving federal-aid highway funds to designate a broadband utility coordinator and establish processes for registration, notification, and coordination. A January 2026 Government Accountability Office review found that most states had made progress implementing those requirements, although their effects on deployment remain difficult to measure.[93]

Weak “dig-once” policies merely notify providers of planned roadwork and give them an opportunity to install conduit. That approach helps only providers whose construction plans happen to align with a particular project. Middle-mile and backhaul routes, which connect local networks to the broader internet, frequently will not align.

Stronger policies require road sponsors to install spare conduit whenever a federally funded project opens the ground. The sponsoring agency can then own and lease that conduit to broadband providers. This approach preserves far more of the roadwork’s future value by allowing providers to install fiber later without excavating again. Proponents estimate that installing conduit during planned construction adds only a few percentage points to the road project’s cost.

G.            Making Reform Durable

As outlined above, many of the most consequential recent reforms rest on agency orders or judicial interpretations. But both can change. Investors will hesitate to commit capital for 10 years based on a rule that a new FCC majority, a reconsideration petition, or a later court decision could undo in five.

That uncertainty limits the value of agency streamlining. Even a sound reform will attract less investment if providers must account for the risk that it will disappear before they recover their costs. Congress should therefore codify the durable core of these reforms.

Codification would do more than settle individual policy disputes. By reducing uncertainty across every project, it would lower the return investors require to commit capital. That reduction would matter most for marginal projects, especially in rural and other hard-to-reach areas where modest changes in cost or risk can determine whether a network gets built.

VI.          Conclusion

Debate over the infrastructure needed for next-generation applications often focuses on data centers and electricity. Yet AI, AR, and VR can reach users only through communications networks built across public land, local rights-of-way, railroad crossings, and utility poles—one approval at a time.

Broadband investment already carries high fixed costs, uncertain demand, obsolescence risk, and long recovery periods. Fragmented permitting compounds those risks. Each additional gatekeeper can impose fees, delay construction, or block a route, while no single authority bears the project’s cumulative cost. Providers must price that uncertainty into every build, even when approvals ultimately arrive on time. The resulting burden falls hardest on rural and underserved projects whose social value may be high but whose expected private returns are thin.

Reform should preserve legitimate environmental, historic-preservation, public-safety, and land-management interests while making approvals faster, more predictable, and more proportionate. Firm shot clocks, self-executing deemed-granted remedies, cost-based fee caps, streamlined federal reviews, modernized franchising, broader pole-access protections, and rapid resolution of pole-replacement disputes would directly reduce deployment barriers. OTMR and dig-once policies can lower construction costs by reducing repeated work. Codifying the durable core of these reforms in federal legislation would further reduce the risk that future regulators will reverse them before investors recover their capital.

The jurisdictions that succeed in the next technology race will need more than computing power and electricity. They will need rules that allow the networks connecting those resources to people and businesses to get built.

[1] Kristian Stout, Infrastructure Is Destiny: The Geography of the Next Technology Race (Int’l Ctr. for L. & Econ. May 26, 2026), https://laweconcenter.org/resources/infrastructure-is-destiny-the-geography-of-the-next-technology-race; Jeffrey Westling, The Invisible Infrastructure: Spectrum Policy for the AI Era (Int’l Ctr. for L. & Econ. July 24, 2026), https://laweconcenter.org/resources/the-invisible-infrastructure-spectrum-policy-for-the-ai-era.

[2] See Intelligent Networks: Powering Artificial Intelligence and Transforming Communications: Hearing Before the Subcomm. on Telecomm. & Media of the S. Comm. on Com., Sci., & Transp., 119th Cong. (2026) (statement of Jonathan Spalter, President & CEO, USTelecom—The Broadband Ass’n), https://www.commerce.senate.gov/wp-content/uploads/meetings/379d9950-dc84-b1bf-2c6a-ee1ebb42fbe2/Spalter_Written_Testimony_7eddc348-33d3-4f43-b974-3023b1205597.pdf.

[3] Jeffrey Westling, 2020 Broadband Scorecard Report (R St. Inst. Feb. 10, 2021), https://www.rstreet.org/research/2020-broadband-scorecard-report.

[4] See, e.g., Comments of the International Center for Law & Economics, The State of Competition in the Communications Marketplace, GN Docket No. 26-78, at 11 (2026), https://laweconcenter.org/resources/icle-comments-to-the-fcc-on-the-state-of-competition-in-the-communications-marketplace [hereinafter ICLE Competition Comments]; Stout, supra note 1, at 18; Jeffrey Westling, The Last Mile Is a Paper Trail: Why Broadband Gets Stuck, Truth on the Mkt. (Apr. 22, 2026), https://truthonthemarket.com/2026/04/22/the-last-mile-is-a-paper-trail-why-broadband-gets-stuck.

[5] See Ben Sperry & Kristian Stout, Issue Brief: Pole Attachments and Broadband Build-Out, at 1 (Int’l Ctr. for L. & Econ. 2021), https://laweconcenter.org/resources/issue-brief-pole-attachments-and-broadband-build-out; Kristian Stout & Ben Sperry, Guiding Principles & Legislative Checklist for Broadband Subsidies (Int’l Ctr. for L. & Econ. 2022), https://laweconcenter.org/resources/guiding-principles-legislative-checklist-for-broadband-subsidies; Jeffrey Westling, The Cost of Holding Up Broadband, Truth on the Mkt. (July 14, 2026), https://truthonthemarket.com/2026/07/14/the-cost-of-holding-up-broadband.

[6] Int’l Energy Agency, Key Questions on Energy and AI (2026), https://www.iea.org/reports/key-questions-on-energy-and-ai; Int’l Energy Agency, Energy and AI (2025), https://www.iea.org/reports/energy-and-ai.

[7] Stout, supra note 1, at 13; Westling, The Invisible Infrastructure, supra note 1, at 17; Jeffrey Westling & Kristian Stout, The AI Boom Still Runs on Old-Fashioned Airwaves, Truth on the Mkt. (July 29, 2026), https://truthonthemarket.com/2026/07/29/the-ai-boom-still-runs-on-old-fashioned-airwaves.

[8] ICLE Competition Comments, supra note 4, at 2; Westling, The Last Mile Is a Paper Trail, supra note 4.

[9] See Comments of the International Center for Law & Economics, Implementing the Infrastructure Investment and Jobs Act: Prevention and Elimination of Digital Discrimination, GN Docket No. 22-69, at 6 (May 16, 2022), https://laweconcenter.org/resources/icle-comments-to-the-fcc-on-prevention-and-elimination-of-digital-discrimination [hereinafter Digital Discrimination Comments]; Geoffrey A. Manne, Kristian Stout & Ben Sperry, A Dynamic Analysis of Broadband Competition: What Concentration Numbers Fail to Capture, at 30 (Int’l Ctr. for L. & Econ. 2021), https://laweconcenter.org/resources/a-dynamic-analysis-of-broadband-competition-what-concentration-numbers-fail-to-capture; ICLE Competition Comments, supra note 4, at 8.

[10] ICLE Competition Comments, supra note 4, at 8; see also Westling, The Last Mile Is a Paper Trail, supra note 4.

[11] ICLE Competition Comments, supra note 4, at 8; Joe Kane, Ben Sperry & Kristian Stout, Brief of ICLE and ITIF to the Eighth Circuit in Minnesota Telecom Alliance v. FCC, at 21 (Int’l Ctr. for L. & Econ. 2024), https://laweconcenter.org/resources/brief-of-icle-and-itif-to-8th-circuit-in-minnesota-telecom-alliance-v-fcc.

[12] ICLE Competition Comments, supra note 4, at 8.

[13] Manne et al., supra note 9, at 10.

[14] See Digital Discrimination Comments, supra note 9, at 4–5; Eric Fruits, Ben Sperry & Kristian Stout, The Competitive Effects of the Proposed Charter/Cox Transaction, at 4–6 (Int’l Ctr. for L. & Econ. 2025), https://laweconcenter.org/resources/the-competitive-effects-of-the-proposed-charter-cox-transaction.

[15] ee Jeffrey Westling & Kristian Stout, ICLE Reply Comments to FCC on Eliminating Barriers to Wireless Deployments, at 12 (Int’l Ctr. for L. & Econ. 2026), https://laweconcenter.org/resources/icle-reply-comments-to-fcc-on-eliminating-barriers-to-wireless-deployments; Eric Fruits & Geoffrey A. Manne, Quack Attack: De Facto Rate Regulation in Telecommunications, at 16 (Int’l Ctr. for L. & Econ. 2023), https://laweconcenter.org/resources/quack-attack-de-facto-rate-regulation-in-telecommunications.

[16] See generally ICLE Competition Comments, supra note 4; see also Comments of the International Center for Law & Economics and Scholars of Law & Economics, Protecting the Privacy of Customers of Broadband and Other Telecommunications Services, WC Docket No. 16-106 (May 27, 2016), https://laweconcenter.org/resources/comments-icle-scholars-law-economics-matter-protecting-privacy-customers-broadband-telecommunications-services.

[17] ICLE Competition Comments, supra note 4, at 10; Westling, The Last Mile Is a Paper Trail, supra note 4.

[18] Westling, The Last Mile Is a Paper Trail, supra note 4.

[19] Chandler Dempsey et al., The Economic Impact of the Rural Digital Opportunity Fund, at 61 (Fla. State Univ. Dep’t of Econ. 2021), https://cosspp.fsu.edu/economics/wp-content/uploads/sites/10/2021/10/TheEconomicImpactoftheRuralDigitalOpportunityFund.pdf.

[20] Eric Fruits et al., Dynamic Competition in Broadband Markets: A 2024 Update, at 42 (Int’l Ctr. for L. & Econ. 2024), https://laweconcenter.org/wp-content/uploads/2024/06/Broadband-Competition-2024-Update.pdf.

[21] R.H. Coase, The Problem of Social Cost, 3 J.L. & Econ. 1 (1960).

[22] Westling, The Last Mile Is a Paper Trail, supra note 4.

[23] Id.

[24] Id.; see also Drew Clark, Railroad Crossing Killing Rural Broadband Deployment, Broadband Breakfast (Nov. 18, 2025), https://broadbandbreakfast.com/railroad-crossing-killing-rural-broadband-deployment-says-virginia-telecom-official.

[25] Ben Sperry et al., ICLE and CEI Amicus to the 6th Circuit on Safeguarding and Securing the Open Internet Order, at 4 (Int’l Ctr. for L. & Econ. 2024), https://laweconcenter.org/resources/icle-and-cei-amicus-to-the-6th-circuit-on-safeguarding-and-securing-the-open-internet-order.

[26] ICLE Competition Comments, supra note 4, at 8.

[27] Inquiry Concerning Deployment of Advanced Telecommunications Capability to All Americans in a Reasonable and Timely Fashion, 2024 Section 706 Report, GN Docket No. 22-270, FCC 24-27 (rel. Mar. 18, 2024), https://docs.fcc.gov/public/attachments/DOC-401205A1.pdf.

[28] Lazar Radic, Geoffrey A. Manne & Dirk Auer, Regulate for What? A Closer Look at the Rationale and Goals of Digital Competition Regulations, 22 Berkeley Bus. L.J. 73 (2025), https://laweconcenter.org/resources/regulate-for-what-a-closer-look-at-the-rationale-and-goals-of-digital-competition-regulations.

[29] Stout, supra note 1, at 18–19.

[30] Id.

[31] Robert D. Cooter & Michael D. Gilbert, Public Law and Economics 42 (Oxford Univ. Press 2022), https://laweconcenter.org/resources/public-law-and-economics (illustrating the unanimity holdout problem through a road crossing multiple parcels, where any owner can block the entire project); see also Comments of the International Center for Law & Economics, Implementation of Section 621(a)(1) of the Cable Communications Policy Act of 1984, as Amended by the Cable Television Consumer Protection and Competition Act of 1992, MB Docket No. 05-311, at 5 (July 18, 2019), https://laweconcenter.org/resources/icle-comments-on-implementation-of-section-621a1-of-the-cable-communications-policy-act-of-1984 (applying Klein-style hold-up theory to show how gatekeepers can extract rents after providers make relationship-specific sunk investments and explaining why the 1984 Act capped franchise fees).

[32] 47 U.S.C. § 332(c)(7)(B)(ii) (requiring state and local governments to act on siting requests “within a reasonable period of time”); id. § 332(c)(7)(B)(iii) (requiring written denials “supported by substantial evidence contained in a written record”).

[33] See Kristen Hite, Cong. Rsch. Serv., IF11932, National Environmental Policy Act: Judicial Review and Remedies (2024), https://www.congress.gov/crs-product/IF11932.

[34] Nikki Chiappa et al., Understanding NEPA Litigation (Breakthrough Inst. 2025), https://thebreakthrough.org/issues/energy/understanding-nepa-litigation.

[35] Seven County Infrastructure Coalition v. Eagle County, 605 U.S. 168 (2025); Kristian Stout, Testimony Before the House Judiciary Subcommittee on the Administrative State, Regulatory Reform, and Antitrust: The 30,000-Foot View: Competition and Regulation in the U.S. Airline Industry 12 (June 24, 2026), https://laweconcenter.org/resources/testimony-of-kristian-stout-to-the-house-judiciary-antitrust-subcommittee-on-competition-in-the-airline-industry.

[36] National Environmental Policy Act of 1969 § 102(2)(C), 42 U.S.C. § 4332(2)(C) (requiring federal agencies to prepare detailed environmental-impact statements for recommendations or reports on “major Federal actions significantly affecting the quality of the human environment”).

[37] Westling, The Last Mile Is a Paper Trail, supra note 4.

[38] Stout, The 30,000-Foot View, supra note 35, at 12.

[39] Seven County, 605 U.S. at 168.

[40] National Historic Preservation Act § 106, 54 U.S.C. § 306108.

[41] Westling, The Last Mile Is a Paper Trail, supra note 4; Geoffrey A. Manne, Gus Hurwitz & Kristian Stout, Putting Politics over Policy at the FCC, Truth on the Mkt. (Oct. 4, 2018), https://truthonthemarket.com/2018/10/04/putting-politics-over-policy-at-the-fcc.

[42] 54 U.S.C. § 302706(b) (requiring agencies to consult with Indian tribes that attach religious and cultural significance to affected historic properties).

[43] Statement of Commissioner Michael O’Rielly, Accelerating Wireless Broadband Deployment by Removing Barriers to Infrastructure Investment, Second Report and Order, WT Docket No. 17-79, FCC 18-30 (2018), https://docs.fcc.gov/public/attachments/FCC-18-30A4.pdf.

[44] Clean Water Act § 404, 33 U.S.C. § 1344 (authorizing Army Corps of Engineers permits for discharges of dredged or fill material into “waters of the United States,” including wetlands); 33 C.F.R. pts. 320–332; see U.S. Env’t Prot. Agency, Section 404 of the Clean Water Act, https://www.epa.gov/cwa-404; Rivers and Harbors Act of 1899 § 10, 33 U.S.C. § 403; U.S. Army Corps of Eng’rs, Section 10/Section 404 Permitting Reference Guide, https://www.spk.usace.army.mil/Portals/12/documents/regulatory/Reg_workshop/2015-11-06/RPW-Sec10-404.pdf.

[45] Clean Water Act § 404(e), 33 U.S.C. § 1344(e) (authorizing the Corps’ general and nationwide permit program); 33 C.F.R. pt. 330 (implementing the program).

[46] Endangered Species Act § 7(a)(2), 16 U.S.C. § 1536(a)(2) (requiring federal agencies, in consultation with the secretary, to ensure that their actions neither jeopardize listed species nor destroy or adversely modify designated critical habitat); 50 C.F.R. pt. 402 (implementing Section 7); U.S. Fish & Wildlife Serv., Section 7 Consultation, https://www.fws.gov/services/consultation-and-technical-assistance/esa-section-7-consultation (explaining that the Fish and Wildlife Service handles terrestrial and freshwater species, while NOAA’s National Marine Fisheries Service handles most marine and anadromous species).

[47] Federal Land Policy and Management Act of 1976 tit. V, 43 U.S.C. §§ 1761–1771 (authorizing the Bureau of Land Management to grant rights-of-way over public lands for communications sites and facilities, among other uses).

[48] Update of the Communications Uses Program, Cost Recovery Fee Schedules, and Section 512 of FLPMA for Rights-of-Way, 89 Fed. Reg. 25,916 (Apr. 12, 2024) (effective May 13, 2024), https://www.federalregister.gov/documents/2024/04/12/2024-06997/update-of-the-communications-uses-program-cost-recovery-fee-schedules-and-section-512-of-flpma-for.

[49] 23 C.F.R. § 645.211 (requiring each state transportation department to adopt an approved utility-accommodation policy governing utilities’ use and occupancy of highway rights-of-way); Fed. Highway Admin., Guidance on Longitudinal Telecommunications Installations on Limited Access Highway Right-of-Way, https://www.fhwa.dot.gov/utilities/001222.cfm (explaining that states allow fiber-optic installation along freeway rights-of-way under utility-accommodation policies, subject to reasonable permitting conditions governing time, place, and manner).

[50] 47 U.S.C. § 254(e) (limiting federal universal-service support to eligible telecommunications carriers designated under § 214(e) and requiring recipients to use that support only for its intended facilities and services); id. § 214(e) (authorizing state commissions—and, in specified circumstances, the FCC—to designate eligible telecommunications carriers).

[51] See Mass. Exec. Off. of Energy & Env’t Affs., MEPA Regulatory Review (2021), https://www.mass.gov/doc/mepa-regulatory-review-presentation/download (reporting that “[a]bout 16 states have ‘little NEPA’ programs”).

[52] Cal. Pub. Res. Code §§ 21000–21189.70 (2026).

[53] See Dana A. Scherer, Cong. Rsch. Serv., R46077, Potential Effect of FCC Rules on State and Local Video Franchising Authorities (2020), https://www.congress.gov/crs-product/R46077.

[54] Cable Communications Policy Act of 1984, Pub. L. No. 98-549, 98 Stat. 2779 (codified as amended at 47 U.S.C. §§ 521–573).

[55] Implementation of Section 621(a)(1) of the Cable Communications Policy Act of 1984, as Amended by the Cable Television Consumer Protection and Competition Act of 1992, Third Report and Order, MB Docket No. 05-311, FCC 19-80 (2019), https://docs.fcc.gov/public/attachments/FCC-19-80A1.pdf.

[56] See American Broadband Deployment Act of 2025, H.R. 2289, 119th Cong. (2025), https://www.congress.gov/bill/119th-congress/house-bill/2289.

[57] Title VI requires cable operators to obtain franchises before providing cable service. 47 U.S.C. § 541(b)(1). Noncable telecommunications and broadband providers instead access local rights-of-way under Section 253, which preserves local authority only to “manage the public rights-of-way” and require “fair and reasonable compensation.” Id. § 253(c). Some local codes therefore distinguish cable-television franchises from the permits and use authorizations that telecommunications providers obtain for rights-of-way access. See, e.g., Wash. Rev. Code § 35.99.040.

[58] 47 U.S.C. § 253(a), (c).

[59] 47 U.S.C. § 332(c)(7)(A), (B)(i)(II).

[60] Fed. Highway Admin., U.S. Dep’t of Transp., Pavement Utility Cuts: Controlling Pavement Cuts by Implementing Policy (2018), https://www.fhwa.dot.gov/utilities/utilitycuts/man03.cfm.

[61] Accelerating Wireless Broadband Deployment by Removing Barriers to Infrastructure Investment, Declaratory Ruling and Third Report and Order, WC Docket No. 17-84, ¶¶ 149–150, FCC 18-111 (2018), https://docs.fcc.gov/public/attachments/FCC-18-111A1.pdf.

[62] Petition for Declaratory Ruling to Clarify Provisions of Section 332(c)(7)(B) to Ensure Timely Siting Review and to Preempt Under Section 253 State and Local Ordinances That Classify All Wireless Siting Proposals as Requiring a Variance, Declaratory Ruling, WT Docket No. 08-165, ¶ 32, FCC 09-99 (2009), https://docs.fcc.gov/public/attachments/FCC-09-99A1.pdf.

[63] Accelerating Wireline Broadband Deployment by Removing Barriers to Infrastructure Investment et al., Declaratory Ruling and Third Report and Order, WT Docket No. 17-79 & WC Docket No. 17-84, ¶¶ 40–46, 104–110, FCC 18-133 (2018), https://docs.fcc.gov/public/attachments/FCC-18-133A1.pdf.

[64] 47 U.S.C. § 1455(a) (providing that state and local governments “may not deny, and shall approve” eligible requests to modify existing wireless towers or base stations when the modification does not substantially change their physical dimensions); Acceleration of Broadband Deployment by Improving Wireless Facilities Siting Policies et al., Report and Order, WT Docket No. 13-238 et al., ¶¶ 205–215, FCC 14-153 (2014), https://docs.fcc.gov/public/attachments/FCC-14-153A1.pdf (adopting a 60-day shot clock and a self-executing “deemed granted” remedy when a locality fails to act within 60 days after receiving the applicant’s notice).

[65] Accelerating Wireline Broadband Deployment, supra note 63, ¶¶ 84–90 (governing how incompleteness determinations affect the shot clocks).

[66] 47 U.S.C. § 224(b)(1).

[67] 47 U.S.C. § 224(a)(1).

[68] 47 C.F.R. § 1.1402(o).

[69] Westling, The Last Mile Is a Paper Trail, supra note 4.

[70] Id.

[71] Accelerating Wireline Broadband Deployment by Removing Barriers to Infrastructure Investment, Declaratory Ruling, WC Docket No. 17-84, ¶¶ 8–22, DA 21-78 (WCB 2021), https://docs.fcc.gov/public/attachments/DA-21-78A1.pdf (finding that utilities often charged new attachers the full cost of replacing poles already near the end of their useful lives or otherwise due for replacement and clarifying that new attachers need not pay to correct preexisting violations or replace “red-tagged” poles that utilities must replace).

[72] Id. ¶¶ 8–26.

[73] Accelerating Wireline Broadband Deployment, supra note 61, ¶¶ 33–86.

[74] For recent enforcement, see Fed. Commc’ns Comm’n, FCC Issues Precedent-Setting Order Under Expedited Review Process for Pole Attachment Complaints (Feb. 5, 2026), https://docs.fcc.gov/public/attachments/DOC-418491A1.pdf.

[75] Brendan Carr, Chairman, Fed. Commc’ns Comm’n, A Build Agenda for America (July 2, 2025), https://docs.fcc.gov/public/attachments/DOC-412663A1.pdf; see also Fed. Commc’ns Comm’n, Chairman Carr’s Build America Agenda, https://www.fcc.gov/build-america.

[76] 40 C.F.R. § 1501.4; 42 U.S.C. § 4336(a)(2).

[77] 36 C.F.R. § 800.14(b); see also 54 U.S.C. § 306108.

[78] Seven County, 605 U.S. at 168.

[79] Sackett v. EPA, 598 U.S. 651 (2023) (holding that the Clean Water Act covers only wetlands with a continuous surface connection to bodies that constitute “waters of the United States” in their own right, making the wetlands indistinguishable from those waters).

[80] United Keetoowah Band of Cherokee Indians v. FCC, 933 F.3d 728 (D.C. Cir. 2019) (vacating the FCC’s 2018 order insofar as it excluded small wireless-facility deployments from NEPA and National Historic Preservation Act Section 106 review because the FCC failed to justify that deregulation served the public interest or adequately address potential effects on historic and tribal resources).

[81] American Broadband Deployment Act of 2025, supra note 56; BROADBAND Leadership Act, H.R. 278, 119th Cong. (2025), https://www.congress.gov/bill/119th-congress/house-bill/278/text.

[82] Build America: Eliminating Barriers to Wireless Deployments, Notice of Proposed Rulemaking, WT Docket No. 25-276 (Sept. 2025), https://docs.fcc.gov/public/attachments/DOC-414414A1.pdf.

[83] American Broadband Deployment Act of 2025, supra note 56.

[84] Petition of Gateway Infrastructure, LLC d/b/a Gateway Fiber for Preemption and Declaratory Ruling Pursuant to Section 253(d) of the Communications Act of 1934, WC Docket No. 26-166 (filed June 17, 2025), https://www.fcc.gov/ecfs/search/search-filings/filing/26109834869 [hereinafter Gateway Fiber Petition]; see Wireline Competition Bureau Seeks Comment on Petitions for Preemption and Declaratory Ruling, Public Notice, DA 26-689 (WCB July 8, 2026), https://docs.fcc.gov/public/attachments/DA-26-689A1.pdf.

[85] Gateway Fiber Petition, supra note 84; see 47 U.S.C. § 253(a), (d).

[86] Wireline Competition Bureau Seeks Comment on Petitions for Preemption and Declaratory Ruling, supra note 84.

[87] Jeffrey Westling, Fiber Freeze: How Maple Grove Made a Cable Franchise the Price of Broadband, Truth on the Mkt. (Aug. 20, 2026), https://truthonthemarket.com/2026/08/20/fiber-freeze-how-maple-grove-made-a-cable-franchise-the-price-of-broadband.

[88] Accelerating Wireline Broadband Deployment by Removing Barriers to Infrastructure Investment, Fifth Report and Order, Fourth Further Notice of Proposed Rulemaking, and Orders on Reconsideration, WC Docket No. 17-84, FCC 25-38 (July 24, 2025), https://docs.fcc.gov/public/attachments/FCC-25-38A1.pdf.

[89] Ben Sperry, Geoffrey A. Manne & Kristian Stout, The Role of Antitrust and Pole-Attachment Oversight in TVA Broadband Deployment, 29 J. Tech. L. & Pol’y 73 (2025), https://scholarship.law.ufl.edu/cgi/viewcontent.cgi?article=1243&context=jtlp.

[90] Ben Sperry, Broadband Deployment, Pole Attachments, & the Competition Economics of Rural-Electric Co-ops, Truth on the Mkt. (Aug. 16, 2023), https://truthonthemarket.com/2023/08/16/broadband-deployment-pole-attachments-the-competition-economics-of-rural-electric-co-ops.

[91] Accelerating Wireline Broadband Deployment by Removing Barriers to Infrastructure Investment, Fourth Report and Order, Declaratory Ruling, and Third Further Notice of Proposed Rulemaking, WC Docket No. 17-84, FCC 23-109 (rel. Dec. 15, 2023), https://docs.fcc.gov/public/attachments/FCC-23-109A1.pdf; see also Westling, The Cost of Holding Up Broadband, supra note 5.

[92] Westling, The Cost of Holding Up Broadband, supra note 5.

[93] Broadband Infrastructure Deployment, 86 Fed. Reg. 68,553 (Dec. 3, 2021), https://www.federalregister.gov/documents/2021/12/03/2021-26231/broadband-infrastructure-deployment; see also 23 C.F.R. § 645.307(a); MOBILE NOW Act § 607, Pub. L. No. 115-141, div. P, tit. VI, 132 Stat. 1097, 1104 (2018); U.S. Gov’t Accountability Off., GAO-26-107734, Broadband Infrastructure: States’ Reported Progress Implementing Requirements to Facilitate Deployment Along Federal-Aid Highways (2026), https://www.gao.gov/products/gao-26-107734.

ICLE Issue Brief

Learning From Losses: Why Article 102 Needs Its Airtours Moment

Executive Summary The European Commission responded very differently to two sets of courtroom defeats. After the General Court annulled the merger prohibitions in Airtours, Schneider, . . .

Executive Summary

The European Commission responded very differently to two sets of courtroom defeats. After the General Court annulled the merger prohibitions in Airtours, Schneider, and Tetra Laval in 2002, the Commission launched sweeping institutional, procedural, and substantive reforms. Its response to the later annulments of infringement decisions under Article 102 of the Treaty on the Functioning of the European Union (TFEU), which prohibits abuse of a dominant position, has been far narrower.

The 2002 merger judgments exposed weak internal checks, procedural defects, insufficient evidence, and economic analysis too dependent on market structure. The Commission responded by reorganizing merger review, strengthening the Hearing Officer, creating independent economic and peer review, expanding parties’ access to evidence, and adopting a broader effects-based legal framework. These reforms improved the Commission’s ability to test its theories before acting and produce decisions capable of surviving judicial review.

Intel, Qualcomm, and Bulgarian Energy Holding revealed similar weaknesses in Article 102 enforcement. The courts found failures to document and disclose relevant third-party evidence, consider exculpatory material, and connect theories of harm to realistic exclusionary effects. The judgments confirm that the Commission retains discretion to pursue legitimate theories of abuse. It must, however, support those theories with coherent evidence, respect the rights of defense, and show that the challenged conduct could exclude competitors under actual market conditions.

These decisions warrant a targeted review of the safeguards governing Article 102 investigations. The revision of Regulation 1/2003 should strengthen interview records, case-file completeness, access to evidence, independent economic review, and internal challenges to case teams’ conclusions. The Commission’s draft Article 102 guidelines should also reflect the courts’ effects-based jurisprudence rather than rely on presumptions that substitute conduct categories for competitive analysis. Strong internal checks will conserve enforcement resources, improve legal certainty, and reinforce the legitimacy of Commission decisions as competition policy faces greater political and industrial-policy pressures.

Introduction

The European Commission has responded very differently to two sets of courtroom defeats. In 2002, the Court of First Instance—now the General Court—annulled three merger prohibitions in quick succession: Airtours, Schneider, and Tetra Laval.[1] The reversals became the Commission’s “Airtours moment.” It quickly launched major institutional, procedural, and substantive reforms. That reform project continues in its April 2026 draft merger guidelines.

More recently, European Union courts overturned Commission infringement decisions under Article 102 of the Treaty on the Functioning of the European Union (TFEU), which prohibits abuse of a dominant market position. The principal cases were Intel, Qualcomm, and Bulgarian Energy Holding.[2] These decisions echoed the 2002 merger cases. Across both groups, the courts stressed the rights of defense and to be heard, including access to a complete evidentiary file and exculpatory material; analysis of competitive effects grounded in actual market conditions; and evidence strong enough to support the Commission’s theory of harm.

Yet the Commission’s responses diverged. It answered the 2002 judgments with broad merger reforms. Its response to the Article 102 judgments has been narrower and, in one important respect, counterintuitive. The Commission’s 2024 draft Article 102 guidelines rely more heavily on conduct categories and presumptions, even as the case law demands evidence that conduct can exclude competitors.

Merger review and unilateral-conduct enforcement differ in important ways. Merger analysis asks what a proposed transaction is likely to do, usually under tight statutory deadlines. Article 102 cases examine past conduct and often unfold over years. Yet the same institutional principle links both fields: Sound internal checks and strong due-process protections improve accuracy and produce decisions more likely to survive judicial review. That premise matters as European competition enforcement faces heightened public and political scrutiny.

Section 1 of this issue brief examines the merger annulments in Airtours, Schneider, and Tetra Laval. Section 2 considers the institutional, procedural, and substantive reforms that followed. Section 3 turns to the Article 102 annulments in Intel, Qualcomm, and Bulgarian Energy Holding. Section 4 draws together the broader implications, and Section 5 concludes.

I. The Airtours Moment: Three Merger Annulments

European merger control reached what contemporary observers called its “high watermark” between 1999 and 2001. The European Commission prohibited an unprecedented five transactions in 2001 alone, drawing the attention of business leaders and investors worldwide to its merger-review process.[3]

That record of aggressive enforcement met a sharp judicial response in 2002. Within five months, the General Court annulled the Commission’s merger prohibitions in Airtours, Schneider, and Tetra Laval. No European Union court had previously annulled a Commission merger prohibition. The three judgments therefore challenged both the outcomes of these cases and the methods that produced them.

The judgments exposed three related weaknesses. The Commission’s institutional structure lacked effective internal checks and procedural safeguards. Its evidence did not meet the required legal standard. And its analysis relied too heavily on formal indicators such as market shares and concentration, without adequately establishing the likely competitive effects. By scrutinizing the Commission’s evidence and economic reasoning more closely, the court established principles that reshaped European merger control and drove reforms that continue to influence it today.

A. Weak Internal Checks and Procedural Safeguards

One contemporary account described the Airtours, Schneider, and Tetra Laval judgments as exposing a “poorly organized merger review process” in which the Commission failed to compile evidence carefully or ground its decisions in sufficient facts.[4]

The criticism centered on the Commission’s institutional structure for merger review. Within the Directorate-General for Competition (DG Competition), the Merger Task Force assessed the evidence, developed a theory of harm—an explanation of how a merger could harm competition—decided whether the evidence established that theory, and recommended either approval, approval subject to conditions, or prohibition.[5]  Effective internal safeguards did not adequately counterbalance this concentration of responsibilities. In Airtours, Schneider, and Tetra Laval, the General Court ultimately found that the evidence did not support the Commission’s decisions.

In Schneider, the General Court found that the Commission’s Statement of Objections—the formal document setting out its competition concerns—“did not permit Schneider to assess the full extent of the competition problems” alleged by the Commission.[6] That omission denied Schneider an opportunity to propose, “properly and in good time,” remedies broad enough to address those concerns.[7] Because remedies offered the only practical means of avoiding prohibition, the court considered this defect especially serious. It held that the Commission had violated Schneider’s rights of defense in several respects, invalidating the decision.[8]

The reasoning in Airtours was similar. The Commission’s manifest errors deprived Airtours of a meaningful opportunity to propose effective remedies. The Commission neither articulated its theory of harm clearly nor disclosed it early enough, then rejected Airtours’ final commitments because they came too late in the process.

In Tetra Laval, the General Court restated the principles governing access to the Commission’s case file.[9] Access allows parties to exercise their rights of defense effectively, particularly when they face an adverse decision, fine, or penalty. Although denying adequate access can justify annulment, the court found no such violation in Tetra Laval.[10]

More broadly, the three cases exposed the costs of weak internal checks. Without an effective mechanism for identifying evidentiary and analytical flaws early, judicial review became even more important. The reforms discussed below targeted these weaknesses.

B. The Commission’s Evidentiary Burden

The second strand of the merger judgments concerned the evidence needed to justify prohibition. In Airtours, the General Court held that the Commission must produce “convincing evidence” of its theory of harm[11] and “prove conclusively” that the merger would create an anticompetitive market structure.[12] The alleged harm was collective dominance—a situation in which several firms can coordinate their conduct without an express agreement.

The Commission fell short. The court found that, “far from basing its prospective analysis on cogent evidence,” the Commission had made fundamental errors in assessing whether the merger would create collective dominance. [13]  It therefore had not proved to the required legal standard that the merger would impede effective competition.

The General Court identified similar defects in Schneider. It called some of the Commission’s findings “abstract,”[14] found that the supporting evidence was sometimes insufficient,[15] and criticized other findings as lacking evidence or precision.[16] Taken together, these errors deprived the Commission’s economic assessment of probative value—the capacity to prove the proposition for which it was offered.[17]

In Tetra Laval, the Commission likewise failed to meet its burden. It had not shown convincingly that Tetra Laval could leverage its dominant position—use market power in one market to gain dominance in another—or that eliminating Sidel as a potential competitor would strengthen the merged company’s position.[18] The court found “no cogent evidence” supporting the latter claim.[19]

Because merger review requires predictions about future market conditions, the court required “sufficiently convincing” evidence and a “particularly plausible” forecast.[20] It found neither.[21]

C. From Market Structure to Competitive Effects

The General Court did not reject the theories of harm themselves: collective dominance in Airtours and conglomerate leveraging in Tetra Laval. Instead, it demanded rigorous economic analysis showing that the predicted anticompetitive effects were likely. In Schneider, the court found that the Commission had not met its burden of proof. Its analysis lacked a coherent economic foundation because it did not properly evaluate countervailing evidence and relied on inconsistent or unclear market definitions.[22] The judgment shifted the inquiry away from formal indicators such as market structure, market shares, and concentration measures and toward likely competitive effects.

In Airtours, the Commission relied heavily on a reduction from four major competitors to three. It argued that the remaining firms would have strong incentives to coordinate tacitly—that is, align their conduct without an express agreement. The General Court held that this structural change alone could not establish collective dominance. The required prospective analysis “calls for close examination in particular of the circumstances which are relevant for assessing the effects of the concentration on competition,” supported by convincing evidence.[23]

The court then identified conditions relevant to whether tacit coordination could endure. Consumers might defeat it by switching to smaller competitors. Coordination might also unravel if the three large firms lacked an effective way to punish a member that departed from their shared course of conduct.[24] By requiring evidence on these mechanisms, the court aligned the legal concept of collective dominance with the economic concept of tacit coordination and supplied a framework for future cases.[25]

In Tetra Laval, the General Court recognized that the Merger Regulation can reach conglomerate mergers—transactions involving firms in neighboring or complementary markets.[26] But the Commission had to establish the alleged conglomerate effects through cogent evidence, not speculation about future conduct.[27] It needed “sufficiently convincing evidence” of both the likelihood and the consequences of leveraging and could consider only conduct that probably would be lawful.[28] Although the Commission retained some discretion, its prediction of the merged company’s conduct had to be “particularly plausible.”[29]

Nicholas Levy summarized the resulting standard: The Commission must show more than the mere possibility of leveraging. It must establish that the merger would, in all likelihood and in the relatively near future, create or strengthen a dominant position based on close examination of the relevant circumstances.[30] Together, these cases largely cemented an effects-based approach to European merger control.

II. From Judicial Defeat to Merger Reform

The three annulments arrived at a pivotal point in the Commission’s modernization of European merger control. The Commission had submitted a report to the Council in 2000, published a Green Paper reviewing the existing Merger Regulation in December 2001, and opened a public consultation.[31] Airtours, Schneider, and Tetra Laval transformed that planned modernization into a broader and more urgent overhaul. As Nicholas Levy observed, “the judicial defeats of 2002 provided the catalyst for a series of reforms” intended to make merger review “more structured, firmly grounded in sound economics, and consistently based on an objective assessment of quantitative evidence.”[32]

European Competition Commissioner Mario Monti acknowledged in November 2002 that the judgments, “no matter how painful, came at a right moment.” He urged the Commission to turn those setbacks into “an opportunity for even deeper reform than originally envisaged” and announced what he called “the most far-reaching reform” of European merger control since the first Merger Regulation took effect in 1989.[33]

The Commission approved the core reform package in December 2002 and implemented its principal elements through 2004. The package combined institutional, procedural, and substantive changes: stronger internal checks and independent economic review; earlier access to evidence and greater engagement with merging parties; and a revised Merger Regulation, new horizontal-merger guidelines, and a more effects-based analytical framework. Together, these reforms addressed the central weaknesses identified in the three judgments and reshaped how the Commission investigated, analyzed, and decided merger cases.

A. Building Internal Checks and Economic Expertise

European European Competition Commissioner Mario Monti responded to the merger annulments by strengthening the Directorate-General for Competition’s internal checks and balances.[34] He treated the quality of the decision-making process as central to the reform:

We will adopt changes, as radical as needed, to ensure that our merger investigations are conducted in a manner which is more thorough and more firmly grounded in economic reasoning and to further strengthen the due process guarantees built into our merger proceedings.[35]

Monti first reorganized merger review. He disbanded the centralized Merger Task Force and placed merger units within the agency’s sector-specific directorates. He also created the position of chief economist, who reported directly to the director-general and led a team charged with providing independent economic analysis and advising decision-makers at every level of an investigation.

Monti further established peer review panels composed of experienced Directorate-General officials who had not worked on the case. The panels reviewed case teams’ preliminary conclusions and challenged their assumptions. Monti explained that this independent scrutiny would counter investigators’ natural tendency to become convinced by their own arguments. A dedicated support unit helped make the panels an effective check on the soundness of preliminary findings.[36]

The reforms also expanded the Hearing Officer’s mandate, emphasizing the independence and integrity needed to preserve objective, transparent, and efficient proceedings.[37] The Hearing Officer reported to the competition commissioner rather than the Directorate-General, strengthening the office’s ability to protect merging parties’ rights of defense and oversee the fair conduct of proceedings.[38]

Pablo Ibáñez Colomo later connected these reforms to the broader value of judicial review:

One can think of a number of reasons why more robust checks on administrative action might lead to better outcomes, both from a legal and a non-legal standpoint. This conclusion is, if anything, confirmed by the very history of EU merger control, which shows that efforts to improve enforcement may be prompted by judicial review.[39]

The reforms following Airtours, Schneider, and Tetra Laval illustrate that principle. More extensive judicial review prompted the Commission to build stronger internal safeguards, deepen its economic expertise, and improve the quality of merger decisions.

B. Earlier Access and Procedural Engagement

The Commission answered criticism of its fact-finding on two fronts. Internally, the new checks and balances allowed officials outside the case team to test its preliminary findings before the Commission reached a formal decision. Greater management oversight also helped ensure that investigations received adequate resources. Monti instructed managers to “see to it that due attention is paid to the quality of evidence, and to ensuring that decisions reference such evidence clearly and comprehensively.”[40]

The Commission also gave notifying parties—the companies seeking merger approval—earlier access to the evidentiary record and the case team. Once the Commission opened an in-depth, or Phase II, investigation through an Article 6(1)(c) decision, the parties could review the file and receive ad hoc access to important third-party submissions that contradicted their position. This earlier disclosure allowed them to challenge those submissions before the Commission issued its statement of objections, rather than waiting until the Commission had formally set out its concerns.

The reforms created additional opportunities for direct engagement. Before issuing a statement of objections, the Commission could hold “triangular” meetings among the case team, the notifying parties, and third-party complainants. It also introduced state-of-play meetings at decisive stages of an investigation, giving the parties opportunities to discuss the case with senior Directorate-General for Competition officials. [41]

The Commission formalized these changes in its Best Practices on the Conduct of EC Merger Control Proceedings, adopted Jan. 20, 2004.[42] The Merger Best Practices provide that, immediately after the Commission opens an in-depth investigation, notifying parties should receive key documents, including “substantiated submissions of third parties running counter to the notifying parties’ own contentions.”[43] The Directorate-General also committed to “use its best endeavours” to provide timely access to those documents and to make further disclosures on an ad hoc basis as the investigation developed.[44]

Together, these measures moved evidentiary testing earlier in the process, when merging parties could still correct the factual record, answer third-party allegations, and address the Commission’s concerns before its position hardened.

C. Embedding Effects-Based Merger Analysis

Monti also announced guidelines that would provide a “sound economic framework” for assessing horizontal mergers—transactions between actual or potential competitors. The guidelines would explain how the Commission assesses a merger’s likely competitive effects and applies the concept of collective dominance. They would also address factors that could counter an initial finding of likely harm, including buyer power, ease of entry, and efficiencies.[45]  The Commission adopted its Horizontal Merger Guidelines in 2004.[46]

The Commission gave this economic framework institutional support by creating the position of chief competition economist and recruiting more economists who specialized in how firms compete and markets operate.[47] These changes helped translate the guidelines’ effects-based principles into case investigations and decisions.

The reforms also changed the law governing merger review. The revised European Community Merger Regulation (ECMR), Regulation 139/2004, took effect May 1, 2004. It replaced the former dominance test with a broader inquiry into whether a transaction would “significantly impede effective competition in the common market or in a substantial part of it, in particular as a result of the creation or strengthening of a dominant position.” The new test retained dominance as a central concern but allowed the Commission to reach mergers that could substantially harm competition without creating or strengthening a dominant firm. Without the General Court’s judgments in Airtours, Schneider, and Tetra Laval, the substantive test likely would have remained largely unchanged.[48]

Two decades later, Guillaume Loriot, deputy director-general for mergers at the Directorate-General for Competition, credited the judgments with forcing the Commission into “deeper retrospection.” That process, he said, enabled “more rigorous, and all-encompassing reforms” that changed European Union merger control “for the better.”[49]

The Commission extended that reform trajectory when it published draft revised merger guidelines April 30, 2026, combining its horizontal and nonhorizontal guidelines into a single framework.[50] Executive Vice President Teresa Ribera had previewed the draft’s “more robust treatment of dynamic effects”—effects on innovation, investment, and competition over time—including both dynamic harms and efficiencies.[51]

That emphasis carries forward the central lesson of Airtours, Schneider, and Tetra Laval: The Commission must ground predictions of competitive harm in rigorous economic analysis and convincing evidence.

III. Article 102 Meets Closer Judicial Scrutiny

The Commission entered the Intel litigation with a formidable record in Article 102 appeals. Thibault Schrepel and Janneke Parrish identify Intel as its only Article 102 loss before the Court of Justice during Margrethe Vestager’s decade as competition commissioner.[52] Pinar Akman accordingly describes the 2017 ruling as “a clear turning point in the evolution of the law on the abuse of dominance.[53]

The Intel litigation ultimately produced three principal judgments: Intel 2017, which set aside the General Court’s 2014 judgment; Intel Renvoi, which annulled the Commission’s findings concerning Intel’s rebates and the resulting fine; and Intel 2024, which upheld the remand judgment.[54] The General Court later annulled Commission infringement decisions in Qualcomm and Bulgarian Energy Holding. Those judgments form part of a broader line of Article 102 cases demanding careful treatment of evidence and rigorous analysis of exclusionary effects.[55]

The cases echo the 2002 merger judgments in three respects. First, they require the Commission to document and disclose relevant third-party evidence, while distinguishing procedural lapses that materially impair a company’s defense from those that do not. Second, they require the Commission to consider evidence supporting and undermining its theory and to meet its burden with a coherent factual record. Third, they test theories of exclusion against actual market conditions, requiring evidence that the challenged conduct was capable of producing more than hypothetical anticompetitive effects. The courts did not deny the Commission discretion to pursue particular theories of harm. They instead required the Commission to prove that those theories fit the facts.

A. Access to the File and Rights of Defense

The three Article 102 judgments returned to a central theme of the merger cases: The Commission must give investigated companies a meaningful opportunity to test the evidence against them and present a full defense. That obligation covers evidence supporting the alleged infringement and potentially exculpatory material—evidence that could help disprove it—obtained through interviews with third parties. In Qualcomm and Bulgarian Energy Holding, failures to record and disclose such evidence materially impaired the companies’ ability to defend themselves. Intel involved a similar recordkeeping failure, but the courts found that it did not justify annulment.

Intel argued that the Commission had withheld potentially exculpatory information from a third-party interview, refused access to other third-party documents, and improperly denied a second oral hearing. The internal note that the Commission eventually disclosed contained no meaningful account of the interview, including “any indication of the content of the discussions” or “the nature of the information” that the interviewee had provided.[56] The Court of Justice nevertheless concluded that Intel had not shown that access to a fuller record during the administrative proceeding could have improved its defense.[57]

The Intel litigation clarified the Commission’s obligation to document third-party interviews.[58] The Commission must make an adequate record of every interview conducted to collect information about an investigation, including the substance of the information provided. This procedural duty complements the broader requirement that competition authorities meaningfully examine evidence submitted by an investigated company to show that its conduct could not restrict competition.[59] A failure to document an interview does not automatically invalidate a decision, but it may do so when the missing information could have materially assisted the company’s defense.

Qualcomm illustrates that distinction. The Commission’s 2018 decision found that Qualcomm had abused its dominant position by paying Apple to obtain its baseband chipsets exclusively from Qualcomm.[60] The General Court annulled the decision in full, relying on procedural defects that impaired Qualcomm’s rights of defense and flaws in the Commission’s analysis of competitive effects. It found that “the administrative procedure which led to the adoption of the contested decision is vitiated by a number of procedural errors which affected the applicant’s rights of defence.”[61] Alfonso Lamadrid described the court’s willingness to annul an Article 102 decision in full after finding such procedural errors as extraordinary.[62]

The Commission had failed to record properly or disclose fully several meetings and interviews with Qualcomm’s competitors and customers.[63] The General Court examined the withheld information’s probative value to determine whether the omissions had impaired Qualcomm’s defense. Some of that information went to a central issue: whether Intel had a viable competing chipset that Qualcomm’s payments could have excluded from the market.[64] Lamadrid argued that the judgment did not create new law but “simply requires the Commission to fulfill its (post-Intel) obligations regarding both procedure and substance” through a “clear, logical and thorough application of the law.”[65]

The General Court applied the same principles in Bulgarian Energy Holding. The Commission’s 2018 BEH Gas decision found that the Bulgarian Energy Holding (BEH) Group had restricted competitors’ access to essential gas infrastructure.[66] he court annulled that decision Oct. 25, 2023, on both substantive and procedural grounds. Although it upheld one isolated instance of exclusionary conduct, that conduct could not support the Commission’s finding of a single and continuous infringement.[67] The Commission appealed, and the case remained pending as of Aug. 31, 2026.[68]

The General Court also found that the Commission had infringed the BEH Group’s rights of defense by failing to document certain third-party interviews and disclose potentially exculpatory evidence. The omitted information proved important to BEH’s defense and contributed to the Commission’s decision. The court rejected any “supposed discretion” to exclude relevant evidence from the file. Such discretion would impair the undertaking’s defense and prevent the court from verifying the Commission’s compliance with Regulation 1/2003.[69]

Drawing on Intel and Qualcomm, the court reiterated that the Commission must record third-party meetings and interviews and give the investigated undertaking access to every document that might assist its defense. The principal exceptions cover other companies’ business secrets, internal Commission documents, and other confidential information.[70] Access to the file promotes equality of arms—the principle that each side must have a fair opportunity to present its case—and remains “integral” to the rights of defense.[71]

These cases establish a materiality standard rather than a rule of automatic annulment. In Intel, the inadequate record concerned one meeting with one third party, and Intel had received at least limited information about its contents. The General Court was therefore not persuaded that the omission materially impaired Intel’s defense.[72] Qualcomm involved an “exceptional number of procedural violations”: seven improperly recorded meetings with six third parties, including one meeting central to the Commission’s analysis and another involving a source who claimed anonymity.[73] BEH likewise involved omitted evidence that bore directly on the company’s defense and the Commission’s conclusions.

The parallel with the 2002 merger cases is direct. Airtours, Schneider, and Tetra Laval exposed investigative and decision-making powers insufficiently constrained by procedures capable of identifying unsupported conclusions before the Commission acted. Intel, Qualcomm, and Bulgarian Energy Holding reveal similar weaknesses in Article 102 enforcement. The later judgments therefore reinforce Monti’s earlier recognition that third parties can influence Commission investigations and that investigated companies need timely, meaningful opportunities to test their allegations and defend themselves.[74]

B. Evidence of Exclusionary Effects

The three Article 102 cases echoed the evidentiary concerns in Airtours, Schneider, and Tetra Laval. In each case, the court found that the Commission’s analysis had disregarded relevant evidence, including information that undermined its theory of harm. Merger review and Article 102 enforcement ask different legal questions: Merger review predicts a transaction’s likely effects, while Article 102 generally examines whether past conduct was capable of excluding competitors. Both inquiries nevertheless require concrete evidence grounded in actual market conditions, not abstract or hypothetical conclusions.

In Intel Renvoi, the General Court found that the Commission had not established to the required legal standard that Intel’s rebates were capable of foreclosing competitors.[75] The Commission had to examine all relevant circumstances and support its conclusion with a “precise and consistent body of evidence” that left “no residual doubt.” That obligation carried particular weight because Intel had offered a plausible alternative explanation for its conduct—one under which the rebates could not restrict competition or produce the alleged foreclosure effects.[76]

Jacques Buhart et al. identified three related defects in the Commission’s effects analysis in Qualcomm. First, the evidence was inconsistent or contradictory. Second, the Commission failed to consider “all the relevant factors,” including evidence that undercut its theory. Third, the remaining evidence “did not make it possible to support the Commission’s findings.” The analysis therefore could not substantiate the Commission’s conclusions to the required legal standard.[77]

The General Court applied the same evidentiary discipline in Bulgarian Energy Holding. The case involved an alleged refusal to grant access to an essential facility—infrastructure that competitors needed to operate in the related market. The Commission bore the burden of proving that the refusal was capable of producing exclusionary effects. More specifically, it had “to prove that that refusal was liable to eliminate all competition, on the part of the person requesting that service, on the related market.”[78] The Commission also had to establish that the complainant was an actual or potential competitor with a “sufficiently advanced project to enter the market.”[79]

The Commission failed to make that showing. In both Qualcomm and Bulgarian Energy Holding, the evidence did not establish that the firms allegedly excluded were viable actual or potential competitors. Without that connection between the challenged conduct and a realistic prospect of entry or expansion, the alleged exclusionary effects remained hypothetical.

These judgments do not require proof of actual anticompetitive effects in every Article 102 case. They do require the Commission to demonstrate, through coherent evidence and a complete assessment of market conditions, that the conduct was capable of producing those effects. That requirement reflects the same principle that shaped the merger judgments: A legally plausible theory of harm cannot substitute for proof that the theory fits the facts.

C. Testing Theories Against Market Reality

As w in the merger cases, the courts did not prevent the Commission from pursuing particular theories of harm in Intel, Qualcomm, or Bulgarian Energy Holding. They instead required rigorous economic analysis showing that the alleged exclusionary effects were plausible under actual market conditions.

The Court of Justice began that shift in its 2017 Intel decision.[80] When a dominant undertaking submits evidence that its loyalty rebates could not restrict competition, the Commission must examine all relevant circumstances. The court identified five factors: the practice’s market coverage, the conditions governing the rebates, their duration, their amount, and evidence of a strategy to exclude competitors as efficient as the dominant undertaking.[81]

On remand, the General Court examined the Commission’s application of the as-efficient-competitor (AEC) test. That test asks whether the challenged conduct could exclude a hypothetical competitor that operates as efficiently as the dominant firm. The court found errors in the Commission’s analysis and held that it had not adequately established the rebates’ capacity to foreclose such a competitor. It therefore annulled the relevant portions of the 2009 decision and the fine.[82]

The Commission appealed, but the Court of Justice upheld the Intel Renvoi judgment in October 2024.[83] It confirmed that the General Court must examine any argument capable of undermining the Commission’s AEC analysis, including challenges to the governing methodology and the probative value of the evidence. The resulting framework looks beyond structural indicators. It requires the Commission to assess the alleged exclusionary effect in light of all relevant facts, including market coverage, the terms and duration of the rebates, their amount, and any strategy to exclude as-efficient competitors.[84]

The General Court applied the same approach in Qualcomm. Although the procedural violations independently justified annulment, the court also reviewed the substance of the Commission’s decision in the interests of the administration of justice.[85] The Commission had failed to account for evidence that competing chipsets could not satisfy most of Apple’s technical requirements. Because Apple could not have switched those purchases to Qualcomm’s rivals even without the challenged payments, the payments could not have excluded competition for that demand.[86]

The court rejected an analysis based on a presumption that Qualcomm’s exclusivity payments were unlawful. It required the Commission to consider all relevant factual circumstances and establish effects that were more than hypothetical.[87] As the court explained:

[N]ot every exclusionary effect is necessarily detrimental to competition. Competition on the merits may, by definition, lead to the departure from the market or the marginalisation of competitors that are less efficient and so less attractive to consumers from the point of view of, among other things, price, choice, quality or innovation.[88]

Once Qualcomm challenged the Commission’s analysis, the Commission had to assess both the payments’ capacity to produce anticompetitive effects and their ability to foreclose at least as-efficient competitors.[89]

Bulgarian Energy Holding applied the same principle to a refusal-to-supply theory. The General Court emphasized that conduct restricting another company’s options does not necessarily restrict competition within the meaning of Article 102.[90] The Commission had to prove that the refusal to grant access to essential infrastructure was “liable to eliminate all competition, on the part of the person requesting that service, on the related market.”[91] The alleged exclusionary effects could not remain purely hypothetical.[92]

That inquiry required evidence that the party seeking access was an actual or potential competitor with a “sufficiently advanced project to enter the market.”[93] The complainant’s plans remained imprecise, and it had made no tangible access request that could support a credible refusal-to-supply claim.[94] The Commission therefore failed to show that the BEH Group’s conduct was capable of restricting competition in the Bulgarian gas market.[95]

Together, these cases move Article 102 analysis away from conclusions based principally on market structure, the form of the conduct, or presumptions of harm. The relevant question is how the conduct operates under actual market conditions, including whether a credible rival could enter, expand, or compete effectively. Ibáñez Colomo has similarly linked stronger judicial review to improvements in Commission enforcement and greater checks on administrative action.[96]

Akman argues that the shift toward economic, effects-based analysis emerged “through not wins but losses for the Commission and/or the Legal Service on appeals.” In her account, “[i]t is the CJEU which has actively—and perhaps despite the Commission and/or the Legal Service—reformed its jurisprudence to adopt an effects-based approach.”[97] As in the merger cases, judicial reversal supplied the pressure for doctrinal reform.

IV. Judicial Defeat and Institutional Learning

Successful challenges to Commission merger prohibitions were so rare before Airtours, Schneider, and Tetra Laval that an appeal could appear futile. The three annulments changed that perception by demonstrating that merger decisions faced meaningful judicial oversight. Commisioner Monti acknowledged that the judgments proved “beyond any doubt” that European Union courts conducted “meticulous and stringent” review of the Commission’s substantive analysis. He also recognized the practical consequence: “[I]t is clear that the [General Court] is now holding us to a very high standard of proof, and this has clear implications for the way in which we conduct our investigations and draft our decisions.”[98] Werner Berg summarized the lesson: The Commission had to strengthen its substantive review and economic analysis to produce decisions capable of surviving “in-depth juridical review.”[99]

The Commission had compiled a similarly strong record defending its Article 102 decisions before Intel, Qualcomm, and Bulgarian Energy Holding. Yet those judgments did not prompt a comparable public reckoning. The Commission’s responses to Qualcomm and Bulgarian Energy Holding largely stated that it would study the judgments and consider its next steps.[100] Its appeals in Intel and Bulgarian Energy Holding may suggest that it viewed the General Court’s judgments primarily as legal errors requiring appellate correction rather than evidence of broader institutional problems. The appeals cannot, however, substitute for a clear account of what lessons the Commission accepted or rejected.

This section examines that gap from two perspectives. First, it asks whether the revision of the European Union’s antitrust procedural rules should strengthen internal review, recordkeeping, access to evidence, and other safeguards implicated by the Article 102 judgments. Second, it considers whether the Commission’s draft Article 102 guidelines reflect the courts’ effects-based jurisprudence or retreat toward conduct categories and presumptions. The central question is whether the Commission has absorbed the judgments’ lessons internally—or missed an opportunity for a second Airtours moment.

A. Reform Without a Second Airtours Moment?

The cases examined above show how procedural failures can affect both the reliability of Commission decisions and the depth of judicial scrutiny. The 2004 merger reforms stand out because the Commission did more than address the specific due-process defects identified by the General Court. It changed the institutional structure of merger review. Independent economic analysis, peer review, greater management oversight, and earlier access to evidence allowed the Commission to test case teams’ conclusions before adopting a decision. These safeguards could expose weaknesses in the evidentiary record and reduce the risk of decisions unsupported by facts or plausible real-world effects. Many of the most consequential changes required no new legislation because the Commission could adopt them internally.

The resulting checks and balances were not confined to merger review. Many applied across the Commission’s competition-enforcement system, including Article 102 investigations.[101] Yet Intel, Qualcomm, and Bulgarian Energy Holding raise a difficult question: Do those safeguards operate effectively in abuse-of-dominance cases? The Commission has said little about the procedural implications of these defeats, despite judicial criticism at times comparable to that in the 2002 merger judgments.

European Commission President Ursula von der Leyen directed Executive Vice President Teresa Ribera to “strengthen and speed up enforcement of competition rules” and align that enforcement with the European Union’s industrial and sustainability goals.[102] The Commission then opened a public consultation July 10, 2025, on revising Regulation 1/2003 and its implementing regulation, Regulation 773/2004—the principal procedural rules governing EU antitrust investigations.[103] That revision offers a natural opportunity to examine the Commission’s internal investigative and decision-making processes, including how it records interviews, maintains complete case files, discloses exculpatory material, tests case teams’ conclusions, and ensures meaningful access to evidence.

Stakeholders have already argued that Intel and Qualcomm warrant tighter internal procedures, particularly rules ensuring complete investigatory files and effective access to relevant evidence.[104] Stronger and faster enforcement remains a legitimate goal, but speed can strain the rights of defense when internal safeguards fail. Procedural protections do not merely constrain enforcement. They improve its accuracy, strengthen its legitimacy, and make Commission decisions more likely to survive judicial review. The revision of Regulation 1/2003 should confront that relationship directly.

B. Effects in Principle, Presumptions in Practice

Intel, Qualcomm, and Bulgarian Energy Holding show that European Union courts can engage closely with complex economic questions. The courts examined the Commission’s evidentiary record, tested the probative value of its evidence, and scrutinized its economic models. This review does not reflect hostility toward Article 102 enforcement. Google Shopping illustrates the other side of the principle: The General Court accepted the Commission’s extensive factual and economic record, and the Court of Justice upheld that judgment and the €2.42 billion fine.[105] The Commission may therefore have absorbed some practical lessons by developing more detailed foreclosure theories, counterfactual analyses, and economic evidence in its cases.

The Commission has not publicly explained how Intel, Qualcomm, and Bulgarian Energy Holding affected its approach. Its August 2024 draft guidelines on exclusionary abuses do not resolve the question, and the guidelines remained in draft form as of Aug. 31, 2026.[106] The Commission has said the guidelines will reflect its enforcement experience and codify the courts’ Article 102 jurisprudence since its 2008 guidance on enforcement priorities.

A March 2023 policy brief from the Directorate-General for Competition described that jurisprudence in strongly effects-based terms. It stated that “[t]he effects-based approach promoted by the Commission is clearly reflected in these developments and is now firmly enshrined in the Union Courts’ case law.” The brief added that recent judgments had “confirmed and endorsed the main elements of an effects-based approach to exclusionary conduct by dominant undertakings.”[107]

The draft guidelines have nevertheless drawn criticism for selectively presenting the case law and reviving a more form-based approach. An effects-based approach asks how conduct is likely to operate under actual market conditions. A form-based approach relies more heavily on the category into which the conduct falls and presumptions attached to that category. The draft guidelines identify some conduct as presumptively capable of producing exclusionary effects, potentially shifting the evidentiary burden away from the Commission’s affirmative demonstration of competitive harm.

Pinar Akman, Chiara Fumagalli, and Massimo Motta argue that the draft uses the case law selectively, particularly the judgments beginning with Intel.[108] Dirk Auer and Lazar Radic characterize its reliance on conduct categories and presumptions as a repudiation of the courts’ effects-based analysis.[109] Akman, Fumagalli, and Motta identify the central tension:

[The draft guidelines] do not embrace aspects of the case law that are effects-orientated and either overemphasise the operational value of certain concepts (e.g. “competition on the merits”) from the formalistic era of the case law or disregard statements from the case law that evidence an effects-based approach.[110]

The Article 102 jurisprudence is complex and does not always yield a single, coherent narrative.[111] The cases examined here are nonetheless clear on three points. The Commission must respect procedural rights, consider evidence that supports and undermines its theory, and establish through cogent evidence that the conduct was capable of producing nonhypothetical exclusionary effects. Guidelines intended to codify that jurisprudence should make those requirements more transparent, not dilute them through presumptions that substitute the form of conduct for its likely competitive effect.

V. Conclusions

Judicial victories and defeats both clarify the law. Because Article 102 annulments remain rare, Intel, Qualcomm, and Bulgarian Energy Holding carry particular weight. Together, they clarify the Commission’s duties to maintain and disclose a complete evidentiary record, protect the rights of defense, satisfy the applicable standard of proof, and ground findings of exclusionary effects in actual market conditions. They also confirm that European Union courts can scrutinize complex economic evidence without displacing the Commission’s authority to select and pursue legitimate theories of harm.

The Commission need not redesign its procedures after every annulment. Targeted judicial corrections form part of any mature enforcement system. These cases do, however, raise broader concerns. Qualcomm and Bulgarian Energy Holding exposed material failures to record interviews, disclose relevant evidence, and preserve equality of arms. Intel, Qualcomm, and Bulgarian Energy Holding also revealed substantive analyses that did not adequately connect the challenged conduct to realistic exclusionary effects. The recurrence of these problems warrants closer examination of whether safeguards introduced after the 2002 merger judgments work as intended in Article 102 investigations.

That review should focus on practical mechanisms. The Commission should ensure that case files contain complete records of third-party interviews and all relevant inculpatory and exculpatory evidence. It should give investigated companies timely access to that material and meaningful opportunities to answer it. A better-resourced Hearing Officer, independent economic review, stronger management oversight, and peer review by officials outside the case team could also test preliminary conclusions before they harden. These safeguards would help counter investigators’ tendency to favor their initial theory, conserve limited enforcement resources, and produce decisions more likely to withstand judicial review.

The Commission’s current reform projects provide two opportunities to act. The revision of Regulation 1/2003 can strengthen investigative procedures, access to the file, and internal review. The Article 102 guidelines can provide substantive clarity by faithfully reflecting the courts’ effects-based jurisprudence. Presumptions may simplify analysis in appropriate cases, but they should not replace evidence that the conduct was capable of excluding competition under the relevant market conditions. Nor should they deprive investigated companies of a genuine opportunity to rebut the Commission’s theory.

These protections will matter even more as competition enforcement becomes intertwined with industrial-policy goals such as resilience and strategic autonomy. Those priorities may intensify political pressure on individual investigations and sharpen public scrutiny of the Commission’s decisions. Transparent standards, rigorous economics, and credible internal checks help preserve the independence and legitimacy of enforcement under those conditions.

The Article 102 judgments may not demand a replica of the post-Airtours reform package. But they do call for the same institutional willingness to learn from defeat.

[1] See Case T-342/99, Airtours plc v. Comm’n, 2002 E.C.R. II-2585; Case T-310/01, Schneider Electric SA v. Comm’n, 2002 E.C.R. II-4071; Case T-5/02, Tetra Laval BV v. Comm’n, 2002 E.C.R. II-4381.

[2] See Case C-413/14 P, Intel Corp. v. Comm’n, ECLI:EU:C:2017:632 [hereinafter Intel 2017]; Case T-286/09 RENV, Intel Corp. v. Comm’n, ECLI:EU:T:2022:19 [hereinafter Intel Renvoi]; Case C-240/22 P, Comm’n v. Intel Corp., ECLI:EU:C:2024:915 [hereinafter Intel 2024]; Case T-235/18, Qualcomm, Inc. v. Comm’n, ECLI:EU:T:2022:358; Case T-136/19, Bulgarian Energy Holding EAD v. Comm’n, ECLI:EU:T:2023:669.

[3] See, e.g., Airtours/First Choice, Schneider/Legrand, Tetra Laval/Sidel, and General Electric/Honeywell, as well as other transactions the Commission prohibited between 1999 and 2001, including Volvo/Scania, WorldCom/Sprint, SCA/Metsä Tissue, and CVC/Lenzing. See Nicholas Levy, EU Merger Control: A Brief History, Cleary Gottlieb (Feb. 3, 2004), https://www.clearygottlieb.com/-/media/organize-archive/cgsh/files/publication-pdfs/eu-merger-control—a-brief-history.pdf. Parties also withdrew several high-profile notifications when faced with likely prohibition, including Skandinaviska Enskilda Bank/FöreningsSparbanken and EMI/Time Warner.

[4] WilmerHale, After Three Losses, Super Mario Strikes Back (Jan. 1, 2003), https://www.wilmerhale.com/en/insights/publications/after-three-losses-super-mario-strikes-back-winter-2003.

[5] Werner Berg, New EC Merger Regulation: A First Assessment of Its Practical Impact, 24 Nw. J. Int’l L. & Bus. 683 (2004), https://scholarlycommons.law.northwestern.edu/cgi/viewcontent.cgi?article=1586&context=njilb (citing Christian Ahlborn, Airtours/First Choice, In Competition (June 2002)); Nicholas Levy, Mario Monti’s Legacy in EC Merger Control, 1 Competition Pol’y Int’l 99 (2005), https://www.clearygottlieb.com/-/media/organize-archive/cgsh/files/publication-pdfs/mario-monti-s-legacy-in-ec-merger-control.pdf; Herwig Hofmann, Good Governance in European Merger Control: Due Process and Checks and Balances Under Review, 24 Eur. Competition L. Rev. 114 (2003); Mathew Heim, Problems and Process: European Merger Control and How to Use It, 4 J. Pub. Affs. 73 (2004); Damien J. Neven & Lars-Hendrik Röller, Discrepancies Between Markets and Regulators: An Analysis of the First Ten Years of EU Merger Control, in The Pros and Cons of Merger Control 13 (Swedish Competition Authority ed., 2002), https://www.konkurrensverket.se/globalassets/dokument/informationsmaterial/rapporter-och-broschyrer/pros-and-cons/rapport_pros-and-cons_2002_the-pros-and-cons-of-merger-control.pdf.

[6] Schneider Electric, 2002 E.C.R. II-4071, ¶ 453.

[7] Id. ¶¶ 458, 460.

[8] Id. ¶¶ 454, 462.

[9] The Commission appealed the General Court’s Tetra Laval judgment, arguing that the court had interfered excessively and imposed an unduly high standard of proof for conglomerate effects. The CJEU dismissed the appeal, holding that the General Court acted within the proper scope of judicial review when it examined whether the Commission’s evidence was accurate, reliable, consistent, and sufficient to support its conclusions. See Case C-12/03 P, Comm’n v. Tetra Laval BV, ECLI:EU:C:2005:87, 2005 E.C.R. I-987.

[10] Tetra Laval, ECLI:EU:T:2002:264, ¶¶ 89, 92, 117.

[11] Airtours, 2002 E.C.R. II-2585, ¶ 63.

[12] Id. ¶ 210.

[13] Id. ¶ 294.

[14] Schneider Electric, 2002 E.C.R. II-4071, ¶ 409.

[15] Id. ¶¶ 349, 409.

[16] Id. ¶¶ 336, 398.

[17] Id. ¶ 411.

[18] See Mario Monti, European Comm’r for Competition, EU Competition Policy, Address at the Fordham Annual Conference on International Antitrust Law & Policy (Oct. 31, 2002), https://ec.europa.eu/commission/presscorner/api/files/document/print/en/speech_02_533/SPEECH_02_533_EN.pdf.

[19] Tetra Laval, 2002 E.C.R. II-4381, ¶ 137.

[20] Id. ¶ 162.

[21] Id. ¶ 246.

[22] Schneider Electric, 2002 E.C.R. II-4071, ¶ 437.

[23] Airtours, 2002 E.C.R. II-2585, ¶ 63.

[24] Id.

[25] Pablo Ibáñez Colomo, Law, Policy, Expertise: Hallmarks of Effective Judicial Review in EU Competition Law, 24 Cambridge Y.B. Eur. Legal Stud. 143 (2022), https://doi.org/10.1017/cel.2022.7.

[26] Mario Monti, European Comm’r for Competition, Merger Control in the European Union: A Radical Reform, Speech/02/545 (Nov. 7, 2002), https://ec.europa.eu/commission/presscorner/api/files/document/print/en/speech_02_545/SPEECH_02_545_EN.pdf.

[27] Tetra Laval, 2002 E.C.R. II-4381, ¶ 137.

[28] Id. ¶ 162.

[29] Id.

[30] Levy, supra note 3.

[31] European Commission, Green Paper on the Review of Council Regulation (EEC) No. 4064/89, COM (2001) 745 final (Dec. 11, 2001).

[32] Levy, supra note 3.

[33] Monti, supra note 26.

[34] Neither the General Court nor Commissioner Mario Monti used the term “checks and balances.” They instead discussed evidence, burdens of proof, Commission errors, judicial-review standards, and modernization. Commentators later used “checks and balances” to describe the actors who safeguard due process, procedural fairness, and objectivity in Commission decision-making. The Commission eventually adopted the term. In Merck/Sigma-Aldrich, the hearing officer identified the commissioner for competition and cabinet, senior Directorate-General for Competition officials, the relevant horizontal-coordination unit, the Chief Economist’s Team, the Legal Service, associated Commission services, the hearing officer, the Advisory Committee on Concentrations, and possible peer review. See Final Report of the Hearing Officer ¶ 32 & n.39, Case M.8181, Merck/Sigma-Aldrich (Apr. 30, 2021), https://ec.europa.eu/competition/mergers/cases1/202212/M_8181_8229078_2374_3.pdf; see also Directorate-General for Competition, European Commission, Proceedings for the Application of Articles 101 and 102 TFEU: Key Actors and Checks and Balances, https://competition-policy.ec.europa.eu/system/files/2021-04/key_actors_checks_balances_art_101_102_factsheet.pdf.

[35] Monti, supra note 26.

[36] Id.

[37] Pieter Van Cleynenbreugel, The Hearing Officer’s Extended Mandate: Whose Special Friend in the Conduct of EU Competition Proceedings?, 33 Eur. Competition L. Rev. 286 (2012).

[38] See Commission Decision 2001/462/EC, ECSC of 23 May 2001 on the Terms of Reference of Hearing Officers in Certain Competition Proceedings, 2001 O.J. (L 162) 21, superseded by Decision of the President of the European Commission 2011/695/EU of 13 October 2011 on the Function and Terms of Reference of the Hearing Officer in Certain Competition Proceedings, 2011 O.J. (L 275) 29.

[39] Pablo Ibáñez Colomo, Judicial Review in EU Merger Control: Towards Deference on Issues of Law?, 4 Eur. L. Open 441 (2025), https://doi.org/10.1017/elo.2025.10016.

[40] Monti, supra note 26.

[41] Commissioner Monti acknowledged criticism that the Commission was too susceptible to influence from merging parties’ competitors. He argued that merging parties should have ample opportunity to defend their positions and confront third-party concerns early in the investigation. Id. at 7.

[42] Directorate-General for Competition, European Commission, Best Practices on the Conduct of EC Merger Control Proceedings (Jan. 20, 2004), https://competition-policy.ec.europa.eu/document/download/a288a6d8-3962-4072-b6a1-93e2ba08d12e_en?filename=proceedings.pdf [hereinafter Merger Best Practices].

[43] Id. ¶ 45.

[44] Id. ¶ 46.

[45] Monti, supra note 26.

[46] Guidelines on the Assessment of Horizontal Mergers Under the Council Regulation on the Control of Concentrations Between Undertakings, 2004 O.J. (C 31) 5.

[47] Monti, the first economist appointed competition commissioner, emphasized economic analysis and the recruitment of industrial-organization economists to DG Competition. Director-General Philip Lowe, also an economist, supported that effort. Monti described it as a central goal: “I should like to underline that an increased economic approach in the interpretation of our rules was, indeed, one of my main objectives when I took on my new responsibilities as Competition Commissioner.” Monti, supra note 18, at 7.

[48] See Berg, supra note 5.

[49] Guillaume Loriot, Reflecting on 20 Years of the EU Merger Regulation, Keynote Address at Modern EU and UK Merger Control: 20th Anniversary—Two Decades of Regulation 139/04 and the Enterprise Act Regime (Feb. 27, 2024), https://competition-policy.ec.europa.eu/document/download/ca447d8a-b2b7-4583-b983-753b3385ac86_en?filename=20240227_Kings_College_Latham_Merger_Conference_London_Guillaume-Loriot_keynote_speech.pdf.

[50] See European Commission, Review of the Merger Guidelines, https://competition-policy.ec.europa.eu/mergers/review-merger-guidelines_en (last visited Aug. 30, 2026).

[51] Teresa Ribera, Executive Vice President of the European Commission, Keynote Speech at the 23rd International Conference on Competition (IKK) (Mar. 12, 2026), https://ec.europa.eu/commission/presscorner/detail/en/speech_26_602.

[52] Thibault Schrepel and Janneke Parrish examined the Commission’s record in competition cases before the Court of Justice, excluding the General Court, from Nov. 1, 2014, through Nov. 30, 2024—Margrethe Vestager’s tenure as competition commissioner. They identify Intel as the Commission’s only Article 102 loss during that period and report no Article 102 defeats involving novel theories of harm or procedural issues. See Thibault Schrepel & Janneke Parrish, Mapping Reversals: An Empirical Account of Margrethe Vestager’s Track Record Before the Court of Justice of the European Union, 22 Eur. Competition J. 63 (2026), https://doi.org/10.1080/17441056.2025.2511425.

[53] Pinar Akman, A Critical Inquiry into ‘Abuse’ in EU Competition Law, 44 Oxford J. Legal Stud. 405 (2024), https://doi.org/10.1093/ojls/gqae008.

[54] For purposes of this paper, the principal Intel decisions are Intel 2017, which set aside the General Court’s 2014 judgment; Intel Renvoi, which annulled the Commission’s findings concerning Intel’s rebates and the resulting fine; and Intel 2024, which upheld Intel Renvoi. See supra note 2.

[55] This section does not exhaust the European courts’ jurisprudence. It focuses on decisions whose holdings and broader statements echo Airtours, Schneider Electric, and Tetra Laval. Other Article 102 judgments reinforce the reasoning in Intel, Qualcomm, and Bulgarian Energy Holding, including Case T-612/17, Google LLC v. Commission, ECLI:EU:T:2021:763; Case C-377/20, Servizio Elettrico Nazionale SpA v. Autorità Garante della Concorrenza e del Mercato, ECLI:EU:C:2022:379; and Case C-680/20, Unilever Italia Mkt. Operations Srl v. Autorità Garante della Concorrenza e del Mercato, ECLI:EU:C:2023:33. In Google (Shopping), the General Court largely upheld the Commission’s decision but articulated demanding standards for its treatment of evidence. Servizio Elettrico Nazionale and Unilever Italia, both preliminary-reference cases, extended Intel’s evidentiary logic beyond exclusivity rebates. They required competition authorities to assess exclusionary capability in light of all relevant circumstances and treated evidence of actual market performance as relevant, though not dispositive. The Court of Justice also held that when a dominant undertaking presents evidence that its conduct could not produce anticompetitive effects, competition authorities must examine that evidence carefully and impartially. Although these cases did not review the Commission’s procedural framework, the Court grounded that obligation in the right to be heard. See Servizio Elettrico Nazionale, ECLI:EU:C:2022:379, ¶¶ 50–54; Unilever Italia, ECLI:EU:C:2023:33, ¶¶ 47–62.

[56] Intel Renvoi, ECLI:EU:T:2022:19, ¶ 102.

[57] Intel 2017, ECLI:EU:C:2017:632, ¶¶ 94–102.

[58] Intel Renvoi, ECLI:EU:T:2022:19, ¶ 93.

[59] See Ibáñez Colomo, supra note 25; see also Servizio Elettrico Nazionale, ECLI:EU:C:2022:379, ¶ 51 (holding that, when a dominant undertaking submits supporting evidence, the competition authority must determine whether the challenged conduct was capable of restricting competition under the particular circumstances).

[60] Commission Decision C(2018) 240 final of 24 January 2018 Relating to a Proceeding Under Article 102 TFEU and Article 54 of the EEA Agreement, Case AT.40220, Qualcomm (Exclusivity Payments).

[61] Qualcomm, ECLI:EU:T:2022:358, ¶ 344.

[62] Alfonso Lamadrid, Case T-235/18, Qualcomm v. European Commission (Part I: Procedure), Chillin’Competition (June 27, 2022), https://chillingcompetition.com/2022/06/27/case-t-235-18-qualcomm-v-european-commission-part-i-procedure.

[63] The Commission also failed to maintain proper records of these meetings or include them in the case file. Qualcomm, ECLI:EU:T:2022:358, ¶¶ 207–09, 256–59, 291–94. See also Council Regulation 1/2003, art. 19, 2003 O.J. (L 1) 1, which governs Commission interviews conducted to collect information related to an investigation.

[64] Qualcomm, ECLI:EU:T:2022:358, ¶ 279. The General Court also found serious due-process defects that infringed Qualcomm’s rights of defense. Material differences between the Commission’s statement of objections and final decision rendered irrelevant the data and economic arguments on which Qualcomm had relied. The court explained that this defense “is of no practical effect if the scope of the conduct concerned is modified by the Commission after the [statement of objections].” Id. ¶¶ 328, 333–352.

[65] Lamadrid, supra note 62.

[66] Commission Decision C(2018) 8806 final of 17 December 2018 Relating to a Proceeding Under Article 102 TFEU and Article 54 of the EEA Agreement, Case AT.39849, BEH Gas.

[67] See European Commission, Commission Staff Working Document Accompanying the Report from the Commission on Competition Policy 2023, SWD (2024) 53 final (Mar. 6, 2024), https://eur-lex.europa.eu/legal-content/EN/TXT/HTML/?uri=CELEX:52024SC0053. The General Court upheld one isolated instance of exclusionary conduct during part of the infringement period. It nonetheless annulled the Commission’s decision in full because that conduct alone could not establish the alleged single and continuous infringement, given the factual and legal defects in the remaining elements.

[68] The Commission appealed the General Court’s judgment on Jan. 10, 2024. As of Aug. 31, 2026, the appeal remained pending. Case C-14/24 P, Comm’n v. Bulgarian Energy Holding EAD. Advocate General Medina issued her opinion on April 23, 2026. Opinion of Advocate General Medina, Case C-14/24 P, Comm’n v. Bulgarian Energy Holding EAD, ECLI:EU:C:2026:347.

[69] Bulgarian Energy Holding, ECLI:EU:T:2023:669, ¶¶ 1170–1172; Qualcomm, ECLI:EU:T:2022:358, ¶ 344.

[70] Bulgarian Energy Holding, ECLI:EU:T:2023:669, ¶ 1154.

[71] Id. ¶¶ 1152, 1155. See also Council Regulation (EC) No. 1/2003, art. 27(2), 2003 O.J. (L 1) 1, 13; Commission Regulation (EC) No. 773/2004 of 7 April 2004 Relating to the Conduct of Proceedings by the Commission Pursuant to Articles 81 and 82 of the EC Treaty, art. 15(1)–(2), 2004 O.J. (L 123) 18, 22.

[72] Intel Renvoi, ECLI:EU:T:2022:19, ¶¶ 50–51.

[73] Assimakis Komninos & James Killick, The EU General Court Quashes Dominant Chip Manufacturer’s Antitrust Fine for “Exclusivity Payments” and Censures the European Commission for Multiple Due-Process and Substantive Errors (Qualcomm), e-Competitions, June 2022, Art. No. 107095 (June 15, 2022).

[74] Monti, supra note 26.

[75] Intel Renvoi, ECLI:EU:T:2022:19, ¶¶ 168–335.

[76] Id. ¶¶ 163, 255, 522.

[77] Jacques Buhart et al., The EU General Court Annuls the Commission’s Decision Regarding a Dominant Chip Manufacturer as a Result of Insufficient Analysis of Anticompetitive Effects and on Procedural Grounds (Qualcomm), e-Competitions, June 2022, Art. No. 112054 (June 15, 2022).

[78] Bulgarian Energy Holding, ECLI:EU:T:2023:669, ¶ 279.

[79] Id. ¶ 281.

[80] Intel 2017, ECLI:EU:C:2017:632.

[81] The five factors are the practice’s market coverage; the conditions governing the rebates; their duration; their amount; and evidence of a strategy to exclude competitors as efficient as the dominant undertaking. See id. ¶ 139.

[82] Intel Renvoi, ECLI:EU:T:2022:19, ¶ 499.

[83] Intel 2024, ECLI:EU:C:2024:915.

[84] Org. for Econ. Coop. & Dev. [OECD], The Standard and the Burden of Proof in Competition Law Cases, OECD Roundtables on Competition Policy Papers No. 318 (2024), https://doi.org/10.1787/0199f63f-en.

[85] Qualcomm, ECLI:EU:T:2022:358, ¶ 346.

[86] Id. ¶¶ 409–24. Lamadrid argues that the judgment applied counterfactual logic without using the term. Because Apple could not have switched to rivals absent Qualcomm’s payments, those payments could not have restricted competition. Alfonso Lamadrid, Case T-235/18, Qualcomm v. European Commission (Part II: Substance), Chillin’Competition (July 11, 2022), https://chillingcompetition.com/2022/07/11/case-t-235-18-qualcomm-v-european-commission-part-ii-substance.

[87] Qualcomm, ECLI:EU:T:2022:358, ¶¶ 355, 396–97; see also Ibáñez Colomo, supra note 25.

[88] Qualcomm, ECLI:EU:T:2022:358, ¶ 351.

[89] Id. ¶ 424.

[90] See Bulgarian Energy Holding, ECLI:EU:T:2023:669, ¶¶ 945–49; see also Kristi Georgieva & Niamh Martyn, Bulgarian Energy Holding v. Commission (Case T-136/19): Revamped Energy to Overturn Abuse of Dominance Decisions on Account of Errors of Fact and Assessment, Cleary Antitrust Watch (Oct. 25, 2023), https://www.clearyantitrustwatch.com/2023/10/bulgarian-energy-holding-v-commission-case-t-136-19-revamped-energy-to-overturn-abuse-of-dominance-decisions-on-account-of-errors-of-fact-and-assessment.

[91] Bulgarian Energy Holding, ECLI:EU:T:2023:669, ¶ 279.

[92] Id. ¶ 282.

[93] Id. ¶ 281.

[94] Id. ¶¶ 280–81.

[95] Bas Braeken et al., The EU General Court Annuls a €77M Fine Imposed on a Bulgarian Gas Company Due to a Lack of Evidence and Procedural Flaws (Bulgarian Energy Holding), e-Competitions, Oct. 2023, Art. No. 121154 (Oct. 25, 2023).

[96] Ibáñez Colomo, supra note 39.

[97] Akman, supra note 53.

[98] Monti, supra note 26.

[99] Berg, supra note 5.

[100] After the Qualcomm judgment, the Commission said it would study the ruling and consider its next steps. Foo Yun Chee, Qualcomm Wins Fight Against $1 Billion EU Antitrust Fine, Reuters (June 15, 2022), https://www.reuters.com/technology/eu-court-rejects-1-bln-eu-antitrust-fine-against-qualcomm-2022-06-15. The Commission gave a similar response after the BEH judgment. Directorate-General for Competition, Weekly e-News, No. 37/2023 (Oct. 27, 2023).

[101] See, e.g., Monti, supra note 26; see also Ibáñez Colomo, supra note 39.

[102] Letter from Ursula von der Leyen, President, European Commission, to Teresa Ribera Rodríguez, Executive Vice-President-Designate for a Clean, Just and Competitive Transition (Sept. 17, 2024), https://commission.europa.eu/document/download/5b1aaee5-681f-470b-9fd5-aee14e106196_en?filename=Mission%20letter%20-%20RIBERA.pdf.

[103] Council Regulation 1/2003 of Dec. 16, 2002, on the Implementation of the Rules on Competition Laid Down in Articles 81 and 82 of the Treaty, 2003 O.J. (L 1) 1; Commission Regulation 773/2004 of Apr. 7, 2004, Relating to the Conduct of Proceedings by the Commission Pursuant to Articles 81 and 82 of the EC Treaty, 2004 O.J. (L 123) 18 [hereinafter Regulation 773/2004]; see also European Commission, Commission Staff Working Document: Evaluation of Regulations 1/2003 and 773/2004, SWD(2024) 216 final (Sept. 5, 2024), https://ec.europa.eu/info/law/better-regulation/have-your-say/initiatives/13431-EU-antitrust-procedural-rules-evaluation_en.

[104] The European Competition Lawyers Forum argued that Intel and Qualcomm raised evidentiary-quality concerns that the review of Regulation 1/2003 should address. European Competition Lawyers Forum, Contribution to the Public Consultation: Reforms to Regulation 1/2003 (Oct. 24, 2022). Participants in the Commission’s evaluation likewise questioned whether the Commission maintained complete case files containing all relevant evidence, including exculpatory material. European Commission, supra note 103, at 144.

[105] The CJEU dismissed Google and Alphabet’s appeal, leaving in place the General Court’s judgment and the €2.42 billion fine. Case C-48/22 P, Google LLC & Alphabet Inc. v. Comm’n (Google Shopping), ECLI:EU:C:2024:726.

[106] European Commission, Press Release IP/24/3623, Commission Seeks Feedback on Draft Antitrust Guidelines on Exclusionary Abuses (Aug. 1, 2024), https://ec.europa.eu/commission/presscorner/detail/en/ip_24_3623.

[107] Linsey McCallum et al., A Dynamic and Workable Effects-Based Approach to Abuse of Dominance, Competition Policy Brief No. 1/2023 (Eur. Comm’n, Directorate-Gen. for Competition Mar. 2023), https://doi.org/10.2763/731952.

[108] Pinar Akman, Chiara Fumagalli & Massimo Motta, The European Commission’s Draft Guidelines on Exclusionary Abuses: A Law and Economics Critique and Recommendations, 16 J. Eur. Competition L. & Prac. 234 (2025), https://doi.org/10.1093/jeclap/lpaf020.

[109] Dirk Auer & Lazar Radic, The Commission’s Article 102 TFEU Guidelines: Consolidation or Creation?, SSRN Scholarly Paper No. 5134897 (2025), https://doi.org/10.2139/ssrn.5134897.

[110] Akman et al., supra note 108.

[111] See, e.g., Fernando Castillo de la Torre, The Dwindling Law in Article 102 TFEU, in Article 102 TFEU: Past, Present and Future ch. 6 (Assimakis Komninos & Ekaterina Rousseva eds., 2025).

ICLE Issue Brief

Too Much on the Menu: Disclosure Overload and Crowding Out in Food-Delivery Regulation

Executive Summary The Federal Trade Commission’s (FTC) advance notice of proposed rulemaking for online food-delivery services considers requiring platforms to display, itemize, explain, and repeatedly . . .

Executive Summary

The Federal Trade Commission’s (FTC) advance notice of proposed rulemaking for online food-delivery services considers requiring platforms to display, itemize, explain, and repeatedly disclose fees throughout an order. This review examines two potential costs. Disclosure overload occurs when excessive information impairs comprehension. Crowding out occurs when mandated content consumes limited attention and screen space, displacing information consumers value more.

Research supports clear, timely disclosure of known mandatory fees. Studies of drip pricing show that concealing such fees behind low headline prices distorts choices. The evidence offers less support for early estimates of charges that depend on a customer’s cart, address, or delivery window. It also does not establish the value of separate narratives for every fee, prescribed prominence, or repetition across screens.

Additional disclosure does not always improve decisions. Consumers struggled with overlapping federal mortgage forms, while a later consolidation that cut word count by 65% improved comparison shopping and borrowing terms. Other studies find that clutter reduces compliance, numerical complexity impairs understanding, and repeated warnings lose their effect. On food-delivery screens, extensive fee displays could displace menu prices, delivery estimates, comparison tools, and allergen or nutrition information. Direct evidence from mobile ordering interfaces remains limited.

Section 18 of the Federal Trade Commission Act requires the FTC to assess a rule’s effects on consumers and small businesses. The Commission should prohibit concealed mandatory fees and false fee representations while testing more prescriptive requirements before adopting them. Tests in actual mobile ordering interfaces should compare alternative formats, measure displacement, distinguish first-time users from repeat customers, and give field results greater weight than laboratory estimates.

I.         Introduction: The Limits of Mandated Disclosure

The Federal Trade Commission (FTC) is considering rules that could require online food-delivery platforms to display extensive pricing and fee information. A platform might have to show the total price, itemize each fee, explain its purpose and refundability, estimate charges that vary by order, and repeat these disclosures throughout the ordering process. This literature review examines whether disclosures of that breadth would help consumers make better decisions.

The FTC’s advance notice of proposed rulemaking (ANPRM) asks 65 questions.1F1F[1] Many concern the content, timing, and presentation of possible disclosures. The Commission asks whether platforms should prominently display a total price, identify and explain fees excluded from that price, estimate variable charges, disclose who receives each fee, and explain how promotions, memberships, in-store prices, and personalized pricing affect what consumers pay. It also considers requiring disclosures before consumers begin an order and everywhere a platform displays a price (Questions 35, 37–38, 41–42, 44–46, 48–52, 59, and 63; Federal Trade Commission 2026a, 20,388–91).

Taken together, these questions contemplate a substantial block of required text and numbers. Much of that information would appear on a smartphone, where most food-delivery transactions occur and screen space remains scarce. A single disclosure may inform an attentive consumer. The relevant question is whether combining and repeating many disclosures would inform consumers better than a leaner design.

The International Center for Law & Economics (ICLE) reached six broader conclusions in its May 18, 2026, comments on the ANPRM (Albrecht et al. 2026):

  1. The current record does not satisfy the prevalence, consumer-expectation, and benefit-cost showings that Section 18 of the Federal Trade Commission Act requires before the FTC issues a proposed rule.
  2. Existing Section 5 enforcement already reaches hidden mandatory fees and false representations about fees. The enforcement record alone does not justify a sectorwide rule.
  3. Any rule should distinguish drip pricing—the strategic withholding of known mandatory fees—from later disclosure of charges that cannot be calculated until the customer selects items and provides a delivery location.
  4. Cost-of-service requirements would regulate fee levels, exceed disclosure regulation, and fall outside the Commission’s Section 18 authority.
  5. Any rule should apply neutrally to third-party platforms and merchants operating their own delivery services, with safe harbors or model templates for small operators.
  6. Requiring platforms to compress variable fees into a single figure could create a de facto price cap and reduce service in rural, low-density, and late-night markets where consumers have few alternatives.

This review addresses a narrower question that arises only if the Commission moves toward a proposed rule: Which disclosure requirements does the evidence support, and which risk repeating documented failures in other markets?

Two issues guide the review. The first is disclosure overload. Beyond some point, additional required information may reduce comprehension and decision quality. Several mechanisms can produce this result. Important information may lose salience, meaning it no longer stands out enough to attract attention. Consumers may become habituated to repeated messages or disengage and stop reading altogether.

The second issue is crowding out. Consumer attention and screen space are finite. Requiring one disclosure may divert attention from another or displace information that consumers value more, such as delivery times, allergens, or nutrition facts. This concern becomes particularly acute on mobile screens.

The literature draws an important distinction between transparent pricing and exhaustive disclosure. Evidence strongly supports requiring platforms to reveal known mandatory fees before consumers invest substantial time in an order. Research on drip pricing shows that withholding such fees until checkout distorts choices and leads consumers to spend more than they intended. Timely disclosure of known mandatory charges promotes honest comparison shopping.

That evidence does not establish that platforms should display every possible detail at every stage. Nor does it justify treating a fee that cannot be calculated until the consumer completes a cart and supplies an address as equivalent to a known fee deliberately withheld until checkout.

Research from other markets also cautions against excessive or poorly designed disclosures. Borrowers understood mortgage terms better after regulators consolidated and shortened the required forms. Visual clutter reduces compliance, repeated warnings lose effectiveness as consumers tune them out, and long lists of variable charges may confuse more than they clarify. Recognizing these limits, the Consumer Financial Protection Bureau, Federal Communications Commission, and U.S. Department of Transportation have used or endorsed layered disclosures, links, and limits on required information instead of placing every detail in a single display.

The case for crowding out has strong theoretical support, and regulators have acknowledged the problem. Empirical research has rarely measured how competing disclosures affect consumers on an actual ordering screen, though. Section 18 requires the Commission to assess a rule’s costs. The Commission therefore should not assume away the costs of overload and crowding out. It should test competing disclosure designs with real consumers before imposing a uniform mandate.

II.      Disclosure Overload: Evidence and Limits

Disclosure overload occurs when the volume, complexity, or repetition of mandated information exceeds consumers’ processing capacity and reduces decision quality. This section examines the scarcity of attention, the evidence supporting targeted disclosure of known fees, the risks posed by accumulation and clutter, and the importance of design, context, and field testing.

A.      Attention Is a Scarce Resource

The economics of attention starts with a basic constraint. Christopher Sims models decision-makers as information-processing channels with finite capacity. Greater attention to one signal leaves less capacity to track others (Sims 2003). Xavier Gabaix’s review of empirical estimates finds that consumers, on average, operate about halfway between full attention and complete inattention (Gabaix 2019). Economic research therefore treats attention as a scarce resource that consumers must allocate among competing demands.

Regulation cannot eliminate that scarcity. Omri Ben-Shahar and Carl Schneider describe the resulting “accumulation problem.” Regulators adopt each disclosure mandate in isolation, while consumers confront the combined demands of every mandate and everything else competing for their time (Ben-Shahar and Schneider 2011). Their review documents the consequences. One clickstream study, which tracked users’ online activity, found that only about one in 1,000 customers opened the terms of a software contract before purchasing. Among those who opened the terms, the median customer spent 29 seconds reading them.

Firms can exploit these limits. Petra Persson models a firm that complies with a disclosure mandate by surrounding the required fact with accurate but irrelevant information. The additional material consumes the customer’s attention and obscures the relevant fact (Persson 2018). If regulators prescribe a simpler format, the firm can complicate the product itself so the relevant information again exceeds the customer’s processing capacity. Persson calls this response “complexification.” Questions 37, 38, and 42 contemplate prominence requirements and separate explanations for each fee. Such mandates could prompt the strategic responses Persson’s model predicts.

B.       Drip-Pricing Research Supports Targeted Disclosure

The advance notice of proposed rulemaking cites two experiments showing that drip pricing harms consumers. Both concern fixed, knowable fees withheld until late in a transaction. Neither examines variable fees that depend on an address, cart, or delivery window. The studies therefore address fee concealment rather than the required timing or format for charges that cannot yet be calculated.

Alexander Rasch, Miriam Thöne, and Tobias Wenzel constructed laboratory markets in which comparing dripped fees imposed a small search cost. Sellers responded by setting the dripped component near the maximum allowed and competing on the base price. Total prices averaged 16.96 experimental units under drip pricing and 15.37 under transparent pricing. In addition, 21% of buyers mistakenly chose the more expensive option (Rasch, Thöne, and Wenzel 2020).

Shelle Santana, Steven Dallas, and Vicki Morwitz found similar effects. Consumers shown dripped add-on fees selected the lower base-price option 54.5% of the time, compared with 11.7% among consumers who saw the fees upfront. Even after seeing the final total, 24.5% of participants in the drip-pricing condition chose the more expensive option, compared with 7.8% in the upfront condition (Santana, Dallas, and Morwitz 2020).

Field evidence also supports a targeted policy against concealment. Tom Blake, Sarah Moshary, Kane Sweeney, and Steve Tadelis conducted a large randomized experiment on StubHub. Delaying mandatory fees until checkout increased revenue by roughly 21%, made buyers 14.1% more likely to complete a purchase, and shifted purchases toward more expensive tickets (Blake et al. 2021). The experiment involved a single fixed fee on a standardized ticket. Food and grocery orders present a different problem because they involve multi-item carts, variable delivery conditions, and comparisons across products and retailers.

Xavier Gabaix and David Laibson explain why competition may fail to correct concealed fees. Their theoretical model shows that firms profit from shrouding add-on charges when enough consumers overlook them. A firm gains little by educating consumers who would then purchase the discounted base product and avoid the profitable add-on (Gabaix and Laibson 2006).

Other research confirms that timely, salient disclosures can change behavior. Raj Chetty, Adam Looney, and Kory Kroft found that posting tax-inclusive prices on grocery shelves reduced demand for treated products by roughly 8%. Survey evidence showed that most consumers already knew the tax applied. Displaying it at the moment of choice made it salient (Chetty, Looney, and Kroft 2009).

Behaviorally designed disclosures have produced similar results in payday lending. Marianne Bertrand and Adair Morse found that showing borrowers the cumulative dollar cost of repeated loan rollovers reduced borrowing by 11% over the next four months (Bertrand and Morse 2011). Jialan Wang and Kathleen Burke found that a Texas mandate requiring a similar disclosure before each payday loan produced a persistent 12% decline in loan volume, with no observable increase in prices or defaults (Wang and Burke 2022).

This evidence supports preventing platforms from concealing known, mandatory fees behind misleading headline prices. It does not establish that the Federal Trade Commission should require every fee to appear at the beginning of a transaction or prescribe a single presentation format. The studies show that concealment distorts choices. They do not compare alternative formats for clearly disclosing known fees.

That distinction tracks ICLE’s comments. Fixed mandatory fees are known in advance, and delaying them can exploit the time a consumer has spent assembling an order. Contingent variable fees cannot be calculated until the consumer supplies an address, cart, or delivery window (Albrecht et al. 2026, 10–11). The evidence supports treating these two categories differently.

C.      Excessive Disclosure Can Reduce Comprehension

For decades, mortgage borrowers received overlapping disclosures under the Truth in Lending Act (TILA) and the Real Estate Settlement Procedures Act (RESPA). The Federal Trade Commission’s Bureau of Economics tested those forms on 819 borrowers. Roughly 20% could not identify the annual percentage rate, cash due at closing, or monthly payment, and nearly nine in 10 could not identify the loan’s total upfront cost (Lacko and Pappalardo 2007; Lacko and Pappalardo 2010). The FTC economists warned that disclosures containing “too much, irrelevant, or unnecessary information” can cause consumers to ignore the material altogether (Lacko and Pappalardo 2007, 128).

In 2015, the Consumer Financial Protection Bureau consolidated the overlapping forms into two documents under the TILA-RESPA Integrated Disclosure rule, commonly called TRID. The change reduced the disclosures’ word count by 65%. Patrick Kielty, K. Philip Wang, and Diana Weng found that first-time homebuyers subsequently paid significantly lower interest rates than repeat buyers, with no offsetting increase in upfront points or fees. The effects were largest in areas with greater lender competition. The authors concluded that “less disclosure makes borrowers better off” when regulators eliminate duplication and complexity (Kielty, Wang, and Weng 2023, 193).

Allison Nicoletti and Christina Zhu likewise found that simplification reduced consumers’ information-processing costs and increased comparison shopping. After the rule took effect, significantly more consumers withdrew applications, apparently because they found better terms elsewhere (Nicoletti and Zhu 2023).

Questions 38 and 42 contemplate requiring platforms to disclose the nature, purpose, amount, refundability, and recipient of every fee, along with a separate explanation for each. The mortgage evidence suggests that such detail can become self-defeating. Food-delivery customers also make low-stakes purchases in minutes and repeat them frequently. Any comprehension cost would recur with each order, rather than arise once during an infrequent, high-stakes transaction.

The Commission has already rejected a similar requirement. In its January 2025 Trade Regulation Rule on Unfair or Deceptive Fees, which covers live-event ticketing and short-term lodging, the Commission declined to require affirmative disclosure of each fee’s refundability. It found that the requirement could prove impractical for businesses and confusing for consumers (Federal Trade Commission 2025, 90 Fed. Reg. 2,066, 2,102). Question 38 considers that same requirement for food delivery. The Commission should require evidence that food delivery warrants a different result.

Questions 48, 59, and 63 consider requiring fee disclosures wherever a price appears. A food-delivery app may display prices on the restaurant list, menu, item page, cart, and checkout screen. Platforms that allow searches across retailers also display prices in comparison results designed to help customers evaluate competing products. Adding a fee module could consume much of a phone screen and impair that function.

Repeating the same disclosure at each point also creates habituation, the declining neurological and behavioral response to repeated stimuli. Bonnie Brinton Anderson and her coauthors used eye tracking to show that users look at warnings less with each successive viewing (Anderson et al. 2016). Anthony Vance and his coauthors combined functional magnetic resonance imaging, eye tracking, and a three-week field experiment. Adherence to mobile security warnings fell from 87% to 64% with repeated exposure, and brain imaging showed a corresponding decline in response. Changing a warning’s appearance preserved much of its effect (Vance et al. 2018). In a field study of more than 25 million browser warnings, Devdatta Akhawe and Adrienne Porter Felt found that half of users dismissed Chrome’s most common security warning within 1.7 seconds (Akhawe and Felt 2013).

Indiscriminate repetition can also make warnings less informative. Lisa Robinson, W. Kip Viscusi, and Richard Zeckhauser report that 69% of surveyed consumers equated California’s generic Proposition 65 cancer warning on breakfast cereal with the risk of cigarette smoking. They argue that warning systems fail when they attach identical language to risks of vastly different severity, leaving consumers unable to separate the “wolf or puppy” (Robinson, Viscusi, and Zeckhauser 2019). The same evidence suggests that consumers will devote less attention to a fee notice that appears identically on every screen of every order.

Clutter and numerical density create related problems, especially on small smartphone screens. Peter Hancock and his coauthors synthesized 272 effect sizes from 30 warning studies. They found that integrating a warning into the user’s task and including text increased compliance, while visual clutter reduced it (Hancock et al. 2020).

Research involving food choices reports similar effects. Julie Downs, Jessica Wisdom, and George Loewenstein found that raw numerical calorie information had almost no effect on snack choices. Combining calorie information with a separate choice-architecture intervention sometimes reversed that intervention’s effect, showing that stacked policies can interfere with one another (Downs, Wisdom, and Loewenstein 2015). Sarah Campos, Juliana Doxey, and David Hammond’s systematic review found that labels requiring arithmetic confused consumers, while simplified interpretive formats improved their ability to identify healthier options (Campos, Doxey, and Hammond 2011). The U.S. Food and Drug Administration’s 2023 review similarly found that consumers often understood simple summary or interpretive labels better than detailed numerical systems, although results varied by design and outcome (Verrill et al. 2023).

Questions 41 and 42 implicate these findings. Itemization at checkout can provide useful information. A customer who sees a small-order fee learns that adding items may avoid it. A customer who sees a distance-based delivery fee learns that ordering from a closer restaurant may cost less. ICLE’s comments defended itemized disclosure on that ground (Albrecht et al. 2026, 12). The overload risk depends on the required level of detail and on mandates to estimate fees that cannot yet be calculated.

The Federal Communications Commission took that concern seriously when it adopted its 2022 broadband consumer label. The agency confined the label to core price terms and directed consumers to hyperlinks for additional detail. It found that expansive on-label disclosures would overwhelm consumers without helping them (Federal Communications Commission 2022, 87 Fed. Reg. 76,959, 76,966). In 2025, the agency proposed trimming the label further because itemizing location-variable fees confused consumers without improving their decisions (Federal Communications Commission 2025, 90 Fed. Reg. 55,713). ICLE’s comments in that proceeding cited behavioral research showing that decision quality declines when disclosure volume exceeds consumers’ processing capacity (Fruits and Westling 2026).

Food-delivery fees that vary by distance, time, traffic, and demand resemble location-variable broadband fees. Requiring platforms to disclose amounts or ranges before a customer provides an address forces platforms to offer either worst-case figures that overstate most customers’ costs or ranges too broad to inform a decision. Both approaches could teach consumers to disregard the disclosure, replicating the disengagement that James Lacko and Janis Pappalardo documented.

D.      Disclosure Effects Depend on Design and Context

Bryan Bollinger, Phillip Leslie, and Alan Sorensen found that mandatory calorie posting at Starbucks reduced average calories per transaction by 6% without harming profits (Bollinger, Leslie, and Sorensen 2011). Pasquale Rummo and his coauthors, analyzing nine years of Taco Bell transactions, associated menu labeling with a 24.7-calorie reduction per transaction (Rummo et al. 2023). In consumer finance, Victor Stango and Jonathan Zinman found that simply surveying consumers about overdraft fees reduced their likelihood of incurring one by 3.7 percentage points from a 26% baseline (Stango and Zinman 2014).

These studies show that a single, salient disclosure of a material fact can improve decisions. They also identify a potential crowding-out cost. A dense fee display could displace calorie and nutrition information that consumers value on the same screen. Yet these studies do not test multiple simultaneous disclosures, prominence requirements, or repetition across screens.

Even the strongest field evidence warrants modest expectations. Michael Long and his coauthors conducted a meta-analysis of menu labeling. When they limited the analysis to the six highest-quality controlled studies in actual restaurants, they found a statistically insignificant reduction of only 7.63 calories per meal (Long et al. 2015).

Several prominent disclosure failures arose from causes other than overload. Sumit Agarwal and his coauthors found that a payment disclosure required by the Credit Card Accountability Responsibility and Disclosure Act of 2009 (CARD Act) had little effect because consumers who paid online rarely saw the monthly statements containing it. The failure concerned delivery rather than consumers’ ability to process the disclosure (Agarwal et al. 2015). The same study found that the CARD Act’s substantive fee limits saved consumers an annualized 1.6% of balances, or roughly $11.9 billion a year. Choosing the right remedy therefore requires identifying why a disclosure failed.

The dysfunction of European cookie-consent banners likewise reflects deliberate manipulation as much as cognitive limits. Dino Bollinger and his coauthors found potential violations on 94.7% of roughly 30,000 websites (Bollinger et al. 2022). Ahmed Bouhoula and his coauthors found that 65.4% of sites offering an opt-out continued collecting data after users refused consent (Bouhoula et al. 2024). Such conduct calls for enforcement against noncompliance and deceptive design.

Research methods also warrant caution. Stefano DellaVigna and Elizabeth Linos compared 126 government nudge trials covering 23.5 million people with results published in academic journals. The published effect sizes were roughly six times larger, and selective publication (also known as publication bias) accounted for about 70% of the gap (DellaVigna and Linos 2022). Their findings counsel caution when extrapolating from the laboratory drip-pricing experiments cited in the advance notice of proposed rulemaking.

The Commission should build its record with field evidence and consumer testing that reflect actual food-delivery interfaces. These platforms present several important categories of information at once. Evidence that a narrow disclosure improved decisions in another market does not establish that additional fee narratives, estimates, and repetition will help food-delivery customers.

The research supports truthful, timely disclosure of known mandatory fees without misleading headline prices. It provides no comparable support for granular explanations of every fee, estimates of charges that cannot yet be calculated, prescribed prominence hierarchies, or repetition on every screen. Those requirements can turn useful disclosure into clutter with measurable costs.

III.    Crowding Out: Theory, Regulatory Experience, and Evidence

Crowding out occurs when mandated content consumes finite attention and display space, displacing information consumers may value more. On food-delivery apps, the disclosures contemplated in Questions 35 through 52 would compete on smartphone screens with menu items, prices, delivery estimates, restaurant ratings, and required allergen and nutrition information. Question 23 asks what could impede disclosure of all mandatory fees before ordering begins and wherever a price appears (Federal Trade Commission 2026a, 20,389). On a mobile interface, the screen itself imposes a practical limit.

The economics of limited attention provides the theoretical basis for this concern. Federal agencies and a state supreme court have treated screen-space displacement as a genuine design constraint, and related studies show that clutter, placement, and screen size affect attention and comprehension. Direct evidence from food-delivery transaction screens remains scarce. This section reviews the theory, regulatory experience, and limits of the empirical record.

A.      Limited Attention Creates Crowding Out

Crowding out applies the same finite-capacity framework to information presented within a limited display. Christopher Sims’s model implies that adding signals reduces a consumer’s capacity to process those already present (Sims 2003). Geoffroy de Clippel, Kfir Eliaz, and Kareen Rozen likewise model consumers who can inspect only a limited number of options. Examining one option necessarily leaves less attention for another (de Clippel, Eliaz, and Rozen 2014).

Petra Persson shows how firms can exploit this constraint. A firm can surround a material disclosure with accurate but irrelevant cues, consuming the attention needed to process the important information (Persson 2018). The Organisation for Economic Co-operation and Development’s (OECD) consumer-policy committee incorporated these findings into its guidance. It advises regulators to limit the scope and prescriptiveness of disclosure mandates and expressly identifies the accumulation problem in online settings (OECD 2022, 33).

B.       Regulators Recognize Screen-Space Constraints

Three federal agencies and one state supreme court have treated limited screen space and attention as material design constraints. Each authority informs the placement and prominence requirements under consideration here.

The U.S. Department of Transportation’s 2024 airline-fee rule required upfront, passenger-specific disclosure of baggage and change fees on the first page of search results. The agency nevertheless allowed pop-ups and expandable text because rigid on-page requirements could “overcrowd web pages” and impair the presentation of fare information on small screens (U.S. Department of Transportation 2024, 89 Fed. Reg. 34,620, 34,646).

The 5th U.S. Circuit Court of Appeals later vacated the rule on Administrative Procedure Act grounds, and the Department reinstated the prior standard effective July 2, 2026 (U.S. Department of Transportation 2026, 91 Fed. Reg. 40,368). The court’s decision neither endorsed nor rejected the agency’s behavioral judgment. This brief cites the 2024 rule only for that judgment. After a full rulemaking, an agency requiring upfront fee disclosure concluded that flexible presentation was necessary to avoid crowding. Its approach also shows why rigid mandates can impede improvements as technology and consumer behavior change.

The Federal Communications Commission made a similar design choice for its broadband label. It required a compact, standardized display and placed additional detail behind hyperlinks because expansive on-label content would overwhelm consumers (Federal Communications Commission 2022).

The Federal Trade Commission’s 2013 digital-advertising guidance likewise instructs businesses to place required disclosures as close as possible to the claims they qualify. It warns that scrolling makes disclosures easier to miss and specifically addresses the constraints of mobile screens (Federal Trade Commission 2013). The Commission cannot treat mobile screen space as a binding constraint when judging disclosure placement and as costless when considering the number of required disclosures.

The California Supreme Court addressed the same concern in Dowhal v. SmithKline Beecham Consumer Healthcare. The court held that federal law preempted a state warning requirement, relying in part on the U.S. Food and Drug Administration’s concern about overwarning and the danger of “less meaningful warnings crowding out necessary warnings” (Dowhal v. SmithKline Beecham Consumer Healthcare 2004).

C.      Direct Evidence of Screen-Space Crowding Is Limited

Few studies directly measure how mandated information displaces other content on transaction screens. Related evidence nonetheless indicates that display constraints affect attention and comprehension. Peter Hancock and his coauthors found that clutter within a display reduces compliance with warnings (Hancock et al. 2020). Christine Utz and her coauthors, in field experiments involving more than 80,000 website visitors, found that a consent banner’s placement substantially affected whether users engaged with it (Utz et al. 2019). Christopher Sanchez and James Goolsbee found that small displays impair reading retention unless designers adjust the text size to fit the screen (Sanchez and Goolsbee 2010). The U.S. Food and Drug Administration’s review of front-of-package labels found that, under time pressure, labels competing with other package elements can distort consumers’ perceptions of healthfulness (Verrill et al. 2023).

These studies do not answer the precise question before the Commission. No study cited here measures whether a mandated fee module on a menu or cart screen reduces attention to delivery times, allergen information, or price comparisons across platforms. Nor does the literature quantify the resulting consumer harm. Economic theory supports the crowding-out concern, and regulators confronting similar design problems have recognized it. Direct evidence from smartphone transaction screens remains scarce. The Commission should fill that gap through consumer testing before imposing prescriptive requirements.

IV.    Applying the Evidence to the ANPRM

What the evidence supports:

  • Prohibiting platforms from concealing fixed mandatory fees behind misleading headline prices would respond to Questions 15a and 48 and accord with the drip-pricing evidence.
  • The same principle applies to contingent and variable fees under Questions 16, 41b, and 41c. Platforms should not advertise a price that omits fees they know will apply, even when the exact amount depends on the customer’s address, cart, or delivery window.
  • False statements about fees constitute deception under settled Section 5 doctrine.

Provisions that the current record does not support:

  • Requiring a total-price display that includes variable components under Questions 35, 36, and 41a forces platforms to provide either estimates or broad ranges. The Commission’s existing Fees Rule excludes analogous shipping charges from the total price because of this practical difficulty (16 C.F.R. § 464.1; Albrecht et al. 2026, 13–14). A shipping-charge exception would not fully address food delivery because the relevant fees can vary with the cart, address, and delivery window.
  • Requiring the total price to dominate every other element under Question 37 imposes a prominence hierarchy. Persson’s model shows how firms can respond strategically to such format mandates, while the Federal Communications Commission’s experience demonstrates the risks of prescribing detailed label designs.
  • Requiring separate narratives about each fee’s nature, purpose, refundability, and recipient under Question 38 would impose a requirement the Commission rejected in January 2025.
  • Repeating disclosures wherever a price appears under Questions 48, 59, and 63 conflicts with the evidence on habituation.
  • Adding in-store price-comparison and personalized-pricing disclosures under Questions 51 and 52 would compound the accumulation problem on small screens.

V.      Test Disclosure Mandates Before Adopting Them

Section 18 of the Federal Trade Commission Act requires findings on the prevalence of the targeted practices and an economic analysis of a final rule’s effects on consumers and small businesses (15 U.S.C. § 57a(b), (d)). The evidence on disclosure overload and crowding out identifies three research tasks within the Commission’s demonstrated capacity.

Format testing should precede format mandates. The Bureau of Economics’ mortgage-disclosure project provides a useful model. Researchers first conducted qualitative interviews and then ran controlled experiments comparing existing and prototype disclosures with actual consumers (Lacko and Pappalardo 2007). Here, the Commission should test proposed fee displays within mobile ordering interfaces. It should test first-time and repeat users separately because the advance notice of proposed rulemaking indicates that many customers order repeatedly and may have different baseline expectations (Federal Trade Commission 2026a, 20,381; Albrecht et al. 2026, 8). This research would respond directly to Question 63’s request for evidence that the proposed disclosures improve decision-making.

The Commission should also measure displacement. Researchers can test whether a mandated fee module on menu and cart screens reduces attention to delivery times, allergen information, or comparison tools. Eye tracking, as used by Bonnie Brinton Anderson and Anthony Vance, combined with A/B testing that compares alternative display designs, as used by Christine Utz, could answer the question at modest cost.

The Commission should give field evidence greater weight than laboratory results. Stefano DellaVigna and Elizabeth Linos found that published academic studies reported effects roughly six times larger than government trials conducted under real-world conditions (DellaVigna and Linos 2022). Michael Long and his coauthors likewise found that menu-labeling effects became statistically insignificant when they limited their meta-analysis to the highest-quality controlled studies in actual restaurants (Long et al. 2015).

VI.    Conclusion

The evidence supports a targeted response to deceptive pricing. Platforms should disclose known mandatory fees clearly and before purchase rather than use low headline prices that rise later. Fees that depend on a customer’s cart, address, or delivery window require different treatment because platforms cannot calculate them at the start of an order. The drip-pricing research supports preventing concealment. It does not establish the value of a prescribed format, estimates of unknown charges, or repetition on every screen.

The broader literature cautions against treating more disclosure as inherently better. Consumer attention is finite. Accumulated detail, visual clutter, numerical complexity, and repeated warnings can reduce comprehension and cause disengagement. The Federal Trade Commission’s own mortgage research documented those effects. The Consumer Financial Protection Bureau later cut overlapping mortgage disclosures by 65%, and borrowers received better terms. A food-delivery app offers less room and demands faster decisions than a mortgage form.

Crowding out presents a related cost. A mandated fee module can displace delivery estimates, allergen and nutrition information, restaurant ratings, and comparison tools. Economic theory supports that concern, and federal agencies and a state supreme court have recognized it. Direct evidence from food-delivery screens remains limited, which makes consumer testing necessary before the Commission adopts prescriptive requirements.

Section 18 requires the Commission to examine a rule’s effects on consumers and small businesses. The Commission should test competing designs in actual mobile ordering interfaces, measure what information they displace, distinguish first-time users from repeat customers, and give field results greater weight than laboratory estimates. That work can support rules that secure the benefits of honest pricing while avoiding the disclosure failures federal regulators have spent decades documenting and correcting.

Works Cited

  • Agarwal, Sumit, Souphala Chomsisengphet, Neale Mahoney, and Johannes Stroebel. “Regulating Consumer Financial Products: Evidence from Credit Cards.” The Quarterly Journal of Economics 130, no. 1 (2015): 111–164. https://doi.org/10.1093/qje/qju037.

Approach: Peer-reviewed natural experiment using panel data.

Findings: The Credit Card Accountability Responsibility and Disclosure Act’s limits on credit card fees reduced annual borrowing costs by 1.6% of average daily balances, saving consumers $11.9 billion annually, with no offsetting increase in interest rates. By contrast, a required disclosure showing the savings from repaying balances over 36 months produced only a tiny increase in the share of accounts paying that amount. The authors found “no evidence of a change in overall payments.”

Authors’ Conclusions: Structural fee regulations reduce costs because imperfect competition and non-salient pricing prevent issuers from fully recovering lost fee revenue. The authors attribute the payoff disclosure’s negligible effect to poor delivery: Consumers who pay online rarely view their monthly statements.

Relevance to Disclosure Overload: Counterevidence. The disclosure failed because consumers rarely saw it during the payment process, rather than because excessive information overwhelmed them.

Relevance to Crowding Out: None. The study examines the delivery of credit card disclosures but does not analyze whether disclosures compete for limited screen space.

  • Akhawe, Devdatta, and Adrienne Porter Felt. “Alice in Warningland: A Large-Scale Field Study of Browser Security Warning Effectiveness.” In Proceedings of the 22nd USENIX Security Symposium, 257–272. 2013.

Approach: Peer-reviewed, large-scale field study using browser telemetry data.

Findings: Across more than 25 million browser security warnings, users bypassed 33% of Mozilla Firefox’s Secure Sockets Layer (SSL) warnings and 70.2% of Google Chrome’s. They bypassed about 10% of Firefox’s malware and phishing warnings, compared with 25% of Chrome’s. Users dismissed the most common SSL errors fastest. Half bypassed Chrome’s most common SSL warning in less than 1.7 seconds, a result “consistent with the theory of warning fatigue.”

Authors’ Conclusions: Security warnings can work well when designed effectively, contrary to the assumption that users routinely ignore them. Frequent alerts can nevertheless cause warning fatigue, leading users to dismiss familiar messages without reading them.

Relevance to Disclosure Overload: Supporting. The evidence of warning fatigue suggests that repeated warnings can prompt rapid dismissal. By extrapolation, a high volume of required disclosures may produce similar overload.

Relevance to Crowding Out: None. The study examines the frequency of warnings over time, rather than whether simultaneously displayed disclosures displace other information on a screen.

Approach: Non-peer-reviewed policy analysis and commentary.

Findings: A single “all-in” pricing rule poses different problems for food-delivery platforms than for hotels or ticket sellers because delivery fees vary with each order. Requiring platforms to disclose every potential variable upfront could force them to display hypothetical estimates or adopt inefficient pricing structures. Yet collapsing all fees into one figure would prevent consumers from identifying charges, such as small-order fees, that they could avoid by changing their carts.

Authors’ Conclusions: The Federal Trade Commission should not adopt a sectorwide food-delivery rule based on its current enforcement record. If the Commission adopts a rule, it should distinguish mandatory fixed fees from contingent variable fees. Excessive detail forces consumers to “[sort] the important points from the minor detail.”

Relevance to Disclosure Overload: Direct. The authors cite federal findings that overly detailed disclosures frustrate consumers and cause them to ignore the information altogether.

Relevance to Crowding Out: None. The comment examines the timing and level of detail of variable-fee disclosures, rather than whether disclosures compete for limited screen space or consumer attention.

  • Anderson, Bonnie Brinton, Anthony Vance, C. Brock Kirwan, David Eargle, and Jeffrey L. Jenkins. “How Users Perceive and Respond to Security Messages: A NeuroIS Research Agenda and Empirical Study.” European Journal of Information Systems 25, no. 4 (2016): 364–390. https://doi.org/10.1057/ejis.2015.21.

Approach: Peer-reviewed theoretical research agenda and laboratory experiment using eye tracking.

Findings: In an eye-tracking study of 62 participants, attention to security warnings declined significantly with each successive viewing. This decline was significantly smaller for polymorphic warnings, which change their appearance between viewings.

Authors’ Conclusions: People habituate to repeated security messages and unconsciously devote less visual attention to them over time. Changing a warning’s visual presentation can substantially reduce habituation driven by “hidden (automatic or unconscious) mental processes.”

Relevance to Disclosure Overload: Supporting. The study shows that repeated warnings lose users’ attention as users become habituated and begin to ignore them unconsciously. By extrapolation, repeated disclosures may produce a similar form of overload.

Relevance to Crowding Out: None. The study measures habituation across successive warnings, rather than whether concurrently displayed information competes for limited screen space or attention.

Approach: Peer-reviewed literature review and policy analysis.

Findings: The authors document widespread failures of mandated disclosure in consumer credit, online contracts, and other fields. Consumers miscalculated finance charges by 200% because they misunderstood credit terms, suggesting that disclosure had no effect or made decisions worse. In one study of online boilerplate agreements, only about one in 1,000 consumers opened the pre-purchase disclosure, and those who did spent a median of 29 seconds reading it. The authors attribute these failures to cognitive overload and the accumulation of competing mandates: “[T]he accumulation problem arises because so many disclosures assail disclosees.”

Authors’ Conclusions: Mandated disclosure rests on faulty assumptions about human cognition and decision-making. The authors recommend abandoning it as a regulatory technique, rather than trying to improve it through simplification.

Relevance to Disclosure Overload: Direct. The article explains how cognitive overload impairs consumers’ comprehension of complex disclosures.

Relevance to Crowding Out: Direct. The article identifies an accumulation problem in which each additional disclosure competes for consumers’ finite attention with other disclosures and daily activities.

Approach: Peer-reviewed randomized field experiment.

Findings: Disclosures showing payday borrowers the cumulative dollar cost of repeatedly renewing a loan reduced borrowing by 11% over the next four months. A savings-planner treatment designed to encourage self-control had no effect, either alone or combined with the information treatments. By contrast, disclosures designed around borrowers’ cognitive biases “significantly reduce[d] the frequency and amount” of borrowing.

Authors’ Conclusions: Standard mandated disclosures assume that consumers act rationally. Reframing costs to address specific cognitive biases can change behavior. These biases include narrow bracketing, or viewing each loan in isolation, and the “peanuts effect,” or treating small recurring charges as inconsequential. The authors do not claim that targeted disclosures can solve the problems associated with payday borrowing, but they stress their low implementation cost.

Relevance to Disclosure Overload: Boundary condition. The study shows that simple, behaviorally designed disclosures can improve decisions without causing cognitive overload, even when more complex disclosures might fail.

Relevance to Crowding Out: None. The study tests disclosures delivered in physical envelopes and does not examine whether information competes for limited space in a crowded visual display.

Approach: Peer-reviewed, large-scale field experiment.

Findings: On StubHub, hiding mandatory fees until checkout increased revenue by about 21%. Buyers who saw fees only at checkout were 14.1% more likely to complete a purchase and spent 5.42% more, on average. Users who saw fees upfront often left the platform earlier, while those who encountered fees later “differentially exit[ed] at checkout.”

Authors’ Conclusions: Obscuring fees creates search friction that distorts how much consumers buy and which products they choose, steering them toward more expensive tickets. Delayed fees affect even experienced users, likely because calculating final prices imposes additional mental costs.

Relevance to Disclosure Overload: Counterevidence. Prominent upfront disclosure of mandatory fees improved consumer decision-making, undercutting the claim that additional disclosure necessarily impairs comprehension.

Relevance to Crowding Out: None. The study examines sequential price disclosure and search friction, rather than whether disclosures displace other information within a limited visual space.

  • Bollinger, Bryan, Phillip Leslie, and Alan Sorensen. “Calorie Posting in Chain Restaurants.” American Economic Journal: Economic Policy 3, no. 1 (2011): 91–128. https://doi.org/10.1257/pol.3.1.91.

Approach: Peer-reviewed natural experiment using transaction data.

Findings: Mandatory calorie posting at Starbucks reduced average calories per transaction by 6%. Changes in food purchases accounted for nearly the entire reduction, while beverage choices changed little. Calories per food item fell by about 14 to 52 calories as consumers bought fewer food items and chose lower-calorie options. The policy did not reduce Starbucks’ average revenue and increased revenue at stores near competitors.

Authors’ Conclusions: Calorie posting changes consumer behavior by increasing knowledge and making calorie information more salient. The study could not directly measure the policy’s long-term effects on obesity or body mass index.

Relevance to Disclosure Overload: Counterevidence. Adding a required numerical disclosure changed consumer behavior without evidence that the additional information impaired decision-making.

Relevance to Crowding Out: None. The study measures behavioral responses to calorie posting but does not examine whether disclosures compete for limited visual space or attention.

Approach: Peer-reviewed, large-scale automated web measurement.

Findings: A scan of about 30,000 websites identified potential violations of the General Data Protection Regulation (GDPR) on 94.7% of them. Nearly 70% assumed consent before users made a choice, and 21.3% created cookies after users explicitly withheld consent. The researchers also developed a machine-learning browser extension that automatically filtered about “90% of the privacy-invasive cookies.”

Authors’ Conclusions: GDPR consent mechanisms often fail because website administrators use deceptive practices or disregard users’ choices. Client-side automation can help protect users because regulatory agencies cannot monitor the volume of potential noncompliance.

Relevance to Disclosure Overload: Context. The prevalence of defective cookie banners shows how mandated consent mechanisms can fail in practice. Attributing those failures to cognitive overload, rather than deceptive design or noncompliance, requires extrapolation.

Relevance to Crowding Out: None. The study examines compliance failures and evasion tactics, rather than spatial or attentional competition among disclosures.

Approach: Peer-reviewed, large-scale automated web measurement.

Findings: The researchers evaluated 97,000 websites subject to the General Data Protection Regulation (GDPR). Among sites offering an opt-out option, 65.4% still collected user data after users explicitly withheld consent. Another 73.4% set analytics or advertising cookies before users interacted with the cookie notice. The researchers also found forced-action dark patterns on 46.4% of websites with notices.

Authors’ Conclusions: Widespread noncompliance has rendered the current notice-and-consent framework ineffective. Popular websites were especially likely to display apparently compliant notices while disregarding users’ choices and continuing to collect data. Regulators need automated tools to detect deceptive designs and enforce privacy rules at scale.

Relevance to Disclosure Overload: Context. The study documents widespread failure within a mandated notice-and-consent system. It attributes that failure to deceptive design and noncompliance, rather than cognitive overload among users.

Relevance to Crowding Out: None. The study examines consent evasion and compliance failures, rather than whether disclosures displace other valuable information or compete for users’ attention.

  • Campos, Sarah, Juliana Doxey, and David Hammond. “Nutrition Labels on Pre-Packaged Foods: A Systematic Review.” Public Health Nutrition 14, no. 8 (2011): 1496–1506. https://doi.org/10.1017/S1368980010003290.

Approach: Peer-reviewed systematic review.

Findings: The review examined 120 articles. Although more than 50% of consumers typically reported using nutrition labels, many struggled to apply quantitative nutrition information. Labels that required calculations involving serving sizes caused particular confusion, especially among consumers with less education. Simplified formats, such as front-of-package traffic-light labels, significantly increased “consumer ability to identify healthier food options.”

Authors’ Conclusions: Mandatory nutrition labels offer a cost-effective population-level intervention, but complex numerical formats remain inaccessible to many consumers. Regulators should simplify label content and test new formats that consumers with varying literacy levels can understand.

Relevance to Disclosure Overload: Supporting. The review finds that dense, calculation-heavy disclosures confuse consumers and impair comprehension.

Relevance to Crowding Out: None. The review examines the format and comprehensibility of individual package labels, rather than spatial competition among multiple disclosures.

  • Chetty, Raj, Adam Looney, and Kory Kroft. “Salience and Taxation: Theory and Evidence.” American Economic Review 99, no. 4 (2009): 1145–1177. https://doi.org/10.1257/aer.99.4.1145.

Approach: Peer-reviewed field experiment and natural experiment.

Findings: In a grocery-store experiment, displaying tax-inclusive shelf prices reduced demand for treated products by about 8% relative to the control groups. State-level data likewise showed that increases in salient excise taxes reduced alcohol consumption substantially more than equivalent increases in less salient sales taxes. Survey data showed that the median consumer understood the tax status of most goods, indicating that “salience effects,” rather than a lack of knowledge, drove the weaker response to sales taxes.

Authors’ Conclusions: Consumers systematically underreact to less salient taxes because they focus on posted prices while shopping, contrary to the neoclassical assumption that consumers fully account for all costs. Policymakers therefore need both tax-demand and price-demand curves to estimate taxation’s welfare effects accurately.

Relevance to Disclosure Overload: Counterevidence. Making tax information salient at the point of purchase changed consumers’ choices in the expected direction, indicating that an additional upfront disclosure can improve price comprehension.

Relevance to Crowding Out: Context. The study shows that consumers often overlook less salient price information, consistent with finite attention. It does not directly examine whether disclosures physically displace one another.

  • de Clippel, Geoffroy, Kfir Eliaz, and Kareen Rozen. “Competing for Consumer Inattention.” Journal of Political Economy 122, no. 6 (2014): 1203–1234. https://doi.org/10.1086/676931.

Approach: Peer-reviewed theoretical model.

Findings: The authors model consumers with limited capacity to inspect goods across multiple markets. Consumers use market leaders’ prices to decide which markets merit closer examination. This creates “cross-market competition for their inattention,” prompting market leaders to lower prices to avoid scrutiny. As a result, reducing average consumer attention—while holding constant the share of fully inattentive consumers—can increase consumer welfare by lowering average prices.

Authors’ Conclusions: Limited attention creates competition among firms in otherwise independent markets. Partially inattentive consumers may miss the best individual deals, but firms’ efforts to avoid attracting scrutiny can exert downward pressure on prices and benefit consumers overall.

Relevance to Disclosure Overload: Context. The model assumes that consumers have limited cognitive capacity. Applying that mechanism to comprehension failures caused by mandated disclosures requires extrapolation.

Relevance to Crowding Out: Direct. The model shows how multiple markets compete for finite consumer attention: Investigating one product or market leaves less capacity to examine another.

  • DellaVigna, Stefano, and Elizabeth Linos. “RCTs to Scale: Comprehensive Evidence from Two Nudge Units.” Econometrica 90, no. 1 (2022): 81–116. https://doi.org/10.3982/ECTA18709.

Approach: Peer-reviewed meta-analysis and review of administrative randomized controlled trials (RCTs).

Findings: Across 126 trials involving 23.5 million people, behavioral nudges implemented at scale, such as simplified communications and reminders, increased target behaviors by an average of 1.4 percentage points. This represented an 8% improvement over the control groups. A meta-analysis of 26 published academic studies found a much larger average effect of 8.7 percentage points. Statistical modeling indicated that publication bias accounted for about 70% of the difference.

Authors’ Conclusions: Behavioral nudges in government settings produce meaningful, statistically significant improvements at low marginal cost. Their effects at scale are much smaller than the published academic literature suggests because journals disproportionately publish large, statistically significant results.

Relevance to Disclosure Overload: Context. The study finds that simplifying administrative communications can improve take-up, suggesting that reducing informational complexity aids decision-making. This provides indirect evidence for the inverse of disclosure overload.

Relevance to Crowding Out: None. The study compares the effectiveness of large-scale behavioral nudges with published academic findings but does not examine competition among simultaneous disclosures.

  • Downs, Julie S., Jessica Wisdom, and George Loewenstein. “Helping Consumers Use Nutrition Information: Effects of Format and Presentation.” American Journal of Health Economics 1, no. 3 (2015): 326–344. https://doi.org/10.1162/ajhe_a_00020.

Approach: Peer-reviewed field and laboratory experiments.

Findings: Providing raw numerical calorie information had almost no effect on midday snack choices compared with providing no information. Combining calorie information with a choice-architecture nudge that placed lower-calorie items earlier in a sequence helped consumers use the information. Poorly combined interventions could backfire. In one experiment, a simple primacy nudge “is completely reversed when calorie information is posted.”

Authors’ Conclusions: Raw information produces little behavioral benefit when consumers find it difficult to process. Simpler heuristic cues, such as traffic-light labels and sequenced choices, show greater promise. Policymakers should test interventions in combination because they can trigger different psychological processes, produce nonadditive effects, or backfire.

Relevance to Disclosure Overload: Direct. Raw numerical calorie disclosures failed to improve decisions because consumers struggled to process them, while simpler formats proved more effective.

Relevance to Crowding Out: Context. The study shows that multiple interventions can interact and interfere with one another, suggesting that an added disclosure may weaken another nudge. Applying this finding to competition for visual space requires extrapolation.

Approach: Primary legal authority from the California Supreme Court.

Provisions/Holding: The California Supreme Court held that the Federal Food, Drug, and Cosmetic Act preempted California’s Proposition 65 requirement that nicotine-replacement therapy products carry a reproductive-toxicity warning. The U.S. Food and Drug Administration (FDA) had adopted a uniform, carefully tailored warning about the products’ risks during pregnancy. The agency sought to inform pregnant women without discouraging them from using the products to stop smoking. The FDA rejected the Proposition 65 warning because it “would have the effect of misleading consumers.” The court also cited the “dangers of overwarning and of less meaningful warnings crowding out necessary warnings.”

Procedural Status: The California Supreme Court reversed the judgment of the Court of Appeal.

Relevance to Disclosure Overload: Direct. The court relied on the FDA’s determination that excessive warnings about remote risks could mislead consumers and prompt medically harmful choices, such as continuing to smoke.

Relevance to Crowding Out: Context. The court expressly recognized that less meaningful warnings can crowd out necessary ones, supporting the concept of attentional displacement.

Approach: Primary legal authority from an agency rulemaking.

Provisions/Holding: Acting under the Infrastructure Investment and Jobs Act, the Federal Communications Commission requires broadband internet service providers to display a uniform consumer label at the point of sale. The label must disclose prices, introductory rates, data allowances, and performance metrics. To limit information overload, the Commission requires links to detailed network-management practices and privacy policies instead of placing that information on the label. It concluded that detailed privacy information “would likely overwhelm consumers and not benefit them at the point of sale.”

Procedural Status: The final rule took effect January 17, 2023.

Relevance to Disclosure Overload: Direct. The Commission excluded detailed network-management and privacy information because complex disclosures could overwhelm consumers, make the label unwieldy, and impede comparison shopping.

Relevance to Crowding Out: Supporting. The Commission recognized that a label has limited space and that excessive detail could obscure more important purchasing information. Applying that conclusion to a broader theory of crowding out requires some extrapolation.

Approach: Primary legal authority from an agency rulemaking.

Provisions/Holding: The Federal Communications Commission proposed eliminating several broadband-label requirements, including verbatim telephone readings, itemization of location-dependent fees, and machine-readable data. The Commission reasoned that these mandates may impose “unnecessary costs and burdens on providers” without making the labels more useful to consumers. It explained that a visual label does not translate easily into a telephone conversation and that itemizing fees that vary by location may require numerous labels for the same service.

Procedural Status: The comment period closed January 2, 2026, and the reply-comment period closed February 2, 2026. The Commission adopted a final rule on July 22, 2026. The final rule permits conversational telephone summaries and aggregated presentation of location-dependent fees, eliminates the machine-readable-data requirement, and makes other changes. Most provisions take effect September 14, 2026.

Relevance to Disclosure Overload: Direct. The proposal identifies potential confusion from requiring representatives to recite a visual label verbatim over the telephone, where consumers cannot review the information at their own pace.

Relevance to Crowding Out: Supporting. The proposal treats detailed itemization of variable fees as a potential source of consumer confusion. This concern supports the premise of competition for finite attention, though the connection remains inferential.

Approach: Non-peer-reviewed agency guidance and policy analysis.

Provisions/Holding: The Federal Trade Commission states that disclosures must remain clear and conspicuous across digital platforms, including mobile devices with limited screen space. Information needed to prevent deception should appear as close as possible to the claim it qualifies because scrolling increases the likelihood that consumers will miss it. The FTC also cautions that essential disclosures do not become effective merely because they appear in lengthy terms-of-use agreements. Such disclosures “should not be relegated to them.”

Procedural Status: FTC staff guidance rather than a binding regulation.

Relevance to Disclosure Overload: Direct. The guidance recognizes that burying important information in lengthy text prevents consumers from finding and understanding it.

Relevance to Crowding Out: Direct. The guidance explains how limited screen space and competing visual elements can reduce a disclosure’s prominence and divert consumers’ attention.

Approach: Primary legal authority from an agency rulemaking.

Provisions/Holding: Acting under 15 U.S.C. § 57a, the Federal Trade Commission declared it unfair and deceptive for live-event ticketing and short-term lodging businesses to advertise prices that omit mandatory fees. The rule requires businesses to display the total price more prominently than other pricing information, except the final payment amount. Before consumers consent to pay, businesses must disclose the nature, purpose, and amount of excluded charges, such as government and shipping fees. The Commission declined to require affirmative disclosure of each fee’s refundability because extensive qualifications could make such disclosures “impractical for businesses and confusing to consumers.”

Procedural Status: Final rule in effect since May 12, 2025.

Relevance to Disclosure Overload: Boundary condition. The Commission declined to require businesses to list the refundability conditions for every fee because extensive, itemized disclosures could confuse consumers and impede clear price communication.

Relevance to Crowding Out: None. The rule addresses the prominence and timing of total-price disclosures. The Commission rejected objections that upfront total-price disclosure would unduly constrain other price presentations, but it did not analyze attentional displacement among disclosures.

Approach: Primary legal authority from an agency rulemaking.

Provisions/Holding: Acting under Section 18 of the Federal Trade Commission Act, the FTC requested comments on a potential rule addressing unfair or deceptive fees on online food-delivery platforms. The agency describes platforms advertising free or low-cost delivery before adding mandatory service, small-order, or other fees at checkout. Consumers may underestimate the total cost and decline to restart their search because of the “perceived futility of doing so.” The FTC asked whether a rule should require disclosure of the total price or mandatory fees earlier in the transaction.

Procedural Status: The comment period closed May 18, 2026. The proceeding remains at the advance-notice stage.

Relevance to Disclosure Overload: Context. The notice considers whether platforms should disclose variable fees upfront, which raises potential overload concerns. The document itself focuses on deception caused by drip pricing, rather than excessive disclosure.

Relevance to Crowding Out: None. The notice examines the timing of fee disclosures and deceptive pricing, rather than whether disclosures spatially displace other information.

Approach: Non-peer-reviewed policy analysis and commentary.

Findings: The authors support the Federal Communications Commission’s proposal to eliminate several broadband-label requirements. They cite behavioral research showing that excessive itemization imposes cognitive burdens and reduces consumer welfare. Requiring telephone representatives to read visual labels verbatim also creates a burdensome and confusing interaction. Post-sale labels in customer portals provide little value when they contain static, outdated information rather than current plan terms.

Authors’ Conclusions: Disclosures work only when they help consumers make decisions. Removing location-dependent fee itemization and verbatim telephone-reading requirements would improve the signal-to-noise ratio. Once disclosures exceed consumers’ processing capacity, “decision quality deteriorates, rather than improves.”

Relevance to Disclosure Overload: Direct. Drawing on behavioral economics, the authors argue that disclosure volumes exceeding consumers’ cognitive capacity impair decision quality.

Relevance to Crowding Out: Direct. The authors argue that itemized lists of location-dependent fees create clutter that diverts attention from the total monthly price.

  • Gabaix, Xavier. “Behavioral Inattention.” In Handbook of Behavioral Economics, vol. 2, edited by B. Douglas Bernheim, Stefano DellaVigna, and David Laibson, 261–343. Elsevier, 2019. https://doi.org/10.1016/bs.hesbe.2018.11.001.

Approach: Peer-reviewed literature review and theoretical framework.

Findings: Across empirical studies, the mean attention parameter is 0.44, placing consumers roughly midway between full attention and complete inattention. The author develops a sparsity-based model in which people weigh the benefits of greater attention against its cognitive costs. They therefore systematically underweight or ignore variables they consider less important. This bounded rationality produces asymmetric Slutsky matrices and excess price volatility.

Authors’ Conclusions: Behavioral inattention is widespread and can be modeled tractably. People anchor on simplified default models and adjust only partially toward more accurate assessments. Incorporating limited attention into microeconomic theory can overturn standard results, including the symmetry of the Slutsky matrix and the efficiency of competitive equilibria.

Relevance to Disclosure Overload: Supporting. The framework explains why consumers cannot process every available piece of information and may disregard secondary attributes, causing additional disclosures to fail.

Relevance to Crowding Out: Context. The review examines how people allocate a finite attention budget among competing attributes. Applying that framework specifically to mandated disclosures requires extrapolation.

  • Gabaix, Xavier, and David Laibson. “Shrouded Attributes, Consumer Myopia, and Information Suppression in Competitive Markets.” The Quarterly Journal of Economics 121, no. 2 (2006): 505–540. https://doi.org/10.1162/qjec.2006.121.2.505.

Approach: Peer-reviewed theoretical model.

Findings: When the share of myopic consumers is sufficiently large, a “Shrouded Prices Equilibrium” can arise. Competitive firms conceal add-on prices, sell base products below marginal cost, and charge high markups for add-ons. Firms have no incentive to educate myopic consumers because informed consumers will buy the loss-leading base product and avoid the expensive add-ons. Debiasing consumers therefore makes them unprofitable customers.

Authors’ Conclusions: High add-on markups can persist even in highly competitive markets with costless advertising because of a “curse of debiasing.” Firms lose money by educating myopic consumers, so competition alone will not eliminate inefficient information shrouding.

Relevance to Disclosure Overload: Context. The model explains why consumers overlook hidden add-on costs. Applying that mechanism to overload caused by mandated disclosures requires extrapolation.

Relevance to Crowding Out: Context. The article examines firms’ incentives to suppress information and exploit limited attention. This relates to the supply of salient information but does not address the displacement of mandatory disclosures.

Approach: Peer-reviewed meta-analysis.

Findings: The authors synthesized 272 effect sizes from 30 studies. Integrating a warning directly into a task substantially increased compliance. Warnings containing words also produced greater compliance than pictures alone. By contrast, “an increase in clutter on the warning induced a lower level of behavioral compliance.”

Authors’ Conclusions: Uncluttered warnings integrated into the task produce the highest compliance. Warnings should nevertheless serve as a last line of defense because their overall ability to change behavior remains limited.

Relevance to Disclosure Overload: Supporting. The finding that visual clutter reduces compliance directly supports the premise that excessive information impairs processing and decision-making.

Relevance to Crowding Out: Context. Integrating warnings into the primary task improves compliance, suggesting that competing information can reduce their effectiveness. Applying this finding specifically to competition for screen space requires extrapolation.

  • Kielty, Patrick D., K. Philip Wang, and Diana L. Weng. “Simplifying Complex Disclosures: Evidence from Disclosure Regulation in the Mortgage Markets.” The Accounting Review 98, no. 4 (2023): 191–216. https://doi.org/10.2308/TAR-2021-0269.

Approach: Peer-reviewed difference-in-differences analysis using loan-level data.

Findings: The TILA-RESPA Integrated Disclosure (TRID) rule reduced mortgage-disclosure word counts by 65%. After its implementation, inexperienced first-time homebuyers obtained significantly lower interest rates relative to experienced repeat buyers. Higher points or upfront fees did not offset these savings, and the effect was strongest in areas with greater lender density. The simplified disclosures did not improve delinquency rates.

Authors’ Conclusions: Simplifying complex, duplicative disclosures lowers consumers’ processing costs, helping them comparison shop and avoid predatory lenders. By reducing information overload, “less disclosure makes borrowers better off.”

Relevance to Disclosure Overload: Direct. The study provides empirical evidence that reducing the volume and complexity of mandated disclosures improves consumer understanding and financial outcomes.

Relevance to Crowding Out: None. The study measures the effects of reducing disclosure text but does not examine whether information spatially displaces competing content.

Approach: Non-peer-reviewed agency report based on 36 qualitative interviews and quantitative testing with more than 800 mortgage customers.

Findings: Existing Truth in Lending Act (TILA) and Good Faith Estimate (GFE) forms failed to communicate essential mortgage costs. About 20% of respondents could not correctly identify the annual percentage rate, cash due at closing, or monthly payment. The authors’ prototype forms “significantly improved consumer recognition of mortgage costs” among prime and subprime borrowers, with the largest gains for complex loans.

Authors’ Conclusions: Poorly designed disclosures confuse consumers and may cause them to stop processing the information altogether. Agencies should conduct extensive consumer testing to ensure that disclosures help consumers rather than hinder them.

Relevance to Disclosure Overload: Supporting. The report shows that confusing, voluminous disclosures can cause consumers to abandon information processing, consistent with overload theories.

Relevance to Crowding Out: None. The report evaluates form design and comprehension but does not examine competition among multiple disclosures for space or attention.

  • Lacko, James M., and Janis K. Pappalardo. “The Failure and Promise of Mandated Consumer Mortgage Disclosures.” American Economic Review 100, no. 2 (2010): 516–521. https://doi.org/10.1257/aer.100.2.516.

Approach: Peer-reviewed qualitative interviews and randomized controlled experiment.

Findings: In a controlled experiment with 819 borrowers, mandated mortgage forms failed to communicate key loan terms. Nearly “nine-tenths could not identify the total amount” of upfront charges. A prototype disclosure significantly improved comprehension of costs and terms, though consumers continued to struggle with highly complex loan structures.

Authors’ Conclusions: Mandated disclosures fail because of confusing, ineffective design, rather than inherent consumer irrationality or the unavoidable complexity of modern mortgages. Policymakers should consolidate duplicative forms into a single, well-tested document. This approach could strengthen consumer protection without limiting product availability.

Relevance to Disclosure Overload: Supporting. The study shows that dense, uncoordinated disclosure mandates confuse consumers and impair comprehension, though it attributes these effects primarily to poor design.

Relevance to Crowding Out: None. The experiment measures document comprehension, rather than competition for limited screen space or attention.

  • Long, Michael W., Deirdre K. Tobias, Angie L. Cradock, Holly Batchelder, and Steven L. Gortmaker. “Systematic Review and Meta-Analysis of the Impact of Restaurant Menu Calorie Labeling.” American Journal of Public Health 105, no. 5 (2015): e11–e24. https://doi.org/10.2105/AJPH.2015.302570.

Approach: Peer-reviewed systematic review and meta-analysis.

Findings: Across 19 studies, menu calorie labels were associated with an average reduction of 18.13 kilocalories ordered per meal. Among the six highest-quality controlled studies conducted in restaurants, the estimated reduction fell to a statistically insignificant 7.63 kilocalories. Daily-calorie reference statements produced mixed results. One study found an additional reduction of 38 kilocalories, while another found no effect.

Authors’ Conclusions: The evidence provides “minimal evidence to support menu calorie labeling as a strategy” for substantially reducing calories purchased in restaurants. Findings from laboratory and other nonrestaurant settings may overstate the effects of disclosure policies in real-world settings.

Relevance to Disclosure Overload: Counterevidence. The restaurant studies found a null effect, rather than evidence that calorie disclosures worsened choices. The labels may fail to improve decisions substantially, but they do not appear to degrade them.

Relevance to Crowding Out: None. The meta-analysis estimates the isolated effect of menu labels and does not examine whether competing disclosures displace information or attention.

  • Nicoletti, Allison, and Christina Zhu. “Economic Consequences of Transparency Regulation: Evidence from Bank Mortgage Lending.” Journal of Accounting Research 61, no. 5 (2023): 1827–1871. https://doi.org/10.1111/1475-679X.12498.

Approach: Peer-reviewed difference-in-differences analysis using administrative data.

Findings: After implementation of the TILA-RESPA Integrated Disclosure (TRID) rule, approval rates fell for covered closed-end loans relative to exempt open-end loans. The simplified disclosures appeared to facilitate comparison shopping because consumers were significantly more likely to withdraw covered applications or leave them incomplete. Covered loans also became less likely to sell on the secondary market.

Authors’ Conclusions: Simplified disclosures reduce consumers’ information-processing costs, improve comparison shopping, and constrain high bank fees. The same regulation imposes compliance costs and creates secondary-market frictions for banks, which can reduce credit availability.

Relevance to Disclosure Overload: Direct. The study shows that reducing the complexity and volume of mandated disclosures lowers processing costs and improves consumer decision-making.

Relevance to Crowding Out: None. The study examines the consumer and lender consequences of simplified disclosures, rather than spatial competition among disclosures.

Approach: Non-peer-reviewed policy analysis and literature review by an intergovernmental organization.

Provisions/Holding: The Organisation for Economic Co-operation and Development advises policymakers to “limit the prescriptiveness and extensiveness” of mandated disclosures to the minimum necessary to avoid worsening information overload. The report identifies an accumulation problem in which individually defensible disclosure mandates become overwhelming when combined. Disclosures should remain clear, accessible, and conspicuous so consumers can use them effectively.

Procedural Status: Report of the OECD Committee on Consumer Policy.

Relevance to Disclosure Overload: Direct. The report identifies information overload as a major barrier that causes consumers to disregard online disclosures.

Relevance to Crowding Out: Direct. The report recognizes an accumulation problem in which concurrent disclosures compete for consumers’ finite time and attention.

Approach: Peer-reviewed theoretical model.

Findings: In a model where experts compete for a decision-maker’s limited attention, lowering entry costs increases the number of experts. Beyond a certain point, the decision-maker tunes out and experiences lower expected utility. Under a mandatory disclosure rule, a single expert can strategically create “information overload” by adding irrelevant cues that conceal unfavorable required information. If regulators mandate a simple disclosure format, the expert may pursue “complexification” by disaggregating the product’s payoff structure until relevant information exceeds the consumer’s attention limit.

Authors’ Conclusions: Limited attention permits firms to manipulate consumers’ focus, making simple disclosure rules ineffective or counterproductive. Because format requirements may prompt firms to increase product complexity, policymakers may need to regulate product design directly.

Relevance to Disclosure Overload: Direct. The article models how excessive information, produced by either competition or strategic firm behavior, causes consumers to tune out and make worse decisions.

Relevance to Crowding Out: Direct. The model shows how irrelevant cues exhaust consumers’ limited attention and displace valuable mandated information.

  • Rasch, Alexander, Miriam Thöne, and Tobias Wenzel. “Drip Pricing and Its Regulation: Experimental Evidence.” Journal of Economic Behavior & Organization 176 (2020): 353–370. https://doi.org/10.1016/j.jebo.2020.04.007.

Approach: Peer-reviewed theoretical analysis and laboratory experiment.

Findings: In simulated markets where comparing drip prices imposed a small search cost, sellers set drip prices near the permitted maximum and competed primarily on base prices. Relative to transparent pricing, drip pricing raised average total prices from 15.37 to 16.96, increased seller profits, and reduced buyer surplus. When the experiment randomized the maximum possible drip price, 21% of buyers mistakenly chose the more expensive option.

Authors’ Conclusions: Drip pricing discourages comparison shopping and harms consumers by causing them to underestimate final prices. Banning drip pricing promotes competition and increases consumer welfare.

Relevance to Disclosure Overload: Counterevidence. Requiring comprehensive upfront price disclosure improved decision-making, rather than impairing it.

Relevance to Crowding Out: None. The study examines sequential price disclosure and search costs, rather than concurrent competition among disclosures for space or attention.

  • Robinson, Lisa A., W. Kip Viscusi, and Richard Zeckhauser. “Efficient Warnings, Not ‘Wolf or Puppy’ Warnings.” In The Future of Risk Management, edited by Howard Kunreuther, Robert J. Meyer, and Erwann O. Michel-Kerjan, 227–248. Philadelphia: University of Pennsylvania Press, 2019. https://rzeckhauser.scholars.harvard.edu/resource/efficientwarningspdf.

Approach: Peer-reviewed book chapter combining policy analysis and economic theory.

Findings: Required trans-fat labels coincided with a 78% reduction in trans-fat consumption between 2003 and 2012, though producer reformulation drove much of the decline. In the authors’ analysis of California’s Proposition 65, 69% of consumers mistakenly associated the generic cancer warning on cereal with the much greater risks of cigarette smoking. An abundance of undifferentiated warnings may cause consumers to ignore them because they cannot “separate puppies from wolves from dragons.”

Authors’ Conclusions: Warning systems fail when they use the same “wolf or puppy” language for risks of vastly different severity. Policymakers should use benefit-cost analysis to distinguish serious hazards from minor ones and prevent consumers from becoming complacent about critical warnings.

Relevance to Disclosure Overload: Direct. The chapter explains how an excess of indiscriminate warnings impairs consumer judgment and promotes complacency.

Relevance to Crowding Out: Supporting. The authors argue that proliferating low-value warnings divert attention from serious hazards, displacing more valuable information.

  • Rummo, Pasquale E., Tod Mijanovich, Erilia Wu, Lloyd Heng, Emil Hafeez, Marie A. Bragg, Simon A. Jones, Beth C. Weitzman, and Brian Elbel. “Menu Labeling and Calories Purchased in Restaurants in a US National Fast Food Chain.” JAMA Network Open 6, no. 12 (2023): e2346851. https://doi.org/10.1001/jamanetworkopen.2023.46851.

Approach: Peer-reviewed quasi-experimental cohort study using difference-in-differences analysis.

Findings: Using nine years of transaction data from 2,329 Taco Bell restaurants, the researchers found that menu calorie labels were associated with 24.7 fewer calories purchased per transaction relative to control locations. Consumers bought fewer items, particularly tacos, and the decline was greatest during breakfast. Outside California, labeling was associated with an increase of 25.2 calories per in-store transaction but a decrease in calories purchased through drive-through orders.

Authors’ Conclusions: Consumers respond to calorie information on menu boards, producing small but sustained reductions in calories purchased over two years. Regional differences in consumer attitudes and ordering settings, including in-store and drive-through purchases, shape responses to the disclosures.

Relevance to Disclosure Overload: Counterevidence. Mandatory numerical disclosures modestly reduced calories purchased, rather than impairing consumer decision-making.

Relevance to Crowding Out: None. The study analyzes transaction data but does not examine how disclosure layout or competition among disclosures affects attention.

  • Sanchez, Christopher A., and James Z. Goolsbee. “Character Size and Reading to Remember from Small Displays.” Computers & Education 55, no. 3 (2010): 1056–1062. https://eric.ed.gov/?id=EJ892494.

Approach: Peer-reviewed laboratory experiment.

Findings: Participants reading 12-point text on a small screen recalled substantially less information than those reading the same text on a full-size display. When the font shrank to 8 points, recall on the small screen matched recall on the full-size display. Larger characters required more scrolling and fragmented the text, reducing factual recall.

Authors’ Conclusions: Character size interacts with display size. On small screens, designers must balance legibility against the scrolling and fragmentation caused by larger text. More compact text can improve recall by keeping related information together.

Relevance to Disclosure Overload: Context. The study suggests that fragmentation and scrolling impair information processing on small screens. Connecting this effect to disclosure overload requires extrapolation.

Relevance to Crowding Out: None. The study examines text size, scrolling, and recall but does not test competition among multiple disclosures.

Approach: Peer-reviewed laboratory and field experiments.

Findings: Consumers exposed to drip pricing for optional add-ons initially selected the lower-base-price option at a much higher rate than consumers who saw fees upfront, 54.5% compared with 11.7%. Even after seeing the total price and receiving an opportunity to restart their search, 24.5% of consumers in the drip-pricing group stayed with the more expensive option. Only 7.8% of the upfront-pricing group made the same mistake. Consumers exposed to drip pricing also reported significantly less satisfaction with their final choices.

Authors’ Conclusions: Drip pricing makes initial choices sticky. Consumers overestimate the time needed to restart their search and mistakenly assume that competitors charge the same fees. The use of stylized online tasks and inexperienced participants limits the findings’ generalizability to experienced consumers in real markets.

Relevance to Disclosure Overload: Counterevidence. Upfront disclosure of optional fees improved price comprehension and reduced costly mistakes.

Relevance to Crowding Out: Context. The study shows that late disclosures often fail to correct consumers’ initial choices. Applying this finding to attentional or spatial crowding requires extrapolation.

Approach: Peer-reviewed theoretical model.

Findings: Applying Shannon’s information theory, the author models decision-makers as processing information through a channel with finite capacity. Under this constraint, they respond to aggregate economic variables gradually and with delay, while their individual behavior contains high-frequency noise.

Authors’ Conclusions: Replacing the assumption of unconstrained optimization with limited information-processing capacity better explains macroeconomic fluctuations and sluggish adjustment. Treating attention as a finite resource provides a common explanation for departures from classical rational expectations.

Relevance to Disclosure Overload: Context. The model establishes a finite capacity for processing information. Applying that constraint specifically to comprehension of mandated disclosures requires extrapolation.

Relevance to Crowding Out: Context. The model imposes a strict limit on processing new information but does not examine how particular disclosures compete for that capacity.

  • Stango, Victor, and Jonathan Zinman. “Limited and Varying Consumer Attention: Evidence from Shocks to the Salience of Bank Overdraft Fees.” The Review of Financial Studies 27, no. 4 (2014): 990–1030. https://doi.org/10.1093/rfs/hhu008.

Approach: Peer-reviewed natural experiment using survey data.

Findings: Among 7,448 bank-account panelists, answering a survey with overdraft-related questions reduced the probability of incurring an overdraft fee that month by 3.7 percentage points, from a baseline rate of 26%. Repeated surveys built a “stock” of attention. Each additional survey completed over two years reduced the probability of an overdraft by 1.7 percentage points. Panelists avoided overdrafts primarily by making fewer debit-card and automatic-debit transactions, rather than by maintaining higher balances.

Authors’ Conclusions: Consumers possess a “limited, time-varying, associative, and malleable stock of attention” concerning household finance. Even uninformative prompts can focus attention and improve financial decisions, especially among consumers with less education and lower financial literacy.

Relevance to Disclosure Overload: Counterevidence. Making fee information more salient, even indirectly through surveys, reduced costly mistakes. The finding undercuts the claim that additional information necessarily impairs decision-making.

Relevance to Crowding Out: None. The study measures how attention prompts affect behavior but does not examine competition for limited screen space or displacement among disclosures.

Approach: Primary legal authority from an agency rulemaking.

Provisions/Holding: Acting under 49 U.S.C. § 41712, the U.S. Department of Transportation required air carriers and ticket agents to disclose passenger-specific fees for checked bags, carry-on bags, and ticket changes or cancellations on the first page displaying fare and schedule information. The Department found that delayed fee disclosure causes substantial consumer injury. It permitted pop-ups, expandable text, and similar formats to avoid “overcrowd[ing] web pages.”

Procedural Status: The rule carried an effective date of July 1, 2024, but the 5th Circuit stayed it on July 29, 2024. The court vacated the rule on February 3, 2026, because the Department failed to provide an opportunity for public comment on a study used in the rulemaking. On July 2, 2026, the Department formally restored the disclosure rules that preceded the 2024 rule.

Relevance to Disclosure Overload: Boundary condition. The Department permitted flexible disclosure methods because rigid textual requirements could overcrowd webpages and make information harder to use.

Relevance to Crowding Out: Direct. The rule expressly addressed screen clutter and the displacement of flight options on space-constrained mobile displays.

Approach: Primary legal authority from an agency rulemaking.

Provisions/Holding: The rule implements the 5th U.S. Circuit Court of Appeals’ vacatur of the Department’s 2024 ancillary-fee rule. The court found that the Department violated the Administrative Procedure Act by relying on a study without allowing public comment on it. The 2026 rule removes the requirement to display critical ancillary fees at the first point in an itinerary search, “reinstating the rules previously in force.” Under the restored 2011 framework, airlines and ticket agents must notify consumers on the first screen displaying a fare that baggage fees may apply and explain where consumers can find those fees. Airlines must also list ancillary fees in a central location on their websites.

Procedural Status: Final rule effective July 2, 2026, under 49 U.S.C. §§ 40113 and 41712.

Relevance to Disclosure Overload: Context. Restoring the 2011 framework reduces the information displayed during initial searches. Any reduction in cognitive burden is incidental because the rule implements a judicial vacatur based on procedural defects, rather than behavioral findings.

Relevance to Crowding Out: None. The Department issued the rule to implement the court’s procedural ruling and did not evaluate spatial or attentional competition among disclosures.

  • Utz, Christine, Martin Degeling, Sascha Fahl, Florian Schaub, and Thorsten Holz. “(Un)informed Consent: Studying GDPR Consent Notices in the Field.” In Proceedings of the 2019 ACM SIGSAC Conference on Computer and Communications Security, 973–990. New York: Association for Computing Machinery, 2019. https://doi.org/10.1145/3319535.3354212.

Approach: Peer-reviewed, large-scale field experiments and online survey.

Findings: In field experiments involving more than 80,000 website visitors, a neutral binary notice offering accept-or-decline options produced significantly more active responses than complex vendor lists. When category or vendor options were not selected by default, fewer than 0.2% of users actively accepted all tracking. Banner placement also mattered. Bottom-left banners generated the most interaction, while users often ignored top-bar banners.

Authors’ Conclusions: Consent-notice design strongly affects whether users make an active choice or accept tracking because of fatigue or defaults. Opt-out banners are “unlikely to produce intentional/meaningful consent expression,” supporting a shift toward privacy by default.

Relevance to Disclosure Overload: Boundary condition. Complex vendor lists reduced engagement relative to a simple binary choice, showing how excessive detail can discourage active decision-making.

Relevance to Crowding Out: Context. Banner placement affected engagement, and banners occupied space that otherwise displayed website content. Applying these findings to broader theories of spatial crowding requires extrapolation.

  • Vance, Anthony, Jeffrey L. Jenkins, Bonnie Brinton Anderson, Daniel K. Bjornn, and C. Brock Kirwan. “Tuning Out Security Warnings: A Longitudinal Examination of Habituation Through fMRI, Eye Tracking, and Field Experiments.” MIS Quarterly 42, no. 2 (2018): 355–380. https://doi.org/10.25300/MISQ/2018/14124.

Approach: Peer-reviewed laboratory studies using functional magnetic resonance imaging (fMRI) and eye tracking, combined with a field experiment.

Findings: During a three-week field experiment with 102 participants, adherence to repeated mobile-security warnings fell from 87% to 64%. Participants who saw polymorphic warnings, which changed appearance over time, rejected risky apps more accurately than those who saw static warnings, 76% compared with 55%. The fMRI results also showed declining responses in the right and left insula over successive days.

Authors’ Conclusions: Habituation is a neurobiological response marked by a “decreased response to repeated stimulation.” Repeated static warnings lose effectiveness as users unconsciously tune them out. Polymorphic warnings can sustain attention and improve adherence by changing their visual appearance.

Relevance to Disclosure Overload: Supporting. The study shows that repeated warnings produce habituation and progressively reduce attention and decision quality. Extending this finding to disclosure overload requires treating repetition as a source of overload.

Relevance to Crowding Out: None. The study measures habituation to warnings over time, rather than concurrent spatial displacement on a screen.

  • Verrill, Linda, Fanfan Wu, David Weingaertner, Taiye Oladipo, Lisa Lubin, Roshni Devchand, Laura Koehler, Lauren Prowse, Caroline P. Martin, and Thea Zimmerman. Front of Package Labeling Literature Review. U.S. Food and Drug Administration, April 2023. https://www.fda.gov/media/175617/download?attachment.

Approach: Non-peer-reviewed agency report and systematic literature review.

Findings: Consumers generally prefer simple front-of-package (FOP) labels, and summary systems are often easier to understand than nutrient-specific formats such as Guideline Daily Amounts. Warning labels attract attention, require less processing time, and may discourage unhealthy purchases. The evidence on actual purchasing, diets, and health outcomes remains mixed. Some studies also found that warning labels can mitigate health halos created by nutrient-content marketing claims.

Authors’ Conclusions: Simple summary symbols and interpretive labels can help consumers identify healthier foods. Government endorsement may increase confidence in these labels. The report stresses that more research is needed to determine whether FOP labels produce healthier diets and better health outcomes.

Relevance to Disclosure Overload: Supporting. The review finds that consumers generally understand simplified summary labels more easily than detailed numerical formats. This supports overload theory, though the report does not expressly attribute the difference to information overload.

Relevance to Crowding Out: Context. The review discusses interactions among FOP labels, other package marketing, and time pressure. Applying those findings to spatial or attentional crowding requires extrapolation.

Approach: Peer-reviewed difference-in-differences analysis and event study.

Findings: A Texas mandate requiring behaviorally informed disclosures before each payday loan produced a persistent 12% decline in loan volume during its first six months. The decline occurred entirely through fewer loans, rather than smaller loan amounts. The researchers found no offsetting increase in prices, delinquencies, or defaults.

Authors’ Conclusions: Behaviorally designed disclosures can substantially affect equilibrium loan quantities and lender revenue, even for simple financial products. The targeted disclosures discouraged consumers from beginning new sequences of costly debt.

Relevance to Disclosure Overload: Counterevidence. An additional mandated disclosure reduced payday borrowing without evidence that it overwhelmed consumers, undercutting the claim that added disclosure necessarily impairs decision-making.

Relevance to Crowding Out: None. The study examines the effects of a physical disclosure sheet but does not measure competition for screen space or consumer attention.

  • Weyl, E. Glen, and Michal Fabinger. “Pass-Through as an Economic Tool: Principles of Incidence Under Imperfect Competition.” Journal of Political Economy 121, no. 3 (2013): 528–583. https://doi.org/10.1086/670401.

Approach: Peer-reviewed theoretical economic modeling.

Findings: The authors extend standard tax-incidence principles to imperfectly competitive markets. Pass-through rates depend on the curvature of demand as well as the relative elasticities of supply and demand. Under monopoly, consumers and producers together bear more than the amount of the tax because the tax further reduces an already inefficiently low quantity. In symmetric imperfect competition, firms bear more of the tax relative to consumers as pricing conduct becomes less competitive, assuming a fixed pass-through rate.

Authors’ Conclusions: Tax incidence and pass-through provide a common framework for analyzing welfare and comparative statics across imperfectly competitive markets, connecting industrial organization with public finance. A principal limitation is the model’s partial-equilibrium assumption that outside alternatives are supplied competitively with no markups.

Relevance to Disclosure Overload: None. The article models tax incidence, cost pass-through, and market competition without addressing disclosure mandates, consumer comprehension, or cognitive limits.

Relevance to Crowding Out: None. The model does not examine finite attention, interface constraints, or the displacement of competing information.

[1] Rule on Unfair or Deceptive Fees in Online Food Delivery Services, 91 Fed. Reg. 20,381 (Apr. 16, 2026) (advance notice of proposed rulemaking) [hereinafter ANPRM].

ICLE Issue Brief

Out of Orbit: How Outdated Spectrum Rules Hold Back Satellite Broadband

Executive Summary The International Telecommunication Union’s (ITU) equivalent power-flux density (EPFD) limits govern how much signal power non-geostationary orbit (NGSO) systems may direct toward geostationary . . .

Executive Summary

The International Telecommunication Union’s (ITU) equivalent power-flux density (EPFD) limits govern how much signal power non-geostationary orbit (NGSO) systems may direct toward geostationary orbit (GSO) receivers. Adopted in 2000, those limits rest on outdated reference links, antenna patterns, propagation models, and worst-case assumptions. They also treat NGSO systems as functionally subordinate even though NGSO and GSO systems generally hold co-primary rights in the relevant spectrum bands. The result is an overly conservative regime that restricts coverage, power, and spectrum reuse while leaving valuable capacity idle.

A modern framework should replace theoretical masks with performance-based standards tied to actual network effects. Existing rules for nearby frequency bands, U.S. sharing frameworks, and the interference GSO systems already tolerate from one another all point toward similar benchmarks. For systems using adaptive coding and modulation (ACM), long-term protection should focus on throughput degradation, while short-term protection should measure absolute increases in link unavailability. For systems that do not use ACM, an interference-to-noise ratio (I/N) can provide a more appropriate measure. Field tests in Romania, Colombia, Nigeria, Botswana, and Jordan show that these standards can permit far more intensive NGSO operations without materially degrading GSO service.

Reform would yield benefits well beyond the satellite industry. More efficient spectrum use would increase capacity, lower deployment costs, strengthen competition, and expand broadband access in rural and remote areas. The United States has already begun implementing performance-based rules domestically, creating a practical model for international reform. Administrations should use that operational record to build consensus before the 2027 World Radiocommunication Conference (WRC-27), reject cosmetic changes that preserve the current regime’s core defects, and modernize Article 22 around verifiable performance rather than obsolete precaution.

I. Introduction

In the final minutes of the 11th plenary meeting concluding the International Telecommunication Union’s (ITU) 2023 World Radiocommunication Conference (WRC-23), delegates issued a clear directive:

[T]o ensure the rational, equitable, efficient and economical use of the radio-frequency spectrum and associated orbit resources, with a focus on non-GSO satellite systems including compatibility among systems. . . . WRC-23 invites ITU-R to conduct technical studies on the EPFD limits in Article 22 . . . in order to ensure the continued protection of GSO FSS and BSS networks, and to inform WRC-27 of the results of the studies[.][1]

That directive followed mounting evidence before both the ITU and national regulators that critical spectrum resources remain underused and inefficiently allocated. The equivalent power-flux density (EPFD) limits exemplify the problem. These limits govern how much signal power a non-geostationary orbit (NGSO) satellite system may deliver to the receiving antennas of a geostationary orbit (GSO) system. They have remained largely unchanged since their adoption in 2000.

The limits originally sought to provide GSO operators with stable expectations about interference protection. Over time, however, they have become perhaps the largest regulatory constraint on next-generation satellite broadband. Launching, operating, and maintaining communications infrastructure hundreds of kilometers above Earth already presents formidable technical and commercial challenges. Outdated EPFD limits add an avoidable one.

Satellite technology has advanced considerably since 2000. The rules have not. The task now is to preserve appropriate protection for GSO infrastructure without unnecessarily constraining newer NGSO systems.

Some national administrations have begun that work. The United States, for example, recently adopted new interference-protection criteria for certain satellite communications within its jurisdiction. At the same time, the ITU Radiocommunication Sector’s Working Party 4A is conducting technical studies and developing recommendations for the 2027 World Radiocommunication Conference (WRC-27).

The immediate question for policymakers, regulators, and satellite operators is what to expect as the ITU completes those studies and prepares for WRC-27. The broader questions are more consequential: How should the EPFD regime change? What level of protection should GSO systems receive? And do special protections designed for an earlier satellite market remain justified as communications increasingly shift toward low-Earth orbit (LEO)?

This issue brief addresses both the immediate process and the longer-term policy stakes. Section II explains how the ITU developed the EPFD limits more than 25 years ago, including the assumptions and methods that shaped them. Section III identifies potential areas for reform, drawing on recently adopted sharing regimes in nearby frequency bands and analogous rules governing NGSO and GSO systems within national jurisdictions. Section IV examines the first real-world tests of modernized protection limits on operating satellite infrastructure and shows that updated limits can protect GSO systems while giving NGSO operators greater flexibility. Section V assesses the economic and social benefits of technically sound interference protections in core satellite bands. Section VI then maps the path to reform, from action by national administrations to the adoption of updated international limits through the ITU.

II. An EPFD Regime Built for a Vanished Satellite Market

Nearly 30 years ago, the international community adopted EPFD limits to restrict how much signal power NGSO systems could impose on GSO networks.[2] Because satellite operators share spectrum, some interference safeguards were necessary. The limits aimed to protect incumbent GSO networks in heavily used fixed-satellite service (FSS) bands from NGSO systems that, at the time, remained largely theoretical.

But the rules did more than manage interference. They created a hierarchy. Although NGSO and GSO systems generally hold co-primary status in the relevant bands, the EPFD regime effectively made NGSO operations subordinate to any GSO system using the same frequencies. No express allocation rule required that result. The methodology simply built second-class treatment into the interference limits.

That imbalance has aged poorly. Much of the satellite industry’s recent growth has occurred in LEO. NGSO systems now account for more than 90% of new satellite-broadband capacity, a share that has tripled in five years.[3] Nearly all active satellites launched in 2025 entered LEO,[4] and commercial subscriptions to NGSO broadband services now substantially exceed those to GSO services.[5]

Whatever rationale once supported treating NGSO systems as secondary no longer fits the market.[6] As the United States has observed, EPFD limits “represent the most constraining regulatory restrictions imposed on non-GSO systems” and rest on assumptions that “significantly differ from the modern satellite systems in operation and under development today.”[7]

Three features explain the disconnect. First, the regime relies on obsolete GSO reference links, antenna patterns, propagation models, and worst-case geometries that exaggerate interference risk. Second, its aggregate and single-entry limits emerged from incomplete technical analysis, arbitrary assumptions, and political compromise. Third, those flaws force NGSO operators to avoid large portions of the GSO arc, reduce transmission power, and limit the number of satellite beams that simultaneously serve a location on the same frequencies—sacrificing coverage, capacity, and service quality even where harmful interference is unlikely.

A. Outdated Assumptions Embedded in the EPFD Limits

The EPFD limits rest on a set of reference links, antenna patterns, and operating assumptions intended to approximate GSO systems at the time. More than 25 years later, many of those inputs no longer reflect how modern satellite networks operate. The result is a methodology that often overstates likely interference and unnecessarily constrains NGSO systems.

1. GSO Reference Links

Developing the EPFD limits first required selecting representative GSO links against which to simulate the aggregate interference from NGSO systems.[8] The ITU supplied those reference links through Circular Letter 116.

Subsequent analyses have identified several problems with both the reference links and their use in developing the limits. Most notably, many of the assumed power levels, noise temperatures, and other technical parameters have been obsolete for years. The links reflect an era before modern signal-filtering techniques, when GSO receivers were more vulnerable to interference.

Modern GSO systems operate under different conditions. Operators often use power levels above those assumed in the reference links and deploy advanced filtering and signal-processing tools, including adaptive coding and modulation (ACM),[9] which adjusts a signal in response to changing link conditions. The propagation models used in the current EPFD methodology are also more than 10 generations old.[10] The calculation therefore rests on a baseline that no longer resembles modern GSO operations.

2. Antenna Patterns

The EPFD methodology also relies on theoretical receive-antenna patterns developed for the parabolic antennas common at the time.[11] Those patterns assume greater sensitivity to off-axis interference than modern equipment typically exhibits.

In particular, the average sidelobes of modern antennas—the areas outside the main communications beam where unwanted signal reception may occur—are substantially lower than the theoretical patterns used in the EPFD calculations. The methodology therefore exaggerates the interference that NGSO systems are likely to cause. One estimate finds that the current antenna assumptions overstate the EPFD reaching GSO receivers by 7.7 decibels.[12]

3. Worst-Case Geometry

The ITU methodology further assumes a worst-case geometry in which a GSO system shares a frequency with the NGSO satellite nearest the GSO arc. That approach effectively presumes that an NGSO operator with several satellites in view will select the one most likely to cause harmful interference. The EPFD limits thus treat the least favorable possible alignment as though it were typical. For links that do not present this worst-case geometry, received signal power may be as much as 30 decibels—or 1,000 times—below the current short-term EPFD limits.[13]

B. Arbitrary Aggregate and Single-Entry Limits

After settling on the design assumptions described above, ITU working groups conducted studies from 1997 to 1999 to determine how much interference protection the EPFD regime should provide.[14] The resulting framework never fully resolved the underlying technical questions. Its weaknesses become clearer when the limits are separated into their aggregate and single-entry components.

1. Aggregate Interference Metrics

Interference-protection frameworks for FSS systems traditionally rely on two measures. A short-term criterion addresses sporadic, high-intensity interference that may temporarily make a communications link unavailable. A long-term criterion addresses persistent interference that raises the background noise floor and reduces data-transmission rates.[15]

Put more simply, the short-term measure limits how often a link may fall below the minimum performance needed to carry data. The long-term measure limits how much continuing interference a bandwidth-constrained communications channel must tolerate.

When the ITU developed the EPFD limits, it reached consensus only on the short-term criterion. Recommendation S.1323 had recently assigned interference from NGSO systems 10% of the aggregate unavailability allowance for FSS networks operating below 30 gigahertz.[16] The EPFD regime adopted the same figure, concluding that “[i]nterference from Non-GSO systems to GSO networks should be responsible for 10% (aggregate) of the unavailability time in a GSO network.”[17]

Later analysis has shown that the 10% relative measure—and relative interference measures more generally—lacks a sound technical basis.[18] Current ITU studies acknowledge that the record does not explain why delegates selected 10% or how they derived it.

The long-term criterion presented an even greater problem. Existing recommendations offered no benchmark, and administrations could not agree on an appropriate protection level. Yet some long-term limit was necessary to permit co-frequency operations while giving GSO operators predictable protection. Without a uniform, technically validated standard, administrations attempted to extrapolate long-term limits from the agreed short-term criterion.

That approach conflated two distinct forms of interference. Short-term and long-term criteria address different phenomena, which is precisely why both exist. Deriving one from the other required administrations to construct operating limits without a reliable technical foundation.

The resulting proposals varied dramatically. For Ku-band downlinks, the United States proposed a long-term EPFD limit 20 times more restrictive than France’s proposal.[19] In the Ka-band, France proposed a limit 30 times more restrictive than the U.S. proposal.[20] These disparities reflected the arbitrary method used to derive the limits, not meaningful differences in interference risk.

The international community nevertheless adopted both short-term and long-term EPFD limits at WRC-2000. With little technical evidence to guide the long-term standard, political bargaining filled the void. The Radio Regulations imposed different EPFD masks across frequency bands, but those distinctions did not consistently track propagation characteristics or other technical conditions. They instead reflected which GSO operators occupied each band and how much influence their administrations wielded at the ITU.

In parts of the Ku-band, delegates adopted a compromise near the median of the competing long-term proposals.[21] In the upper Ka-band, they selected the most restrictive proposal on the table.[22] Those aggregate limits remain in force. Because they emerged from uncertain calculations and political compromise, they often provide GSO networks with more protection than technical conditions warrant. The result is an overly conservative regime that constrains NGSO operations and leaves valuable satellite spectrum underused.[23]

2. Single-Entry Metrics

Aggregate limits define the total interference that a GSO system must tolerate, but they do not tell an individual NGSO operator how much interference its system may generate. The ITU therefore had to divide the aggregate allowance into single-entry limits for each constellation.

Here again, the final measure emerged from negotiations among administrations rather than a clearly demonstrated technical standard.[24] The ITU drew from Recommendation S.1323 and assumed that 3.5 homogeneous NGSO systems would operate simultaneously.[25] It then apportioned the aggregate allowance among those systems, producing an individual long-term interference-to-noise ratio (I/N) of roughly -20 decibels for 80% of the time. That threshold would be considered conservative for most secondary uses of a spectrum band.

The calculation also assumed that every NGSO system would resemble SkyBridge, the proposed constellation used as the reference model.[26] SkyBridge never became commercially viable and never launched a commercial satellite. Today’s EPFD limits therefore rest partly on the architecture of a system that never operated.

These assumptions have not aged gracefully. Combined with the framework’s broader methodological flaws, they produce limits that are excessively conservative, waste spectrum capacity, and impose unnecessary constraints on modern LEO constellations.

C. How the EPFD Limits Constrain NGSO Operations

Flawed design assumptions and an unreliable calculation methodology have produced EPFD limits that are far more conservative than modern operating conditions require. To comply, NGSO operators generally must rely on some combination of three responses: avoiding the GSO arc, reducing transmission power, and limiting the number of co-frequency beams.

1. Arc-Avoidance Angles

GSO satellites typically operate with 2 to 3 degrees of separation along the GSO arc. Yet NGSO systems may have to avoid that arc by as much as 18 degrees.

These wide exclusion zones can reduce NGSO coverage by more than 30%, particularly near the equator and at midlatitudes. Operators must then launch additional satellites to compensate for coverage that the rules, rather than any demonstrated interference risk, have taken away.[27]

2. Power Limits

NGSO operators must also reduce transmission power to limit the signal reaching GSO receivers. These restrictions can apply even when an NGSO transmission falls well outside the required arc-avoidance angle.

Lower power means lower data rates and weaker signal performance for NGSO users. The regime thus sacrifices service quality even where the risk of harmful interference may be slight.

3. Number of Co-Frequency Beams

NGSO operators may also limit the number of satellite beams that simultaneously serve a location on the same frequencies, a measure known as “Nco.” This constraint sharply reduces spectrum reuse and system capacity.

Under the current EPFD limits, operators may have to disable beams from satellites that sit well outside the GSO arc but still exceed the prescribed protection criteria. As a result, substantial portions of an NGSO constellation may remain unavailable to serve consumers even when they pose no realistic risk of harmful interference.

Taken together, these constraints underscore the EPFD regime’s growing disconnect from modern satellite operations. The limits rested on questionable assumptions when adopted and have become still less defensible as technology has advanced.

Reform should stop treating each NGSO system as though it holds secondary status in shared satellite bands. It should instead rely on verifiable metrics grounded in measured signal performance, not theoretical worst cases or arbitrary thresholds. The next section outlines a methodology for building that more modern sharing framework.

 III. Building a Modern Performance-Based Framework

Since the ITU adopted the EPFD limits in 2000, technological innovation has transformed both the economics and operation of satellite communications. The existing rules belong to an earlier era. A modern framework should reflect today’s multi-orbit satellite market and focus on measurable effects on system performance and consumers.

Reform should begin with metrics grounded in real-world evidence and modern satellite capabilities, including ACM. Three existing benchmarks offer a practical foundation: the Q- and V-band sharing regime, the FCC’s NGSO-NGSO framework, and the interference levels GSO systems already accept from one another. Together, they point toward performance-based standards for both long-term throughput degradation and short-term link unavailability.

The framework must also account for GSO systems that do not use ACM, using I/N thresholds where throughput-based metrics do not fit. And any revised standard must rest on updated reference links, antenna patterns, and simulation methods that reflect how modern constellations actually operate.

This section focuses on single-entry limits, which remain the principal concern of national administrations and the ITU. Aggregate limits raise separate questions that require further study. For now, the more urgent task is to define clear, enforceable rights and obligations for individual constellations so operators can invest and deploy with predictable expectations.

A. Performance-Based Interference Benchmarks

Modernizing the EPFD regime does not require inventing a new framework from scratch. Regulators already use performance-based sharing rules in nearby frequency bands and in analogous NGSO-NGSO and GSO-GSO settings. Each offers a practical benchmark for replacing abstract worst-case assumptions with limits tied to actual system performance.

1. Q- and V-band Sharing Regime

The shortcomings of the existing EPFD limits have been widely discussed in international forums. By 2019, the international community had identified many of the regime’s inefficiencies and counterintuitive results.[28] When the ITU turned to previously undefined FSS frequencies between 37.5 and 51.4 gigahertz, commonly known as the Q- and V-bands, it faced a basic choice: repeat the EPFD model or adopt a framework better suited to modern satellite systems.

The ITU chose the latter. It approved two resolutions that rejected the existing EPFD limits in favor of an NGSO-GSO sharing methodology tied to actual system performance.[29]

That approach reflected the widespread use of ACM, which allows a satellite link to remain connected as signal conditions deteriorate by reducing its data rate. Rather than treating any degradation as a binary loss of service, the new methodology measures how interference affects throughput over time.

More specifically, the framework calculates the time-weighted average amount of data transmitted per hertz of spectrum, using the carrier-to-noise ratio measured across GSO reference links under ITU Recommendation S.2131.[30] That process produced a consensus long-term, single-entry protection criterion of 3% degraded throughput.[31] If interference from an NGSO system reduces a GSO system’s throughput by more than 3%, the NGSO operator must adjust its operations.[32]

The growing use of ACM along the GSO arc strengthens the case for applying a similar throughput-based methodology elsewhere. Although propagation conditions differ somewhat between the Q- and V-bands and the more heavily used Ku- and Ka-bands, the newer framework provides a technically grounded benchmark for reform.

2. NGSO-NGSO Analogy

A second benchmark comes from sharing rules already used within the same Ku- and Ka-band frequencies now governed by EPFD limits.[33] In the United States, the Federal Communications Commission (FCC) has adopted a framework for sharing among NGSO systems with different access priorities based on the order in which their applications were processed.[34]

The FCC’s rules for protecting earlier-round NGSO systems from later entrants draw directly from the ITU’s Q- and V-band methodology.[35] The principal difference concerns short-term interference. After reviewing hundreds of simulations, the FCC concluded that relative short-term metrics perform poorly for ACM-enabled systems. It instead adopted an absolute increase in link unavailability of 0.4%.[36] For long-term interference, it retained the same 3% degraded-throughput threshold.

Using NGSO-NGSO sharing rules as a reference point for GSO protection rests on a straightforward premise: NGSO systems no longer warrant secondary treatment. If a performance threshold allows NGSO systems to share spectrum with one another, it offers a natural starting point for NGSO-GSO sharing as well. Receivers, after all, do not care where interference originates. A signal remains interference whether it comes from a satellite at 1,400 kilometers or 35,786 kilometers. A performance-based threshold therefore should not vary merely because the interfering system occupies a different orbit.

Nearly all satellite operators participating in the FCC proceeding agreed that the Ku- and Ka-bands should at least use the same 3% long-term throughput-degradation criterion.[37] Unless GSO receivers are materially more sensitive than NGSO receivers, the NGSO-NGSO standard offers a reasonable baseline. If GSO equipment does require exceptional protection, GSO operators should bear the burden of justifying that exception rather than shifting its cost across the NGSO ecosystem.[38]

3. GSO-GSO Analogy

The NGSO-NGSO comparison is not exact. GSO systems often use relatively static spot beams with large coverage areas, while NGSO systems use dynamic beams over much smaller footprints.[39] A third approach therefore looks to how GSO systems share spectrum with one another.

GSO systems typically account for interference from their first- and second-order neighbors, extending roughly 6 degrees in each direction along the GSO arc. Beyond that range, interference is generally considered negligible, and operators usually need not coordinate.

If satellite systems sharing the same bands should face comparable obligations, those accepted GSO-GSO conditions can help define when interference protection is no longer necessary. They can also serve as a basis for deriving appropriate NGSO obligations.

Recent studies in the ITU’s Working Party 4A have taken this approach.[40] The studies model a hypothetical GSO satellite 6.5 degrees from a victim GSO link and estimate the interference produced when both systems use the same frequency at a common terrestrial location. They then calculate the resulting short-term unavailability and long-term throughput degradation.

Those values provide de facto benchmarks for acceptable interference because GSO operators generally do not consider coordination necessary at that separation.[41] Put differently, if GSO systems routinely tolerate a given level of interference from one another, they should be able to tolerate the same level from NGSO systems using the same spectrum.

The contrast with the current EPFD regime is stark. As the studies explain, “non-GSO systems must protect GSO networks to a level nearly 30 dB more stringent than what GSO networks require from each other. This disparity becomes even more striking when we consider that both thresholds are meant to define similar regulatory concepts—the point at which interference becomes unacceptable[.]”[42] A more equitable regime would extend to all satellite systems the “interference environments that GSO networks regularly accept from other GSO networks,” regardless of orbital altitude.[43]

B. Selecting Modern Protection Metrics

The available benchmarks point toward a modern interference regime built around two performance measures for ACM-enabled systems: a long-term limit based on degraded throughput and a short-term limit based on increased link unavailability. The United States recently adopted a 3% threshold for time-weighted average throughput degradation and a 0.1% absolute increase in link unavailability.[44]

The precise values remain open to debate. But the FCC’s choices deserve close attention because they reflect technical work across the world’s largest satellite market and align closely with the benchmarks discussed above.

1. Long-Term Degraded Throughput

The long-term EPFD limits offer an obvious starting point for reform because they lack a sound technical foundation. For links using ACM, degraded throughput provides a well-established measure of persistent interference. The remaining question is where to set the threshold for unreasonable degradation.

Across the leading benchmarks, the same answer emerges: 3%.

The Q- and V-band rules now incorporated into Article 22 use a 3% long-term throughput-degradation criterion. Technical studies within Working Party 4A concluded that this threshold would preserve adequate data rates and long-term system performance in those bands.[45]

The same measure appears in the Ku- and Ka-bands. In its NGSO-NGSO proceeding, the FCC adopted a 3% threshold after reviewing technical studies of modern systems and operating conditions.[46] Those studies included 123 dynamic interference simulations.[47] In 91% of all cases—and 100% of downlink cases—long-term degradation measured 3.12% or less.[48] The FCC ultimately selected a 3% limit.[49] Working Party 4A studies applying the GSO-GSO analogy also identify 3% as a reasonable long-term threshold.[50] That convergence supports the FCC’s choice and suggests that the same measure could work beyond U.S. operations.

2. Short-Term Link Unavailability

The appropriate short-term threshold commands less consensus. Resolution 770,[51] later incorporated into Article 22 of the ITU Radio Regulations,[52] uses a 3% relative increase in instances when a link cannot meet its minimum performance requirement.

That metric performs poorly for modern ACM-enabled systems. As the FCC explained in both its NGSO-NGSO proceeding[53] and its recent NGSO-GSO order,[54] relative measures produce distorted results and invite strategic manipulation. Modern satellite systems often maintain link availability above 99%. When a link already fails less than 1% of the time under natural conditions, even a trivial increase in downtime can produce a large percentage increase relative to that small baseline. The apparent change looks dramatic even when the practical effect is negligible. The FCC therefore adopted an absolute increase in link unavailability of 0.4% for NGSO-NGSO sharing.[55] It derived that figure from hundreds of simulated operating scenarios.[56]

Studies applying the GSO-GSO analogy reach a similar result.[57] Depending on the assumed received power level, simulations of a GSO interferer operating 6.5 degrees away have produced an absolute increase in link unavailability of 0.11% or less.[58] Because GSO systems generally do not require coordination at that separation, the resulting performance offers a practical benchmark for NGSO operations.

The FCC recently adopted an even more conservative threshold for NGSO-GSO sharing: a 0.1% absolute increase in link unavailability.[59] The agency explained that this value approximates “the maximum short-term interference a GSO satellite operator in Ku-band would expect from another GSO satellite operating 6.5 degrees away on the GSO arc, a distance at which no coordination between the GSO operators would be required under the ITU Radio Regulations.”[60] Applying the same threshold to NGSO systems would “maintain a [GSO] link availability near 99.9% in the presence of an operational NGSO system.”[61]

The requirement also applies to every link in a GSO network. The most sensitive link therefore determines the NGSO operator’s system parameters and mitigation measures. Most other links will experience substantially less than a 0.1% increase in unavailability.[62]

Recent ITU studies support that conclusion. One U.S. study modeled interference from a 30,000-satellite NGSO constellation across 230 GSO reference links operating over the United States.[63] None of the customer-terminal links reached the 0.1% threshold, and 90% experienced an increase of 0.00125% or less.[64] The effects on gateway links were smaller still. The median gateway experienced an increase in unavailability of 0.0000003%, while 90% experienced an increase of 0.0000178% or less.[65]

C. Protection Metrics for Non-ACM Systems

Some GSO systems still do not use ACM for their communications. This is especially common in the Ku-band, where point-to-multipoint video services, including broadcast-satellite service (BSS) systems, remain in operation. For those links, degraded throughput is the wrong measure because the system cannot lower its data rate to preserve the connection.

Here, the GSO-GSO analogy offers a better benchmark. A single NGSO system produces roughly the same interference as two GSO satellites operating 6.5 degrees away along the GSO arc when measured against an I/N threshold of -10.5 decibels for 80% of the time. ITU coordination rules generally treat interference between GSO satellites separated by more than 6 degrees as negligible and do not require formal coordination. The same logic should apply to NGSO systems. If an I/N threshold of -10.5 decibels produces effects comparable to those already accepted among GSO operators, NGSO networks should receive the same allowance. That threshold has already been tested in several settings, including studies involving international mobile telecommunications (IMT) networks in the Ka-band.[66] More recent real-world measurement campaigns and technical studies submitted to Working Party 4A provide further support,[67] as discussed below.

D. Implementing and Updating the New Framework

Any protection metric must be practical to implement. New operators need a reliable way to demonstrate compliance, and regulators need a credible basis for enforcement. That requires simulation parameters that reflect modern satellite operations as closely as possible.

A revised NGSO-GSO sharing framework should therefore correct the flawed assumptions identified in Section II. In particular, it should:

  • Update the GSO reference links to account for ACM.
  • Revise GSO receive-antenna patterns to reflect the equipment used in common operating scenarios.
  • Adopt simulation methods that capture how modern constellations operate, including dynamic traffic shifting that avoids worst-case geometries.

The framework should also include a process for periodically reviewing and, when warranted, updating these inputs as technologies, network architectures, and operating conditions evolve.

IV. Real-World Validation

The central flaw in the current EPFD regime is its reliance on theoretical assumptions that became obsolete decades ago—or never reflected operating systems in the first place. Reform should not repeat that mistake. Any new protection framework must account for modern conditions and demonstrate that its metrics work outside simulations and laboratory settings.

SpaceX has led several field-testing campaigns with GSO operators around the world. Taken together, these tests show that degraded throughput can serve as a workable interference metric for modern satellite systems. They also suggest that protection levels near those adopted by the FCC can expand NGSO spectrum use without materially degrading GSO service.

A. Romania

The first measurement campaign began in Romania in 2024 and examined interference to active FSS links using the Intelsat 39 satellite.[68] The tests measured desensitization caused by NGSO beams and converted those results into long-term throughput degradation under Recommendation S.2131.[69]

The campaign found that NGSO satellites could operate within 2 degrees of the GSO arc—an 89% reduction from the existing EPFD requirement—while using eight co-frequency spot beams, a 700% increase over current Nco restrictions. Even under those conditions, peak long-term spectral-efficiency loss reached only 0.7%, while the average loss was about 0.25%.[70]

B. Colombia

In Colombia, SpaceX worked with DirecTV Colombia to measure interference to a consumer dish receiving FSS signals from Intelsat 30.[71]

The tests found that an NGSO system operating with a 4-degree arc-avoidance angle—a 78% reduction from current EPFD requirements—and eight simultaneous co-frequency spot beams caused negligible long-term throughput degradation. The absolute increase in short-term link unavailability was about 0.05%.[72]

C. Nigeria

Field tests overseen by Nigeria’s telecommunications regulator examined NGSO interference to a consumer dish receiving BSS signals from Eutelsat 36.[73]

The results showed that a 7,500-satellite NGSO system could satisfy the -10.5 decibel long-term I/N threshold for non-ACM systems while using eight co-frequency spot beams and operating within 3 degrees of the GSO arc.[74] The same configuration also met a 0.1% short-term unavailability threshold.[75]

The study also considered aggregate interference. It found that a constellation with twice as many satellites operating about 2.75 degrees from the GSO arc would still remain below the NGSO-NGSO unavailability threshold and satisfy a -6 decibel long-term protection criterion.[76]

D. Botswana

Testing in Botswana similarly examined expanded NGSO operations near BSS links using Intelsat 20.[77]

The results showed that NGSO satellites operating within 4.5 degrees of the GSO arc and using eight co-frequency spot beams remained well below the -10.5 decibel long-term I/N threshold for non-ACM systems.[78] The resulting short-term link unavailability was about 0.0005%.[79]

E. Jordan

The Jordan campaign differed from the others by testing interference across four GSO satellites providing BSS coverage rather than a single GSO link.[80]

The results showed that a 7,500-satellite NGSO system could satisfy both a 0.1% short-term increase in link unavailability and the -10.5 decibel long-term I/N threshold for non-ACM systems.[81] It met those criteria under either of two configurations: a 3-degree arc-avoidance angle with six co-frequency spot beams, or a 4-degree angle with eight beams.[82]

V. The Economic and Social Gains from EPFD Reform

Modernizing the EPFD limits would correct decades of inefficient spectrum allocation. Real-world testing shows that NGSO systems can use substantially more capacity while preserving GSO service quality. Reform would therefore unlock valuable spectrum, lower the cost of satellite broadband, and reduce the infrastructure needed to compete.

Those gains would extend well beyond the satellite industry. Greater capacity and lower deployment costs would strengthen competition across satellite and terrestrial broadband markets. They would also make high-speed service more viable in rural and remote communities that conventional networks have struggled to reach.

Better connectivity, in turn, expands access to employment, education, health care, information, and civic life. EPFD reform is therefore not merely a technical adjustment. It is an opportunity to replace idle spectrum and regulatory scarcity with broader economic participation and social connection.

A. The Economic Case for EPFD Reform

The costs of the current EPFD regime extend beyond reduced NGSO coverage and capacity. By leaving usable spectrum idle and raising the infrastructure needed to compete, the rules suppress output, increase costs, and reinforce barriers to entry. Modernized limits would unlock substantial spectrum capacity while imposing little measurable harm on GSO systems.

1. Opportunity Costs

The full cost of the EPFD rules includes not only their direct constraints on NGSO operations, but also the opportunity costs—the benefits forgone under an inefficient spectrum regime.[83] Those costs are clearest in the large GSO-arc avoidance angles that NGSO systems must observe. If, as nearly every relevant technical study suggests, double-digit avoidance angles are unnecessary to protect GSO receivers, then the rules leave large portions of usable spectrum capacity dormant.

This problem is neither new nor unique to satellites. Early wireless regulation treated interference as a contaminant to eliminate[84] rather than an unavoidable feature of shared spectrum that can be managed.[85] That same instinct migrated from broadcasting and other terrestrial services to satellite communications.

When the ITU developed rules for co-frequency NGSO-GSO operations, it adopted an exceptionally cautious approach. The resulting protection masks sought to prevent even low-power NGSO signals from reaching GSO receivers.[86] That gave then-dominant GSO networks predictable protection, but it did so through blunt and technically inefficient limits that ignored the costs of foreclosing productive spectrum use.

The proper objective is not to eliminate interference, but to maximize joint efficiency. Nobel laureate Ronald Coase once made the point about pollution: “I am sure that pollution exists, I know that much; what I do not know is whether we have enough of it.”[87]

Radio interference presents the same basic tradeoff. It is a byproduct of socially valuable activity—in this case, satellite communications. Sound policy should not eliminate productive activity merely because it creates some interference. It should compare the costs of that interference with the benefits generated by greater spectrum use.[88]

Technical simulations and real-world measurement campaigns show that GSO-arc avoidance angles can fall by more than 80%, to as little as 3 to 4 degrees, without compromising reasonable protection. That change would open frequencies at geometries where NGSO transmissions are now barred.[89]

Economic studies estimate that this additional use could increase total spectrum capacity by 74% to 180%, depending on the band.[90] The average cost per unit of capacity could fall by 43% to 64%.[91] By expanding broadband access, increasing capacity, and lowering prices, reform could generate between $10 billion and $100 billion in economic gains.[92] The corresponding reduction in GSO spectral efficiency would remain below 2%.[93]

The Coasean trade is lopsided. Modernized limits would allow a rapidly growing NGSO sector to improve performance, lower prices, and generate billions of dollars in economic value. The resulting effects on GSO systems would remain largely de minimis.

2. Enhancing Competition

Lower launch and operating costs have fueled a second revolution in LEO, allowing NGSO systems to challenge established broadband providers and drive broader technological progress. EPFD reform could accelerate that competition.

Consider Nco. Under the modernized criteria examined in technical studies, the current limit of one active co-frequency satellite over a location could rise to as many as eight—a 700% increase in system capacity.[94] Other research finds that a hypothetical NGSO constellation requiring 462 satellites to provide global coverage under current EPFD rules could deliver the same performance with 360 satellites under updated limits, reducing required infrastructure by 28%.[95]

Those savings matter because satellite communications require enormous upfront investment and present formidable barriers to entry.[96] Reducing the number of satellites needed for global service lowers launch costs, eases the capital demands of large-scale manufacturing, and weakens the economies of scale that favor established operators.

Smaller constellations could then enter more readily and compete on their merits. They could target specialized markets, offer differentiated services, and compete through quality, features, and price rather than sheer fleet size. Satellite competition would become less of a contest in volume and more of a contest in value.

The gains would extend beyond competition among NGSO systems. Broadband markets are converging.[97]  A single constellation can offer fixed and mobile services to consumers and businesses while also providing backhaul between local networks and the broader internet.

As those functions converge, traditional market boundaries become less meaningful. New satellite systems can compete not only with other constellations, but also with GSO providers and terrestrial broadband networks. Stronger competition across technologies could generate billions of dollars in additional economic value and consumer benefits.

B. Closing the Digital Divide

Modernizing the EPFD rules would produce benefits far beyond existing satellite markets. Most notably, expanded NGSO deployment offers one of the most powerful tools for closing the digital divide.

For millions of Americans—and billions of people worldwide—who lack meaningful broadband choice, satellite service may be the most viable option. That is especially true in rural areas, where rugged terrain, sparse populations, and weak commercial returns make extensive terrestrial infrastructure prohibitively expensive. Satellite networks face no comparable last-mile construction problem. Once deployed, a constellation can serve remote and densely populated areas through much of the same infrastructure.

EPFD reform would make that access easier to deliver by removing outdated constraints that limit satellite coverage and capacity. In some areas, those constraints do not merely raise costs. They can prevent viable markets from emerging at all.

The United States’ long-running efforts to connect unserved communities illustrate the problem. Across several versions of the FCC’s high-cost subsidy programs, the government has struggled to persuade providers to accept available funding and build infrastructure. High deployment costs and low expected revenues often made participation uneconomical.[98]

Phase I of the Connect America Fund awarded only $115 million of the $300 million available.[99] Phase II awarded $1.49 billion of $2.15 billion.[100] The Tribal Mobility Fund distributed just $16.6 million of its $50 million allocation,[101] while the Rural Digital Opportunity Fund awarded $9.2 billion of the $16 billion initially set aside.[102] Provider demand repeatedly fell short of available subsidies because the economics of deployment remained forbidding.[103]

Satellite broadband has since reached a level of quality that makes it a credible alternative to terrestrial service and, in many places, the only practical broadband option. Modernizing NGSO-GSO sharing rules would remove technical barriers just as reusable launch systems, vertically integrated manufacturing, and falling input costs are reducing the physical and financial barriers to deployment.

Greater spectrum efficiency would allow operators to expand capacity, increase speeds, and improve reliability. The federal government has begun to recognize that shift by revising its policies for the $45 billion Broadband Equity, Access, and Deployment program to treat NGSO service as a potential source of high-speed connectivity in unserved areas.[104] The next step is to ensure that outdated interference rules do not prevent those systems from delivering the promised service. The United States’ domestic EPFD reforms move in that direction.

The welfare gains extend well beyond faster internet access. Broadband can connect workers in isolated communities to national labor markets through remote work. It can bring specialist care to areas with few medical providers through telehealth. It can expand the resources available through schools, libraries, and community institutions. On-demand instruction can make educational opportunities less dependent on geography, while online communities can give dispersed minority groups new avenues for association and expression.

Each of these gains reflects the same basic point: better connectivity creates opportunities for economic, intellectual, and social exchange that distance once foreclosed. Modernizing the NGSO-GSO sharing framework would help turn those possibilities into practical options for communities that terrestrial networks have struggled to reach.

VI. From Technical Consensus to International Reform

WRC-23 directed the ITU Radiocommunication Sector (ITU-R) to study the EPFD limits in Article 22 and report its findings to WRC-27.[105] Since then, technical studies and field tests have produced a substantial record showing that modernized protections can preserve GSO service while allowing far more efficient NGSO operations.

The United States has already acted on that evidence through domestic reform. The next task is to convert successful implementation into broader international support.[106]

That will require two things. First, the United States and other administrations should use real-world operations to demonstrate that the new framework works, then carry that evidence into WRC-27 rather than wait for another study cycle. Second, policymakers should reject narrow compromises that smooth out a few limits while leaving the EPFD regime’s obsolete assumptions and built-in hierarchy intact.

A. Prove the Model, Then Build Consensus

Procedure and politics now appear to be the main barriers to what should be a straightforward technical improvement. Critics argue that the United States has inverted the usual ITU process by testing reforms through domestic rules and real-world operations before securing international agreement.

There is little precedent for amending the Radio Regulations without a formal WRC agenda item. The closest analogue may be the late addition of global flight tracking to the WRC-15 agenda after the Malaysia Airlines disaster.[107] But that objection says more about the ITU’s process than about the merits of reform.

The ITU’s combination of preliminary studies, regional preparations, conference cycles, and implementation periods can stretch to eight years before a new rule takes effect. In a fast-moving satellite market, that timetable is less a deliberative process than a pause button.

Other areas of internet and space governance offer a more practical model: demonstrate that a system works, then formalize it.

Google followed that path with QUIC, a low-latency internet-transport protocol designed to combine the speed of the User Datagram Protocol (UDP) with reliability features traditionally associated with the slower Transmission Control Protocol (TCP).[108] Google deployed QUIC across Chrome, Search, and YouTube and studied its performance for years before submitting it to the Internet Engineering Task Force (IETF).[109]

By the time the IETF took up the proposal, QUIC’s technical viability had already been established. Commercial adoption followed quickly.[110] The protocol carried a majority of internet traffic before the IETF published its first formal Requests for Comments.[111]

International space governance has followed a similar pattern. Rather than wait for a comprehensive multilateral treaty, the United States and its partners have increasingly relied on nonbinding political commitments and state practice. The Artemis Accords, led by the National Aeronautics and Space Administration, now include 68 signatory states and seek to establish norms that may eventually harden into customary international law.[112]

These examples offer both a precedent and a playbook. Technical studies and operational experience since WRC-23 already provide substantial evidence for reform at WRC-27. Waiting for another study cycle and WRC-31 would add four years of delay without a clear technical justification.

Over the next year, the United States should encourage commercial operations under its new domestic framework. It should also press other administrations to adopt similar rules, building a record of successful implementation and a broader coalition before WRC-27 in Shanghai.

B. Reject Cosmetic Reform

As administrations debate the future of EPFD, incumbent GSO operators developing NGSO capabilities of their own have advanced a narrower proposal. It would modestly relax the most restrictive limits, particularly in the upper Ka-band, and bring greater consistency across frequency bands.[113] That is a worthwhile objective.

The problem lies in what the proposal leaves untouched. It would preserve the outdated reference links, propagation models, antenna assumptions, and improvised long-term protection criteria embedded in the current regime. It also would retain the mistaken premise that NGSO systems should receive secondary treatment in bands where they hold co-primary status.

The proposal would therefore adjust the margins while preserving the framework’s central defects. Satellite technology is moving quickly. Regulation should keep pace rather than remain tethered to assumptions made 25 years ago.

VII. Conclusion

The evidence now points in one direction. The current EPFD limits rest on obsolete design assumptions, an incomplete methodology, and political compromises that no longer reflect the satellite market. Since WRC-23, technical studies, domestic proceedings, and real-world measurement campaigns have reached the same conclusion: modern satellite systems can share spectrum far more efficiently without compromising GSO service.

The question is no longer whether reform is technically feasible. It is whether regulators will continue imposing unnecessary costs on one of the world’s fastest-growing communications technologies. The current regime leaves valuable spectrum capacity idle, raises NGSO deployment costs, weakens competition, and limits broadband access in communities that terrestrial networks struggle to reach.

Administrations should therefore pursue comprehensive reform of Article 22 rather than modest adjustments to legacy EPFD masks. Updated rules should use performance-based criteria tied to actual network effects, including degraded-throughput measures for ACM-enabled systems and validated I/N thresholds for non-ACM services. They should also update reference links, antenna patterns, and simulation methods—and establish a process for revisiting those inputs as technology evolves.

Just as important, future rules should reflect the co-primary status of NGSO and GSO systems. The goal should not be to preserve a hierarchy built for the satellite industry of 2000. It should be to define reasonable interference obligations that protect service while allowing all operators to make productive use of scarce spectrum.

Over the coming year, administrations should expand domestic implementation, continue coordinated field testing, and use that operational record to build consensus before WRC-27. The ITU need not choose between protecting incumbent networks and enabling the next generation of satellite broadband. The evidence shows it can do both. WRC-27 should replace precautionary guesswork with demonstrated performance—and turn Article 22 from a brake on innovation into a workable foundation for a multi-orbit future.

[1] See Int’l Telecomm. Union, Minutes of the Eleventh Plenary Meeting for WRC-23, Doc. 526-E, at 4–5 (Jan. 15, 2024).

[2] See Int’l Telecomm. Union, Radio Regulations No. 22.2. National regulators later incorporated these limits into domestic rules. See, e.g., 47 C.F.R. §§ 25.146, 25.289 (2025).

[3] Press Release, Euroconsult, Non-Geostationary Orbit Constellations Redefining the High Throughput Satellites Market Landscape (Apr. 25, 2024).

[4] Jonathan McDowell, Space Activities in 2025, Version 1.4, Jonathan’s Space Report (Feb. 4, 2026), https://planet4589.org/space/papers/space25.pdf.

[5] See, e.g., Mike Dano, 2025 Global Satellite Broadband Performance Report, Ookla (Feb. 4, 2026), https://www.ookla.com/articles/2025-global-satellite-broadband-performance-report; Sue Marek, Latency Is the Achilles’ Heel for HughesNet, Viasat, Ookla (July 15, 2025), https://www.ookla.com/articles/hughesnet-viasat-performance-2025.

[6] The simulations and assumptions underlying the equivalent power flux-density limits date to 1997–1999. See United States of America Contribution to Chairman’s Report, SkyBridge System Parameters Needed for Simulations of Interference Between NGSO and GSO Systems, Doc. 4-9-11/192-E (June 29, 1998).

[7] United States of America Contribution to Working Party 4A, Working Document Towards a Preliminary Draft New Report [Article 22 EPFD Limit Studies], Doc. 4A/84-E, at 1–2 (Apr. 19, 2024) [hereinafter U.S. WP 4A Proposal].

[8] Int’l Telecomm. Union Radiocommunication Bureau Contribution to Working Party 4A, GSO FSS/BSS Reference Links Used in ITU-R Studies in 1995–2000 to Derive the Existing RR Article 22 EPFD Limits, Doc. 4A/251-E (Oct. 9, 2024).

[9] For an overview of these shortcomings, see U.S. WP 4A Proposal, supra note 7, at 3–4.

[10] United States of America Contribution to Working Party 4A, Proposed Updates to Technical Studies in Response to WRC-23 Minutes on Article 22 EPFD Limits, Doc. 4A/789-E, at 13–14 (Oct. 17, 2025).

[11] United States of America Contribution to Working Party 4A, Working Document Containing Technical Work Relating to the GSO Earth Station Gain Patterns Used by Recommendation ITU-R S.1503, Doc. 4A/792-E, at 1–2 (Oct. 20, 2025).

[12] See Comments of Kuiper Systems LLC, SB Docket No. 25-157, at 6–7 (filed July 28, 2025).

[13] Id.; see also Reply Comments of Kuiper Systems LLC, SB Docket No. 25-157, at 9 (filed Aug. 27, 2025).

[14] Int’l Telecomm. Union Radiocommunication Sector, Resolution 76, Protection of GSO FSS and GSO BSS Networks from Maximum Equivalent Power Flux Density Produced by Multiple Non-GSO FSS Systems in Frequency Bands Where EPFD Limits Have Been Adopted (WRC-2000).

[15] See Claude E. Shannon, Communication in the Presence of Noise, 37 Proc. Inst. Radio Eng’rs 10, 16–18 (1949) (demonstrating how background noise affects signal strength).

[16] Int’l Telecomm. Union Radiocommunication Sector, Recommendation S.1323-0 (1997), superseded by Recommendation S.1323-2 (approved Sept. 2002).

[17] Chairman, Joint Task Group 4-9-11, Report of the Third Meeting of JTG 4-9-11, Doc. 4-9-11/367-E, at 16 (Feb. 5, 1999).

[18] See, e.g., Revising Spectrum Sharing Rules for Non-Geostationary Orbit, Fixed-Satellite Service Systems, Second Report and Order and Order on Reconsideration, FCC 24-117, IB Docket No. 21-456 (rel. Nov. 15, 2024) [hereinafter NGSO-NGSO Order].

[19] Id. ¶¶ 40–47.

[20] Id.

[21] Id.

[22] See Contribution of Tonga (Kingdom of) and Ecuador, Working Document Towards a Draft New Report on Radio Regulation Article 22 EPFD Limits Issues, Doc. 4A/971-E (June 21, 2023).

[23] Id. at 5 fig. 4.

[24] Although ITU participants know this compromise well, no formal record explains why the parties selected that figure. The record also fails to explain what real-world operations would constitute a “0.5” system or how to assess departures from that assumption.

[25] See Int’l Telecomm. Union Radiocommunication Sector, Recommendation S.1323-0, supra note 16.

[26] See United States of America, SkyBridge System Parameters Needed for Simulations, supra note 6.

[27] See U.S. WP 4A Proposal, supra note 7, at 9–10.

[28] Int’l Telecomm. Union Radiocommunication Sector, Report S.2462-0, Sharing Between 50/40 GHz Geostationary Networks and Non-Geostationary Systems (July 2019).

[29] Int’l Telecomm. Union Radiocommunication Sector, Resolution 769 (WRC-19); id., Resolution 770 (rev. WRC-23).

[30] Int’l Telecomm. Union Radiocommunication Sector, Recommendation S.2131-1, Method for the Determination of Performance Objectives for Satellite Hypothetical Reference Digital Paths Using Adaptive Coding and Modulation (Jan. 2022).

[31] The long-term protection criterion measures the annual reduction in time-weighted average spectral efficiency for generic GSO reference links using adaptive coding and modulation. Int’l Telecomm. Union, Radio Regulations, supra note 2, art. 22, Nos. 22.5L, 22.5M.

[32] Int’l Telecomm. Union, Radio Regulations, supra note 2, art. 22, No. 22.5L.

[33] NGSO-NGSO Order, supra note 18.

[34] See 47 C.F.R. § 25.261.

[35] NGSO-NGSO Order, supra note 18.

[36] Because baseline availability for systems using adaptive coding and modulation often exceeds 99%, even a slight change in link conditions can produce a large relative increase in unavailability—and, in turn, in the derived carrier-to-noise ratio. See NGSO-NGSO Order, supra note 18, ¶ 28; Letter from Jayson L. Cohen to Marlene H. Dortch, IB Docket No. 21-456, at 2, S-6–S-9 (July 25, 2024) [hereinafter Cohen Letter].

[37] NGSO-NGSO Order, supra note 18, ¶¶ 11–16.

[38] See Principles for Promoting Efficient Use of Spectrum and Opportunities for New Services, Policy Statement, FCC 23-27, ET Docket No. 23-122, ¶¶ 20–22, 33–35 (rel. Apr. 21, 2023) (recognizing that transmitting and receiving systems share responsibility for adapting to a changing RF environment and that operators should develop error-tolerant systems where technically feasible).

[39] Many modern GSO satellites nevertheless use steerable or configurable beams that largely replicate dynamic beamforming techniques.

[40] United States of America, Proposed Updates to Technical Studies, supra note 10, at 19–22; see also Contribution of Tonga (Kingdom of) and Ecuador, supra note 22.

[41] United States of America Contribution to Working Party 4A, supra note 10, at 15–18.

[42] Id. at 21.

[43] Id.

[44] See Modernizing Spectrum Sharing for Satellite Broadband, Report and Order, FCC 26-26, SB Docket No. 25-157 (rel. May 1, 2026) [hereinafter NGSO-GSO Order].

[45] Int’l Telecomm. Union Radiocommunication Sector, Resolution 770, supra note 29.

[46] NGSO-NGSO Order, supra note 18, ¶ 19.

[47] Id. ¶ 12.

[48] Cohen Letter, supra note 36, at 2, S-6–S-9.

[49] 47 C.F.R. § 25.261.

[50] United States of America, Proposed Updates to Technical Studies, supra note 10, at 15–18.

[51] Int’l Telecomm. Union Radiocommunication Sector, Resolution 770, supra note 29. WRC-23 made minor changes to the methodology for calculating interference. See Int’l Telecomm. Union Radiocommunication Sector, Recommendation S.2157-0 (WRC-23). For an assessment of those changes, see John Pahl, Resolution 770 After WRC-23, Transfinite Sys. (Apr. 26, 2024), https://www.transfinite.com/content/Resolution_770_After_WRC_23.

[52] Int’l Telecomm. Union, Radio Regulations, supra note 2, art. 22, No. 22.5L.

[53] NGSO-NGSO Order, supra note 18, ¶¶ 19–21.

[54] NGSO-GSO Order, supra note 44, ¶¶ 54–56.

[55] Id. ¶ 28.

[56] Cohen Letter, supra note 36, at 2, S-6–S-9.

[57] United States of America, Proposed Updates to Technical Studies, supra note 10, at 19–22.

[58] Id. at 20.

[59] NGSO-GSO Order, supra note 44, ¶ 54.

[60] Id. ¶ 55.

[61] Id. ¶ 56.

[62] Id. ¶ 55.

[63] See United States of America Contribution to Working Party 4A, Proposed Updates to Technical Studies in Response to WRC-23 Minutes on Article 22 EPFD Limits, Doc. 4A/1030-E, at 2–4 (Apr. 24, 2026).

[64] Id. at 4.

[65] Id.

[66] See Reply Liaison Statement from Working Party 4A to Task Group 5/1, WRC-19 Agenda Item 1.13 (IMT), Doc. TG 5/1-411 (WRC-19).

[67] See United States of America Contribution, Proposed Updates to Technical Studies, supra note 63, at 15–23.

[68] See SpaceX Contribution to Working Party 4A, Real-World Interference Measurements in Support of Studies on EPFD Limits, Doc. 4A/542-E (Apr. 23, 2025).

[69] Int’l Telecomm. Union Radiocommunication Sector, Recommendation S.2131-1, supra note 30.

[70] Id. at 11-13.

[71] See Interference Measurement Campaign on EPFD Limits in Colombia, 46th Meeting of Permanent Consultative Committee II, Inter-Am. Telecomm. Comm’n, Doc. No. 6309/25 (Aug. 21, 2025), attached to Reply Comments of Space Exploration Holdings, SB Docket No. 25-157 (Aug. 27, 2025). During the five-month campaign, researchers first measured the signal received by the GSO terminal under free-space conditions. They then measured the effects of NGSO test beams activated at 15-minute intervals under various configurations.

[72] Id.

[73] See Article 22 EPFD Studies, Info. Doc. 16 to APM27-2 (Aug. 8, 2025), attached to Reply Comments of Space Exploration Holdings, SB Docket No. 25-157 (Aug. 27, 2025).

[74] Id.

[75] Id.

[76] Id. at 9-11.

[77] See SpaceX Contribution to Working Party 4A, Interference Measurement Campaign on EPFD Limits in Botswana, Doc. 4A/624-E (Oct. 7, 2025).

[78] Id. at 13.

[79] Id.

[80] See SpaceX Contribution to Working Party 4A, Interference Measurement Campaign on EPFD Limits in Jordan, Doc. 4A/604-E (Oct. 3, 2025).

[81] Id.

[82] Id. at 12.

[83] Eric Fruits & Kristian Stout, Comments of the International Center for Law & Economics Regarding Modernizing Spectrum Sharing for Satellite Broadband, SB Docket No. 25-157, at 7–8 (July 28, 2025), https://laweconcenter.org/resources/icle-comments-re-modernizing-spectrum-sharing-for-satellite-broadband [hereinafter ICLE Comments].

[84] See Henry E. Smith, Property as the Law of Things, 125 Harv. L. Rev. 1691, 1711 (2012).

[85] See Philip J. Weiser & Dale N. Hatfield, Spectrum Policy Reform and the Next Frontier of Property Rights, 15 Geo. Mason L. Rev. 549, 558–62 (2008).

[86] U.S. WP 4A Proposal, supra note 7, at 1–2.

[87] Bruce Lehman attributed this statement to Ronald H. Coase during an April 2003 presentation at the Federal Reserve Bank of Atlanta’s Business Method Patents and Financial Services Conference. See Federal Reserve Bank of Atlanta, Business Method Patents and Financial Services Conference Program, http://www.frbatlanta.org/invoke.cfm?objectid=A6BDAC9C-384A-4C59-9096A079D324A9B7&method=display.

[88] See Ronald H. Coase, The Federal Communications Commission, 2 J.L. & Econ. 1, 28–29 (1959).

[89] See supra Section IV.

[90] See Harold Furchtgott-Roth, The Economic Benefits of Updating Regulations That Unnecessarily Limit Non-Geostationary Satellite Orbit Systems 7 (Furchtgott-Roth Econ. Enters. Aug. 11, 2023).

[91] Id. at 8 app. A.

[92] Id.

[93] Id. at 7 app. B.

[94] See supra Section IV.

[95] Furchtgott-Roth, supra note 90, at 8.

[96] See LEO Policy Working Group, Low Earth Orbit Satellites: Policies to Promote Spectrum Sharing, Foster Competition, and Close Digital Divides (Oct. 30, 2025).

[97] Id.

[98] Low expected revenue often reflected both a limited customer base and implicit rate regulation through soft price caps. See Daniel A. Lyons, Narrowing the Digital Divide: A Better Broadband Universal Service Program, 52 U.C. Davis L. Rev. 803, 834–38 (2018).

[99] See, e.g., John Pender et al., Three USDA Rural Broadband Programs: Areas and Populations Served 3–5 (U.S. Dep’t of Agric. Econ. Rsch. Serv. Oct. 2023), https://www.ers.usda.gov/media/9071/eib-258.pdf?v=78922.

[100] Id.

[101] See Lennard G. Kruger, Tribal Broadband: Status of Deployment and Federal Funding Programs 7–8 (Cong. Rsch. Serv., updated July 17, 2018), https://www.congress.gov/crs_external_products/R/PDF/R44416/R44416.10.pdf.

[102] See Rural Digital Opportunity Fund, Universal Serv. Admin. Co., https://www.usac.org/high-cost/funds/rural-digital-opportunity-fund (last visited Aug. 10, 2026).

[103] See Gregory L. Rosston & Scott Wallsten, Overhauling the Universal Service Fund: Aligning Policy with Economic Reality, Tech. Pol’y Inst. (Aug. 28, 2024), https://techpolicyinstitute.org/publications/broadband/overhauling-the-universal-service-fund-aligning-policy-with-economic-reality.

[104] U.S. Dep’t of Com., Broadband Equity, Access, and Deployment (BEAD) Program: BEAD Restructuring Policy Notice 8–11 (June 6, 2025), https://www.ntia.gov/sites/default/files/2025-06/bead-restructuring-policy-notice.pdf.

[105] Int’l Telecomm. Union, Minutes of the Eleventh Plenary Meeting for WRC-23, supra note 1, at 4–5.

[106] Modernizing Spectrum Sharing for Satellite Broadband, Notice of Proposed Rulemaking, FCC 25-23, SB Docket No. 25-157, ¶ 41 (rel. Apr. 29, 2025).

[107] See, e.g., Peter B. de Selding, In Busan, Regulators Put Global Flight Tracking on WRC-15 Agenda, SpaceNews (Oct. 31, 2014), https://spacenews.com/42385in-busan-regulators-put-global-flight-tracking-on-wrc-15-agenda.

[108] See Frederic Lardinois, Google Wants to Speed Up the Web with Its QUIC Protocol, TechCrunch (Apr. 18, 2015), https://techcrunch.com/2015/04/18/google-wants-to-speed-up-the-web-with-its-quic-protocol.

[109] See Mark Nottingham, What’s Happening with QUIC, Internet Eng’g Task Force (Oct. 29, 2018), https://www.ietf.org/blog/whats-happening-quic.

[110] See F5, QUIC Will Eat the Internet (Feb. 22, 2021), https://www.f5.com/company/blog/quic-will-eat-the-internet.

[111] See, e.g., Matt Joras & Yang Chi, How Facebook Is Bringing QUIC to Billions, Meta (Oct. 21, 2020), https://engineering.fb.com/2020/10/21/networking-traffic/how-facebook-is-bringing-quic-to-billions.

[112] See NASA, The Artemis Accords (last updated June 25, 2026), https://www.nasa.gov/artemis-accords.

[113] See, e.g., Letter from George V. John to Marlene Dortch, Modernizing Spectrum Sharing for Satellite Broadband, SB Docket No. 25-157 (filed Mar. 2, 2026).

ICLE Issue Brief

Clouded Judgment: AWS, Azure, and the DMA’s Gatekeeper Test

Executive Summary On June 25, 2026, the European Commission reached the preliminary view that Amazon Web Services (AWS) and Microsoft Azure should be designated as . . .

Executive Summary

On June 25, 2026, the European Commission reached the preliminary view that Amazon Web Services (AWS) and Microsoft Azure should be designated as gatekeepers under the Digital Markets Act (DMA). The decisions would be the first to rely entirely on the DMA’s qualitative criteria because cloud computing satisfies neither of the law’s user-number thresholds. The Commission must prove that each undertaking is an “important gateway” with an “entrenched and durable position.”

This issue brief argues that the Commission’s preliminary position conflates gatekeeping with size. Cloud services are eligible for designation, but Article 3(8) requires the Commission to establish each statutory condition independently and without a presumption.

Evidence of scale, investment, or economic importance may show that AWS and Azure matter. They will not show that they intermediate between business users and end users, which is the core of the gateway inquiry. Nor does the current record establish entrenchment. Quality-adjusted prices have fallen, market shares have shifted, multihoming is widespread, switching costs have declined, and artificial intelligence (AI) demand has encouraged entry.

The Commission also relies on the firms’ combined position even though each service must qualify individually, and it has not explained why Google Cloud falls outside the inquiry. Any prediction that AI, data gravity, or sovereign-cloud requirements will entrench AWS and Azure must satisfy the General Court’s demand in Meta Platforms for specific, contemporaneous reasoning.

Proportionality presents a final problem. The United Kingdom examined the same firms on a fuller record and chose voluntary commitments. The European Union has also enacted a purpose-built switching regime in the Data Act, while the Commission is still studying whether the DMA’s obligations fit cloud services.

The proposed designations will show whether “gatekeeper” remains a distinct legal category or becomes a synonym for “big.”

I. Introduction: Cloud Gatekeepers Without the Numbers

On June 25, 2026, the European Commission reached the preliminary view that Amazon Web Services (AWS) and Microsoft Azure should be designated as gatekeepers under the Digital Markets Act (DMA).[1] The announcement followed market investigations opened in November 2025[2] and started a demanding timetable. The companies are expected to submit written observations in the autumn, the Commission must issue final decisions by November 2026, and, if it confirms the designations, both providers will have six months to bring their cloud services into compliance with the DMA.[3]

The proposed designations rely on an expansive interpretation of the DMA’s qualitative criteria. If upheld, that interpretation would broaden the regulation’s material scope substantially, as some early commentary anticipated and encouraged. Section II.C surveys that literature.

Article 3(8) allows the Commission, after a market investigation, to designate a company that does not satisfy the DMA’s quantitative thresholds. The Commission has used that authority once before. In April 2024, it designated Apple’s iPadOS as a core platform service (CPS), even though the operating system fell below the end-user threshold.[4]

The iPadOS designation remained closely tied to the statutory presumptions. Apple exceeded the business-user threshold by roughly elevenfold, its end-user numbers approached the statutory threshold and were expected to rise, and iPadOS formed part of a consumer-facing system already covered by the DMA.[5]

The proposed cloud designations differ in kind. AWS and Azure satisfy neither user-number threshold because cloud computing is overwhelmingly a business-to-business service. Its ultimate users are largely indirect and do not resemble the end users contemplated by the statutory presumption.[6]

For the first time, the DMA’s qualitative criteria must support a designation without assistance from the numerical thresholds. The Commission must establish that each service has a “significant impact on the internal market,” serves as an “important gateway,” and holds an “entrenched and durable position.” And it must do so both without a numerical presumption and without a consumer-facing side of the market that could support one.[7]

Until now, the Commission has made most designations through the quantitative presumptions in Article 3(2). Even when it relied on qualitative criteria, as with iPadOS, those criteria remained closely connected to the numerical thresholds. The AWS and Azure investigations therefore test whether gatekeeper status identifies firms that control genuine competitive bottlenecks or merely large firms operating in contested markets.

On the public record, the Commission cannot sustain its preliminary position without conflating gatekeeping with size. This issue brief advances five claims.

First, Article 3(1)(b) contains two distinct requirements. A service must be a gateway, and that gateway must be important. The two-sided structure of the Article 3(2)(b) presumption ordinarily supports that inference by measuring both business users and end users. That proxy fails for business-to-business infrastructure services because both sides of the statutory test reflect the same mismatch between the service and the threshold. Evidence of scale or economic importance cannot establish the separate proposition that a service controls access between two groups of users.

Second, Article 3(1)(c)’s requirement that a firm hold an “entrenched and durable position” amounts to a test of market contestability. A qualitative designation under Article 3(8) must therefore rest on evidence showing that rivals cannot discipline the firm or displace its position.

Third, the cloud investigations rely on a duopoly framing that is difficult to reconcile with the DMA’s requirement that each service qualify individually. The Commission has also offered no adequate explanation for excluding Google Cloud. Because Article 3(8) gives the Commission discretion, these distinctions expose the decisions to an equal-treatment challenge that designation through a statutory presumption would largely avoid.

Fourth, any forward-looking finding of entrenchment based on AI or “data gravity,” meaning the tendency of large datasets to attract related applications and services, must satisfy the reasoning standard the General Court applied when it annulled the Facebook Marketplace designation. The Commission must connect its prediction to evidence in the decision. A bare assertion that AI will entrench current market positions cannot meet that standard.

Fifth, the Commission’s approach differs sharply from that of the United Kingdom’s Competition and Markets Authority (CMA). The CMA examined the same two firms on a fuller evidentiary record and concluded that voluntary commitments offered a more proportionate response than designation under the United Kingdom’s comparable ex ante regime.

That comparison reinforces the proportionality concern. The European Union has already adopted a purpose-built cloud-switching regime through the Data Act. The Commission is also conducting a parallel inquiry into whether the DMA’s existing obligations fit cloud services at all. Those proceedings suggest that the Commission is pursuing designation before establishing that the resulting obligations address the conduct identified in the investigation.

II. Gatekeeper Designation and the Cloud Problem

This section develops the legal and economic framework for assessing the proposed cloud designations. Section II.A examines Article 3’s three cumulative conditions, the quantitative presumptions that ordinarily establish them, and the Commission’s heavier evidentiary burden when it proceeds under Article 3(8). Section II.B explains the economic theory behind gatekeeper status and the distinction between firms that are merely large and services that control genuine gateways. It also shows how the Commission’s designation practice has begun to enforce that distinction. Section II.C turns to cloud computing. Although the DMA expressly makes cloud services eligible for designation, their business-to-business structure prevents them from satisfying the user thresholds and fits uneasily with the regulation’s model of two-sided platform intermediation. That mismatch does not foreclose designation, but it requires the Commission to prove through evidence that AWS and Azure function as competitive bottlenecks rather than rely on their scale or economic importance.

A. The DMA’s Designation Framework

Article 3(1) of the DMA makes gatekeeper designation contingent on three cumulative conditions. The undertaking must have “a significant impact on the internal market,” provide a CPS that serves as “an important gateway for business users to reach end users,” and hold “an entrenched and durable position” or be likely to attain one in the near future.[8]

Article 3(2) establishes rebuttable presumptions for each condition. Financial thresholds and operations in at least three member states create a presumption of significant market impact. At least 45 million monthly active end users and 10,000 yearly active business users in the European Union create a presumption that the service is an important gateway. Meeting those user thresholds in each of the previous three financial years creates a presumption of an entrenched and durable position.[9]

Two corrective mechanisms complete the framework. Article 3(5) allows a firm that meets the thresholds to rebut the presumptions with arguments that “manifestly call into question” its designation. The General Court has interpreted that standard strictly, requiring a “high degree of plausibility.”[10] Article 3(8), by contrast, allows the European Commission to designate a firm that does not meet the thresholds after conducting a market investigation under Article 17.[11]

As Friso Bostoen and Giorgio Monti explain, Articles 3(5) and 3(8) form an error-correction pair. Article 3(5) addresses false positives produced by the quantitative presumptions, while Article 3(8) addresses false negatives.[12] Under Article 3(2), designation is mandatory once the thresholds are met unless the firm rebuts the presumptions. Under Article 3(8), no presumption applies. The Commission must affirmatively establish all three statutory conditions based on the evidence.[13]

Because the conditions are cumulative, the Commission must establish each one separately. Evidence relevant to one condition cannot simply be reused to establish another. For example, evidence of turnover, market capitalization, or investment may establish that a company has a significant impact on the internal market. But those measures do not, without more, show that its service acts as an important gateway or that its position is entrenched and durable.[14]

B. The Economic Logic of Gatekeeper Status

The DMA’s designation criteria reflect a specific economic diagnosis. The expert reports that shaped the regulation offered a common account of why some digital markets resist ordinary competitive pressure. Extreme economies of scale, strong network effects, and data-driven feedback loops can cause a platform market to tip toward a single intermediary. Once that occurs, even more innovative rivals may struggle to challenge the incumbent.[15]

The DMA’s gateway concept translates that diagnosis into law. In theory, the regulation targets a particular market structure rather than size alone. It focuses on platforms that mediate between distinct user groups and may become durable bottlenecks when tipping dynamics reinforce an early lead.[16]

Under this account, the Article 3(2)(b) presumptions are not arbitrary. The dual user thresholds serve as a proxy for two-sided intermediation. Their significance lies less in the absolute size of either group than in each group’s reliance on the platform to reach the other.[17]

Several commentators warned before the DMA’s enactment that these proxies could sweep more broadly than the economic diagnosis justified. Damien Geradin, a prominent supporter of the DMA, cautioned that the proposed criteria could capture firms that were large but did not control genuine gateways. He urged lawmakers to define the regulation’s target more clearly.[18] Pinar Akman likewise argued that the designation framework poorly approximated the competitive concern it was meant to address.[19]

Pablo Ibáñez Colomo focused on the institutional consequences of separating designation from market-power analysis.[20] Other scholars examined the resulting tension between the DMA and Article 102 of the Treaty on the Functioning of the European Union (TFEU).[21] Although the two regimes formally protect different legal interests, they inevitably confront overlapping economic questions.

Defenders responded that avoiding case-by-case effects analysis was central to the DMA’s design. In their view, Article 102 enforcement had proved too slow and uncertain for digital markets, and bright-line proxies offered the administrability that traditional antitrust lacked.[22]

Three years of practice have lent support to both positions. The Commission has designated seven gatekeepers and several dozen CPSs, almost all through the Article 3(2) presumptions.[23] Yet its decisions also show that Article 3(1)(b) imposes an independent requirement connected to an undertaking’s gateway status.

The Commission declined to designate X’s online social-networking service even though the company met the turnover thresholds because the service was not an important gateway.[24] It also accepted rebuttals for Gmail and Outlook.com despite user numbers above the statutory thresholds.[25] The same pattern appears in several other non-designations[26] and successful rebuttals.[27]

These decisions confirm that a service can be large without serving as an important gateway. They provide the baseline against which the proposed cloud designations must be assessed, as Section III.A explains.

C. Cloud Computing’s Uneasy Fit

Cloud computing has generated a substantial and fast-growing literature. Regulators have examined the sector through market studies and investigations by the Office of Communications (Ofcom) and the CMA in the United Kingdom; the Autorité de la concurrence in France; the Authority for Consumers and Markets (ACM) in the Netherlands; the Japan Fair Trade Commission (JFTC); and the U.S. Federal Trade Commission (FTC).[28] The Organisation for Economic Co-operation and Development (OECD) has also synthesized much of this work. Concurrences devoted a multipart On-Topic series to cloud competition in 2025, covering issues that ranged from interoperability mandates to AI partnerships.[29]

The economic literature has focused on customer lock-in, economies of scale, and the relationship between the Data Act and the DMA. A 2024 report by the Centre on Regulation in Europe (CERRE) examined each of these issues and urged the European Commission to apply proportionality before designating cloud services, given their differences from other CPSs.[30] Doctrinal scholarship has questioned whether the European Union’s digital rules fit cloud computing at all.[31]

The policy literature divides over the proper response. Some authors argue that the Data Act provides the purpose-built instrument for improving cloud contestability and should be given time to operate before the Commission invokes the DMA.[32] Others contend that qualitative designation is especially well suited to an industry organized around integrated groups of complementary services.[33] A separate public-utility strand would regulate cloud providers more extensively than the DMA does.[34] At the time of writing, no full-length analysis has examined the proposed AWS and Azure designations themselves.[35] This paper fills that gap by testing the proposed designations against the framework developed in the designation literature.

One possible argument is that cloud computing falls outside the DMA because an infrastructure service that does not interact directly with consumers cannot serve as an “important gateway for business users to reach end users.” Whatever force that argument may have as an economic description, the statutory text makes it difficult to sustain as a legal claim.

Article 2(2)(i) expressly lists cloud computing as a CPS.[36] Recital 14 explains that the listed services have “the capacity to affect a large number of end users and business users, which entails the risk of unfair business practices,” and should therefore fall within the regulation’s scope.[37] The recital refers to the capacity to “affect” end users, rather than requiring providers to have a direct relationship with them. That wording indicates that the legislature contemplated services that reach end users indirectly through the businesses built on top of them. Reading the recital otherwise would make the qualitative gateway criterion in Article 3(1)(b) largely redundant for cloud services.

Some scholars nevertheless argue that the DMA, like the Digital Services Act and perhaps the Data Act, was drafted around consumer-facing platforms and fits the technical and commercial features of cloud computing poorly. Others reach the opposite conclusion.[38] Reconstructing the Commission’s impact assessment, they argue that lawmakers included cloud because of its role within integrated groups of complementary services. On that account, qualitative designation is especially appropriate for a business-to-business industry whose competitive significance the user thresholds may understate.[39]

We take a middle position. Cloud’s inclusion in Article 2 settles its eligibility for designation, but eligibility does not establish that AWS or Azure satisfies the substantive criteria. The feature that justified including cloud—the capacity to affect end users without directly intermediating with them—also demands closer scrutiny. Cloud services do not operate like traditional multisided, consumer-facing platforms. The Commission must therefore show that the remaining evidence identifies a competitive bottleneck rather than merely a large and economically important firm.

A finding of a genuine bottleneck would accord with the DMA’s stated goal of promoting contestability. A finding based primarily on size would support the criticism that the regulation singles out large digital companies without establishing gatekeeper power.

The point at which the quantitative presumptions fail is instructive. Amazon and Microsoft satisfy the financial thresholds in Article 3(2)(a) at the undertaking level. That is undisputed. Their cloud services fall short under Article 3(2)(b), which measures active business users and end users. That user-number test is the regulation’s principal proxy for intermediation rather than size.[40]

The missing presumption is therefore the one directed most closely at the gateway requirement. Under Article 3(8), the Commission must replace that presumption with evidence, and it bears the burden of proving the statutory condition.

The first condition, significant impact on the internal market, is not seriously contested for AWS or Azure. The dispute concerns the remaining conditions. The Commission must prove that each service is an “important gateway” and holds an “entrenched and durable position.” The following sections address those requirements in turn.

III. Testing the Cloud Gatekeeper Case

With eligibility established and the burden of proof allocated, this section tests the European Commission’s preliminary position against the substantive conditions in Article 3(8). Section III.A argues that an “important gateway” must both intermediate between business users and end users and hold sufficient importance. Evidence that cloud services are large, critical inputs addresses only the latter requirement. Section III.B treats an “entrenched and durable position” as a question of market contestability. Falling quality-adjusted prices, shifting market shares, widespread multihoming, lower switching costs, and AI-driven entry weigh against entrenchment.

Section III.C examines the Commission’s reliance on the combined position of AWS and Microsoft Azure, even though the DMA requires each service to qualify individually. It also considers whether the unexplained exclusion of Google Cloud can survive equal treatment review under Article 3(8)’s discretionary framework. Section III.D addresses the possible claim that AI workloads, data gravity, and sovereign-cloud requirements will entrench AWS and Azure in the near future. Any such prediction must satisfy the General Court’s demand for specific, contemporaneous evidence rather than assumptions about technological change or European industrial policy goals.

A. Gateway Power Requires Intermediation

The DMA’s gateway concept rests on intermediation. A CPS sits between business users and the end users they seek to reach. As the General Court held in ByteDance:

[I]n order to consider that business users of a CPS [core platform service] “depend” on it in order to reach their end users, it is not necessary for that CPS to be the only channel through which those undertakings can reach those users. It is sufficient for it to be an important channel for that purpose, which those business users can access only if they have an account on that CPS.[41]

The economics of two-sided platforms support this conception. Intermediation power arises when a platform coordinates distinct user groups whose demands depend on one another. The platform’s position on one side then affects which users businesses can reach on the other side and at what price. In economic terms, the users on each side cannot reallocate the platform’s pricing decisions among themselves.[42]

Taken alone, the first and third conditions in Article 3(1) describe nothing distinctively digital or specific to gatekeeping. Many firms have a significant economic impact and hold long-established positions. The second condition distinguishes a gatekeeper from a company that is merely large and durable. Article 3(1)(b) targets services that control a bottleneck and determine how business users reach end users. Without that requirement, the DMA would impose special obligations on companies largely because they have remained big for three consecutive years.

This conception readily fits marketplaces, social networks, and app stores.[43] It fits raw computing and storage services poorly. A business that hosts an application on AWS does not reach its customers “through” AWS in any way those customers experience. Cloud computing is an input into the business’s product, not a channel to its audience in the sense that a marketplace or app store is.

The European Commission’s preliminary position blurs that distinction. Its announcement describes AWS and Microsoft Azure as “an important gateway between businesses and their customers.” It also observes that more than half of European Union businesses rely on cloud services, which it calls “a prerequisite for AI.”[44]

Reliance does not establish intermediation. Electricity, telecommunications transit, commercial real estate, and payroll software are inputs on which many businesses depend. None necessarily stands between a business and its customers in the sense contemplated by the gateway condition. Treating criticality as sufficient would deprive that condition of independent force. Every essential business-to-business input supplied on a large scale could qualify, turning the DMA into a statute governing important inputs and economic dependence throughout the economy rather than important gateways.[45]

Article 3(1)(b) contains two distinct requirements. The service must be a gateway, and the gateway must be important. The presumption that ordinarily establishes this condition, Article 3(2)(b)’s thresholds of 45 million monthly active end users and 10,000 yearly active business users, performs both functions.

The magnitude of those figures supports the importance inference. A service used on that scale clearly matters to the internal market. Requiring large numbers of both business users and end users supports the separate gateway inference because it identifies a service connecting two user groups.

For cloud services, both parts of the proxy fail for the same reason. People who use an application generally have no relationship with the infrastructure on which it runs. They therefore do not count as the cloud provider’s end users under Article 3(2)(b). Cloud infrastructure also lacks a second side in the conventional platform sense and does not exhibit the same cross-group network effects. The structural inference that many users on both sides depend on the service to reach one another cannot be drawn.

That mismatch required the Commission to proceed under Article 3(8), the proper legal route for services that do not meet the thresholds. But Article 3(8) requires the Commission to prove importance and gateway status separately, without a presumption.

Evidence of revenue, capacity, investment, or widespread use as an input may establish importance. It does not, however, establish that the service intermediates between business users and end users. A decision that relies only on measures of scale proves one half of Article 3(1)(b) while omitting the half that distinguishes a gatekeeper from a company that is merely large, significant, or important.

The Commission’s prior decisions apply this distinction. It declined to designate X even though the undertaking met the DMA’s turnover thresholds because the service was not an important gateway.[46] It accepted that Gmail and Outlook.com were not gateways despite their millions of business users and end users.[47] It also declined to designate iMessage after finding that the service was not important enough, even though it met the quantitative thresholds.[48]

The Commission’s only previous designation under Article 3(8), involving iPadOS, remained closely tied to the quantitative framework. Apple exceeded the business-user threshold by roughly elevenfold. Its end-user numbers approached the statutory threshold and were expected to rise. The designation also filled a gap within a consumer-facing group of complementary services whose related services were already designated.[49]

The iPadOS decision was therefore a gap-filling designation. Designating AWS and Azure would create a new category. It would mark the first designation in which neither side of the statutory intermediation proxy exists even approximately.

That prospect creates a dilemma. The Commission may be applying a more permissive gateway standard to infrastructure services than it applied to X, Gmail, Outlook.com, and iMessage, which would create the equal-treatment problem addressed in Section III.C. Alternatively, it may be treating “gateway” as another word for “big.”

A narrower interpretation can preserve the gateway condition while keeping cloud services eligible for designation. Under that interpretation, “gateway” describes the market structure that motivated the DMA. A platform intermediates between distinct user groups in a market where network effects, data-driven feedback loops, and extreme economies of scale can cause tipping and entrenchment.[50] That was the diagnosis developed in the Crémer report and Furman Review and reflected in the regulation’s design.

Cloud designation remains possible under this interpretation, but the Commission must show that the market’s structure makes tipping and entrenchment likely. That inquiry leads to Article 3(1)(c)’s requirement of an “entrenched and durable position,” where the evidence can be examined directly.

B. Entrenchment Requires Limited Contestability

Article 3(2)(c) presumes that an undertaking enjoys an entrenched and durable position where the user thresholds in Article 3(2)(b) were met in each of the previous three financial years. The presumption affects the undertaking, but its trigger is a particular service. Thus, Article 3(2)(b) is satisfied only where the undertaking provides a CPS that itself clears the user thresholds.

Entrenchment is therefore not a free-floating attribute that an undertaking carries into every service it ever launches. The General Court confirmed as much in Meta, holding that where some of an undertaking’s CPSs meet the thresholds and others do not, the Commission may open a market investigation under Article 17(1) in order to assess whether those services meet the requirements of Article 3(1), entrenchment included. Under the DMA’s own structure, entrenchment means that gateway status persists over time. When the user thresholds do not apply, the European Commission must fill that evidentiary gap with proof that the market itself is difficult to contest.

The case law points in the same direction. The DMA deliberately dispenses with Article 102 TFEU’s dominance test. The General Court has confirmed that designation requires neither a relevant-market definition nor a finding of market power.[51] Yet the two inquiries address related economic conditions.[52]

Dominance asks whether rivals can discipline a firm that raises prices, restricts output, or allows quality and innovation to decline. The General Court defines an “entrenched and durable” position in similar terms. It refers to circumstances in which “the contestability of that position is limited” and examines “the stability of that position over time.”[53]

In economics, a market is contestable when entry or expansion by rivals constrains an incumbent’s conduct, regardless of current concentration.[54] The General Court’s formulation therefore makes Article 3(1)(c) an economic inquiry. Without the quantitative presumptions, the Commission must establish actual impediments to contestability.

This point has received too little attention in the designation debate. As Chad Syverson explains, concentration “is an outcome, not an immutable core determinant of how competitive an industry or market is.” Indeed, on that score, “we cannot even generally know which way the barometer is oriented.”[55]

The same principle applies to the DMA’s qualitative test. Outside the statutory presumptions, an entrenched and durable position cannot be inferred solely from a snapshot of market structure. It results from limited contestability. The relevant question is whether competitive pressure can discipline incumbents over time.

Market shares alone therefore cannot establish entrenchment, particularly in an industry where rivals are actively gaining and losing business. The cloud industry displays vigorous competition along at least five dimensions.

First, market shares continue to move. AWS’ worldwide share of cloud-infrastructure services declined from roughly 32% in 2021 to about 28% in early 2026. Microsoft’s share rose to roughly 21%, and Google’s reached 14%. Oracle and a growing group of AI-focused “neoclouds,” which provide specialized computing capacity for AI workloads, have also gained ground. Five neocloud providers now rank among the top 30, and the segment accounts for about 5% of a market whose revenue increased 35% year over year to $129 billion in the first quarter of 2026.[56] Growth at that rate attracts entry, and the entry is occurring.

Second, quality-adjusted prices have fallen sharply, particularly as competition intensified. David Byrne, Carol Corrado, and Daniel Sichel’s hedonic price indexes, which account for changes in service quality, show rapid declines in the prices of AWS computing, database, and storage services between 2009 and 2016. Those declines accelerated to double-digit annual rates after 2014, when Microsoft and Google had reached sufficient scale to offer competitive prices.[57] Industry price histories show a similar pattern in storage, where list prices fell by more than 80% during the early 2010s.[58]

It is true that nominal prices for some services have changed little since the mid-2010s. That fact does not erase the earlier evidence of competitive discipline. AWS accelerated its price reductions when rivals attained scale. Quality improvements, expanding free-service tiers, and steep negotiated discounts also weaken any inference drawn from stable list prices.

Third, the economics of switching costs cut against designation. The standard literature predicts that firms in markets with switching costs compete aggressively ex ante for customers who may later become partly locked in. This “bargains-then-ripoffs” dynamic can dissipate ex post rents through ex ante discounts and concessions.[59]

Cloud credits and committed-spend discounts may reflect that competition for customers. Their prevalence suggests that providers must compete for business before customers become attached to a particular service. The CMA and Ofcom likewise documented intense competition for new customers and workloads.[60]

Fourth, the practices most often identified as lock-in mechanisms have weakened. In 2024, Google, AWS, and Microsoft eliminated or sharply reduced data-egress fees worldwide for customers leaving their platforms.[61] Data-egress fees are charges for transferring data out of a provider’s cloud.

The changes may have reflected regulation, including the EU’s Data Act,[62] although their worldwide scope makes that explanation less convincing. Competition may also have played a role. Either way, the friction most commonly cited as a cloud lock-in mechanism is receding. Providers that reduce the switching costs said to trap customers offer evidence that competitive pressure still constrains them.

Fifth, multihoming is widespread. Flexera’s 2026 survey of 753 cloud decision-makers found that 83% of respondents run some or significant workloads on AWS and 79% do so on Azure, with both providers used in some capacity by 88%. Among enterprises, AWS leads active workloads at 84% and Azure follows at 82%. Usage shares of that magnitude cannot obtain unless most organisations run both.[63] The CMA and Ofcom correctly caution that “multicloud” often means placing different workloads on different clouds rather than moving the same workload freely among providers.[64] Migrating an established workload can remain costly.

That caveat does not resolve the contestability inquiry. Competition often operates at the margin. New and expanding workloads, especially AI workloads, are awarded provider by provider. Competition for those workloads can constrain prices and terms for existing customers.

Using several providers also reduces the cost of returning to a provider and preserves a credible alternative during contract renewals. The relevant question is whether incumbents could worsen price or quality without losing marginal workloads. Moving market shares, falling quality-adjusted prices, and aggressive customer-acquisition discounts suggest that they could not.

The strongest counterargument comes from the CMA’s institutional findings. After a full market investigation, the CMA concluded that AWS and Microsoft each possessed significant unilateral market power in U.K. cloud-infrastructure services. It identified high barriers to entry and adverse effects on competition associated with egress fees, technical switching barriers, committed-spend discounts, and Microsoft’s software-licensing practices.[65] Ofcom’s referral study reached similar conclusions.[66]

Those findings deserve serious consideration, but they do not establish that AWS and Azure are entrenched and durable gateways under the DMA.

First, market power in a differentiated oligopoly does not necessarily establish an entrenched and durable gateway. The CMA’s record also documents price competition and active rivalry for new business. Its inquiry group therefore considered calibrated conduct remedies rather than structural intervention.

Second, the CMA’s eventual response is instructive. As Section IV.A explains, the authority that made the market-power finding ultimately concluded that voluntary conduct commitments were proportionate.

Third, the best-supported concern in the record involves Microsoft’s licensing terms. Those terms make it materially more expensive to run Windows Server and SQL Server on rival clouds than on Azure. This is firm-specific conduct involving an adjacent software market.[67]

Such conduct may warrant enforcement. Google withdrew its Article 102 complaint concerning those practices in November 2025, after the Commission opened the cloud investigations,[68] and the CMA has opened a separate investigation into Microsoft’s business-software offerings. But Microsoft’s licensing practices cannot support an infrastructure-wide designation of cloud computing as a CPS, and they provide no basis for designating AWS.

Article 3(8) does not allow the Commission to avoid this evidence. Once the quantitative thresholds fall away, entrenchment must be established for the services under investigation on their own facts, which means proving limited contestability directly. The available record describes a market in which prices fall, market shares move, new providers capture growing demand, and incumbents reduce switching costs to retain customers.

C. Individual Designation and Equal Treatment

The European Commission also faces an aggregation problem. The cloud statistic cited most often is the combined market share of AWS and Microsoft Azure, which exceeds 50% in the European Union. But the DMA applies to individual undertakings and their services. Designation attaches to each CPS separately: Article 3(9) directs the Commission to list only those services that “individually” are an important gateway, and the General Court confirmed in Meta that the Commission must appraise each undertaking and each CPS on its own facts, without reference to other undertakings or services.[69]

The DMA also contains no counterpart to collective dominance under Article 102 TFEU. A combined market share therefore says little about whether AWS or Azure individually holds an entrenched position. It joins the shares of two firms that compete intensely with each other, while Google Cloud and Oracle add further competitive pressure.

This problem also complicates the Commission’s decision to investigate AWS and Azure while excluding Google Cloud.[70] The Commission must identify an objective distinction between Amazon and Microsoft, on one hand, and Google, on the other.

If the distinction rests on user numbers, the designation inquiry returns to size. If it rests on a line between Google’s roughly 14% worldwide share and Microsoft’s roughly 21% worldwide share, the DMA provides no such threshold. Amazon and Microsoft can therefore argue that the Commission has offered no legitimate basis for treating Google differently that does not reduce to the kind of user counting that Article 3(8) was meant to replace when Article 3(2)(b)’s presumptions did not apply.

The General Court rejected an equal-treatment claim in ByteDance. When a service meets the statutory thresholds, designation is mandatory, and one undertaking cannot challenge its own designation by pointing to the Commission’s treatment of another.[71] That reasoning fits Article 3(2), where the thresholds dictate the result. It does not, however, transfer easily to Article 3(8).

Subthreshold designation under Article 3(8) depends on Commission discretion. The Commission chooses which services to investigate and which to designate. Equal-treatment principles carry particular force when an institution exercises that kind of discretion. Comparable situations may not be treated differently unless an objective justification supports the distinction.[72]

Article 3(8) therefore reopens the issue that ByteDance closed. Because subthreshold designation results from an exercise of discretion rather than the automatic application of numerical thresholds, the Commission’s choice of whom to designate—and whom to exclude—must withstand equal-treatment review.

The point is not that Google Cloud should also be designated. The exclusion instead reveals the criteria driving the Commission’s decisions. If the line between designation and non-designation rests on relative user counts below the statutory thresholds, then the Commission is relying on an unstated measure of size. The numbers are not high enough to trigger Article 3(2), yet the Commission treats them as high enough under Article 3(8). That approach replaces the DMA’s express quantitative thresholds with an undisclosed set of lower ones.

D. Foreseeable Entrenchment Requires Evidence

The European Commission may argue that the competitive problem is forward-looking. Article 3(1)(c) permits designation when it is “foreseeable” that an undertaking will attain an entrenched and durable position “in the near future.” The Commission’s public framing points in that direction. It describes cloud computing as “a prerequisite for AI,” suggests that AI tools and partnerships influence procurement decisions, and presents the investigations in terms of European technological sovereignty.[73]

On that account, the Commission could concede that AWS and Microsoft Azure face meaningful competition today while predicting that AI workloads, “data gravity,” and sovereign-cloud requirements will entrench them tomorrow. Data gravity refers to the tendency of large datasets to attract related applications, services, and computing resources because moving the data becomes costly or impractical.

But a prediction of foreseeable entrenchment remains a claim about market contestability, even when it looks ahead. It must therefore satisfy the reasoning standard the General Court applied in Meta Platforms. The Court annulled the Facebook Marketplace designation on two grounds. First, the legality of a designation had to be assessed “on the basis of the facts and the law as they stood at the time when the measure was adopted.” Second, the Commission’s treatment of a material factual change was “vague and hypothetical” and lacked any “specific analysis.”[74]

The Court applied the ordinary standard governing statements of reasons under European Union law:

[T]he statement of reasons required by … Article 296 TFEU … must disclose in a clear and unequivocal fashion the reasoning followed by the institution which adopted the measure … to enable the persons concerned to ascertain the reasons for it and to enable the court having jurisdiction to exercise its power of review.[75]

By the time of the judgment, the Commission had already removed Marketplace’s designation after its user numbers fell below the thresholds. The ruling nevertheless matters because of its ex tunc effect and the evidentiary standard it establishes.[76]

A finding that cloud services are large and AI will lock in their positions would be conclusory under Meta Platforms. To survive review, the Commission would need to identify the mechanism by which AI demand will convert today’s contested positions into entrenched ones. It would also need to define the relevant time horizon, because the “near future” cannot mean an open-ended period, and provide evidence available at the time of adoption showing that competition will cease to constrain AWS and Azure.

The current AI record points in the opposite direction. CERRE’s 2025 assessments conclude that competition in cloud computing and AI remains strong, both in present conditions and over time, and caution against broad ex ante intervention.[77] Model developers commonly use several cloud providers, and the leading cloud–AI partnerships have generally remained nonexclusive.[78]

The CMA’s work on foundation models and the Autorité de la concurrence’s opinion on generative AI identify access to computing capacity as a possible future concern, while documenting substantial current competition.[79] The FTC’s Section 6(b) study of cloud–AI partnerships raises questions about spending commitments and vertical relationships, but it offers no evidence that cloud-infrastructure markets are tipping.[80]

Entry also weakens the claim that AI will deepen incumbent moats. AI demand has helped Oracle gain share and has supported the emergence of specialized “neocloud” providers, which now account for roughly 5% of the market and are expected to continue growing rapidly.[81] Cloud computing has also lowered barriers to AI adoption by giving startups access to advanced models and computing resources through services such as Amazon Bedrock and Azure OpenAI Service.[82] The development the Commission portrays as a future source of entrenchment has so far expanded access and encouraged entry.

The broader political context also warrants attention. The Commission proposed the Cloud and AI Development Act (CADA) at the same time as the preliminary designations. CADA is an industrial-policy measure expressly motivated by the decline in EU providers’ market share from roughly 29% in 2017 to 15% in 2022. Read alongside CADA and Mario Draghi’s account of European dependence on non-European computing capacity, the cloud investigations appear partly connected to technological-sovereignty goals.[83]

Those goals may support separate industrial-policy measures. They do not, however, alter the legal test under the DMA. Dependence on foreign providers does not make a company a gatekeeper, and technological sovereignty cannot substitute for evidence that AWS or Azure holds, or will soon hold, an entrenched and durable position.

IV. Proportionality and the Available Alternatives

The preceding section assessed whether the proposed designations satisfy Article 3(1). This section asks a separate question. Even if the European Commission could establish those conditions, is designation a proportionate response to the competitive frictions documented in the cloud market?

Two comparisons guide the analysis. Section IV.A examines the United Kingdom, where competition authorities reviewed the same firms on an extensive evidentiary record and chose voluntary commitments rather than designation under the country’s comparable ex ante regime. Section IV.B turns to the European Union’s Data Act, a purpose-built switching regime whose central prohibition has not yet taken effect. It also considers the Commission’s parallel inquiry into whether the DMA’s existing obligations can address cloud-specific concerns.

Both comparisons point toward narrower measures. Designation is the most intrusive option available, yet the Commission is pursuing it before testing the tailored remedies already adopted or determining whether the obligations it would trigger fit the conduct at issue.

A. The United Kingdom Chooses a Lighter Touch

The United Kingdom examined the same market and the same two firms under a regime whose gatekeeper logic closely resembles that of the DMA. It reached a different conclusion.

In 2023, Ofcom referred cloud-infrastructure services to the CMA. Ofcom found that AWS and Microsoft held a combined U.K. market share of 70% to 80%. It identified egress fees, technical-interoperability barriers, and committed-spend discounts as impediments to switching, while also documenting strong competition for new customers.[84]

The CMA completed its market investigation in July 2025. It concluded that AWS and Microsoft each held significant and entrenched unilateral market power, protected by high barriers to entry. The CMA also identified adverse effects on competition arising from switching frictions and Microsoft’s software-licensing practices. Its inquiry group recommended that the CMA Board prioritize Strategic Market Status (SMS) investigations into both companies’ cloud businesses under the Digital Markets, Competition and Consumers Act 2024 (DMCCA).[85]

The Board reviewed the same record and declined to follow that recommendation. In March 2026, it accepted a package of voluntary commitments addressing egress and interoperability, which the CMA cannot itself enforce, including the extension of European Union Data Act switching standards to U.K. customers. The CMA said it would review progress in six months’ time.

The Board directed the concern it considered serious enough for possible designation—Microsoft’s software-licensing practices—into an SMS investigation of Microsoft’s business-software offerings rather than cloud infrastructure itself.[86]

The decision drew criticism. Practitioners argued that the Board had departed from the inquiry group’s recommendation without offering a fully persuasive explanation, and coalitions representing challenger providers objected strongly.[87] Nor did the Board foreclose a future SMS investigation into cloud services.

Still, the authority with the most extensive evidentiary record assembled on AWS and Microsoft concluded that voluntary commitments offered a proportionate response in a market that remains competitive and continues to change. The decision reflects the risk that broad intervention in a market central to AI-driven growth could condemn competitive conduct or impede investment. Negotiated remedies, by contrast, can address identified practices while reducing that risk.

The European Commission is pursuing a markedly different course under the DMA, although the comparison is not exact. The DMCCA requires findings of substantial and entrenched market power and strategic significance, while the DMA formally disclaims a market-power test.[88]

Yet the qualitative routes under the two regimes converge on the same economic question, as Section III.B explains. Both require an assessment of contestability. The U.K. authority made an express finding of market power but still chose targeted commitments. The Commission proposes broader intervention on a thinner basis.

The proposed designations would be the first to cover services that satisfy neither user threshold. They would also subject AWS and Azure to the DMA’s full set of obligations in a market that the CMA recently concluded could be addressed through narrower, voluntary measures.

B. The Data Act and the Proportionality Problem

Proportionality presents a final obstacle to designation. The European Union has already enacted a purpose-built regime for the specific frictions documented in the cloud market.

Chapter VI of the Data Act applies to all providers of “data processing services,” rather than only designated gatekeepers. It requires providers to remove commercial, technical, contractual, and organizational barriers to switching. The law caps switching charges, including data-egress fees, at cost during a transitional period and prohibits them entirely beginning Jan. 12, 2027. It also requires functional equivalence and open interoperability specifications, supported by European Commission-endorsed standard contractual clauses.[89]

Scholars have examined the economics and legal structure of this regime in detail.[90] The national competition authorities that studied cloud services most closely also identified the Data Act as the appropriate remedial instrument. In 2023, France’s Autorité de la concurrence concluded that existing competition-law tools and the proposed Data Act could address most of the risks it identified. The Netherlands Authority for Consumers and Markets likewise pointed to the Data Act as the proper means of addressing cloud lock-in.[91] As Section IV.A explains, the United Kingdom’s remedial package also incorporates Data Act switching standards.

Against that background, several commentators argue that the Commission should explain why the tailored regime is inadequate before invoking the DMA. That requirement would follow from proportionality and the need for coherence across the European Union’s digital laws.[92] Designation would impose the DMA’s broadest obligations on services already governed by a specialized switching regime whose central prohibition has not yet taken effect.

The Commission appears to recognize the mismatch. On the same day it opened the designation investigations, it launched a separate investigation under Article 19 of the DMA into whether the regulation’s existing obligations can address the practices identified in cloud services. Those practices include interoperability barriers, restrictions on data access, tying and bundling, and imbalanced contract terms.

The Commission must issue its Article 19 report within 18 months. The report could support delegated acts under Articles 12 and 49.[93] It is expected around May 2027, six months after the November 2026 deadline for the designation decisions.

The sequence is backward. The Commission proposes to designate AWS and Azure before determining whether the obligations triggered by designation fit the cloud industry.[94] Commentators have already observed that none of the DMA’s current obligations directly addresses the concerns documented in cloud markets.

Designation without suitable obligations would impose substantial compliance costs while producing little improvement in contestability. A proportionate response should connect the identified harm to a remedy capable of addressing it. The Commission’s parallel investigation suggests that this connection has not yet been established.

The Commission’s first DMA review report, published in April 2026, presents the cloud investigations as evidence that the regulation’s “future-proofing tools” are working and concludes that no legislative amendment is needed.[95] But the investigations cannot validate the DMA’s flexibility before the Commission has established that designation is lawful and that the resulting obligations are appropriate. Treating the proposed designations as proof of the framework’s success assumes the very proposition the Commission must still demonstrate.

V. Conclusion: When Size Becomes Gatekeeping

The arguments developed here do not guarantee that the proposed cloud designations will fail. Article 3 permits two competing interpretations. Under the narrower reading, the qualitative criteria filter out firms that are large but do not control genuine gateways. Under the broader reading, a large company that provides a CPS may qualify as a gatekeeper largely because the DMA assumes that size, durability, and integration in digital markets tend to produce gatekeeper power.

The General Court’s first two DMA judgments suggest how the courts may police that boundary. ByteDance and Meta both involved the statutory presumptions. The Commission prevailed when the numerical thresholds supported the qualitative criteria.[96] When the Court annulled the Facebook Marketplace designation, it focused on the quality of the Commission’s reasoning. It required the Commission to assess the facts as they existed when the decision was adopted and to provide a concrete analysis of material developments.[97]

The courts need not import Article 102 TFEU’s market-power test into the DMA. They can protect the same economic substance by requiring the Commission to prove each element of a subthreshold designation separately. The pending ByteDance appeal may further define how closely the courts will review that reasoning.[98]

The AWS and Azure investigations therefore present a consequential test. In every previous designation, a quantitative presumption largely carried the substantive inquiry. Article 3(8) offers no such shortcut. The Commission must prove that each cloud service is an important gateway under Article 3(1)(b), and that the undertaking enjoys, or foreseeably will enjoy, an entrenched and durable position in its operations under Article 3(1)(c).[99]

The current record makes that task difficult. Quality-adjusted prices have fallen, market shares have shifted, multihoming is widespread, providers have reduced switching costs, and new entrants are capturing demand associated with AI. The Commission has also excluded Google Cloud without explaining the distinction, while relying at times on the combined position of two firms that compete against each other. Meanwhile, the Data Act’s tailored switching rules have not yet taken full effect, and the United Kingdom chose voluntary commitments after examining the same market on a fuller record.

If those facts nevertheless suffice for designation, the DMA’s qualitative criteria will have done little more than repackage size and commercial importance. “Gateway” will mean indispensability as an input rather than intermediation between users. “Entrenched and durable” will describe scale rather than limited contestability. Forward-looking claims about AI and data gravity will substitute for evidence that rivalry is likely to weaken.

The alternative is to give each statutory condition independent force. “Gateway” should require intermediation, not mere criticality. “Entrenched and durable” should require evidence that rivals cannot discipline the incumbent. Predictions about future entrenchment should satisfy Article 296’s demand for specific and contemporaneous reasoning. Proportionality should also require the Commission to explain why the Data Act and targeted enforcement cannot address the documented concerns.

Under that reading, the Commission should not convert its preliminary position into a final designation. If it does, the courts should require the evidence and reasoning that Article 3(8) demands.

[1] Press Release, Eur. Comm’n, Commission Reaches Preliminary Position that Amazon’s and Microsoft’s Market-Leading Cloud Services Should Be Designated Under the Digital Markets Act (June 25, 2026), https://ec.europa.eu/commission/presscorner/detail/en/ip_26_1444 [hereinafter Preliminary Position]; see Regulation (EU) 2022/1925 of the European Parliament and of the Council of 14 September 2022 on Contestable and Fair Markets in the Digital Sector and Amending Directives (EU) 2019/1937 and (EU) 2020/1828 (Digital Markets Act), 2022 O.J. (L 265) 1 [hereinafter DMA].

[2] Eur. Comm’n, Commission Launches Market Investigations on Cloud Computing Services Under the Digital Markets Act (Nov. 18, 2025), https://digital-markets-act.ec.europa.eu/commission-launches-market-investigations-cloud-computing-services-under-digital-markets-act-2025-11-18_en. The Commission simultaneously opened a third investigation under Article 19 of the DMA to determine whether the regulation’s existing obligations can effectively address practices in the cloud sector. See infra Section IV.B.

[3] Preliminary Position, supra note 1 (reporting that final decisions are due by November 2026 under the 12-month deadline for market investigations); DMA, supra note 1, arts. 3(10), 17 (providing a six-month compliance window following designation).

[4] Commission Decision of 29.4.2024, Apple—iPadOS, Case DMA.100047, https://ec.europa.eu/competition/digital_markets_act/cases/202427/DMA_100047_5491.pdf [hereinafter iPadOS].

[5] Id.; see also Press Release, Eur. Comm’n, Commission Designates Apple’s iPadOS Under the Digital Markets Act (Apr. 29, 2024), https://ec.europa.eu/commission/presscorner/detail/en/ip_24_2363 (“Apple’s business user numbers exceeded the quantitative threshold elevenfold, while its end user numbers were close to the threshold and are predicted to rise in the near future.”).

[6] Lazar Radic, Cloudy Logic: The DMA’s Search for a Gatekeeper, Truth on the Mkt. (Apr. 14, 2026), https://truthonthemarket.com/2026/04/14/cloudy-logic-the-dmas-search-for-a-gatekeeper.

[7] DMA, supra note 1, art. 3(1). The three criteria and their accompanying presumptions are discussed infra Section II.A.

[8] DMA, supra note 1, art. 3(1)(a)–(c).

[9] Id. art. 3(2)(a)–(c).

[10] Case T-1077/23, ByteDance Ltd. v. Comm’n, ECLI:EU:T:2024:478, ¶ 71 (July 17, 2024) [hereinafter ByteDance] (holding that arguments submitted under Article 3(5) must “manifestly call into question” the presumptions—a standard requiring a high degree of plausibility). An appeal is pending before the Court of Justice. See infra note 98.

[11] DMA, supra note 1, arts. 3(8), 17.

[12] Friso Bostoen & Giorgio Monti, The Rhyme and Reason of Gatekeeper Designation Under the Digital Markets Act, J. Antitrust Enf’t (advance article 2025), jnae054, https://doi.org/10.1093/jaenfo/jnae054 [hereinafter Bostoen & Monti].

[13] DMA, supra note 1, recital 23 (authorizing designation based on a qualitative assessment conducted through a market investigation).

[14] Cf. Bostoen & Monti, supra note 12 (documenting the evidence used to assess each criterion under Article 3(1)).

[15] Jacques Crémer, Yves-Alexandre de Montjoye & Heike Schweitzer, Competition Policy for the Digital Era (2019) (report prepared for the Eur. Comm’n); Digit. Competition Expert Panel, Unlocking Digital Competition (2019) (U.K.) [hereinafter Furman Review]; Stigler Comm. on Digit. Platforms, Final Report (2019).

[16] Nicolas Petit, The Proposed Digital Markets Act (DMA): A Legal and Policy Review, 12 J. Eur. Competition L. & Prac. 529 (2021).

[17] Luís Cabral et al., The EU Digital Markets Act: A Report from a Panel of Economic Experts (Joint Rsch. Ctr. 2021).

[18] Damien Geradin, What Is a Digital Gatekeeper? Which Platforms Should Be Captured by the EC Proposal for a Digital Markets Act? 20 (Feb. 2021) (unpublished manuscript) (“The methodology used to designate gatekeepers cannot be divorced from the issue(s) that ex ante regulation seeks to address, as otherwise the DMA might end up regulating the wrong set of companies.”).

[19] Pinar Akman, Regulating Competition in Digital Platform Markets: A Critical Assessment of the Framework and Approach of the EU Digital Markets Act, 71 Int’l & Comp. L.Q. 85 (2022).

[20] Pablo Ibáñez Colomo, The Draft Digital Markets Act: A Legal and Institutional Analysis, 12 J. Eur. Competition L. & Prac. 561 (2021).

[21] See, e.g., Giuseppe Colangelo, The European Digital Markets Act and Antitrust Enforcement: A Liaison Dangereuse, 47 Eur. L. Rev. 597 (2022); Viktoria H.S.E. Robertson, The Complementary Nature of the Digital Markets Act and the EU Antitrust Rules, 12 J. Antitrust Enf’t 325 (2024).

[22] See, e.g., Fiona Scott Morton & Cristina Caffarra, The European Commission Digital Markets Act: A Translation, VoxEU (Jan. 5, 2021).

[23] Bostoen & Monti, supra note 12 (surveying the 34 designation decisions adopted at the time of publication and analyzing how each applied the designation criteria, as well as the type I- and type II-error-correction functions of Articles 3(5) and 3(8)).

[24] Eur. Comm’n, Commission Concludes that Online Social Networking Service X Should Not Be Designated Under the Digital Markets Act (Oct. 16, 2024), https://digital-markets-act.ec.europa.eu/commission-concludes-online-social-networking-service-x-should-not-be-designated-under-digital-2024-10-16_en.

[25] Commission Decision of 5.9.2023, Alphabet, Case DMA.100011, https://ec.europa.eu/competition/digital_markets_act/cases/202344/DMA_100011_147.pdf (finding that Gmail was not an important gateway despite meeting the user-number thresholds); Commission Decision of 5.9.2023, Microsoft, Case DMA.100023, https://ec.europa.eu/competition/digital_markets_act/cases/202344/DMA_100023_115.pdf (reaching the same conclusion for Outlook.com).

[26] Press Release, Eur. Comm’n, Commission Closes Market Investigations into Microsoft’s and Apple’s Services Under the Digital Markets Act (Feb. 2024), https://ec.europa.eu/commission/presscorner/detail/en/mex_24_785 (addressing iMessage, Bing, Edge, and Microsoft Advertising).

[27] See Press Release, Eur. Comm’n, Digital Markets Act: Commission Designates Six Gatekeepers, IP/23/4328 (Sept. 6, 2023) (declining to designate Samsung because its browser was not an important gateway); Bostoen & Monti, supra note 12 (discussing the accepted rebuttals concerning TikTok Ads and X Ads).

[28] Autorité de la concurrence, Opinion 23-A-08 of 29 June 2023 on Competition in the Cloud Computing Sector, https://www.autoritedelaconcurrence.fr/en/press-release/cloud-computing-autorite-de-la-concurrence-issues-its-market-study-competition-cloud; Autoriteit Consument & Markt, Market Study Cloud Services (Sept. 5, 2022), https://www.acm.nl/system/files/documents/public-market-study-cloud-services.pdf; Japan Fair Trade Comm’n, Report Regarding Cloud Services (June 2022); OECD, Competition in the Provision of Cloud Computing Services (2025); Press Release, Fed. Trade Comm’n, FTC Seeks Comment on Business Practices of Cloud Computing Providers that Could Impact Competition and Data Security (Mar. 2023).

[29] See generally On-Topic: Cloud and Competition Policy, Concurrences No. 8-2025 (Aug. 2025) (Parts I–VIII, examining regulation in the age of hyperscalers, interoperability, policy responses to competition concerns, and cloud–AI partnerships).

[30] Antonio Manganelli & Daniel Schnurr, Competition and Regulation of Cloud Computing Services: Economic Analysis and Review of EU Policies (Ctr. on Regul. in Eur., Feb. 2024), https://cerre.eu/publications/competition-and-regulation-of-cloud-computing-services-economic-analysis-and-reviewbrof-eu-policies [hereinafter CERRE 2024]; see especially id. Recommendation 2 (urging proportionality when designating cloud services under the DMA because they differ from other core platform services).

[31] Konstantina Bania & Damien Geradin, The Regulation of Cloud Computing: Why the European Union Failed to Get It Right, 33 Info. & Commc’ns Tech. L. 1 (2024), https://doi.org/10.1080/13600834.2023.2260687.

[32] Selçukhan Ünekbas, Why Use the Digital Markets Act for Cloud?, Oxford Bus. L. Blog (May 4, 2026), https://blogs.law.ox.ac.uk/oblb/blog-post/2026/05/why-use-digital-markets-act-cloud.

[33] Kalpana Tyagi, Can Europe’s Digital Markets Act and Data Act Rein in Cloud Hyperscalers?, Tech Pol’y Press (Feb. 3, 2026), https://www.techpolicy.press/can-europes-digital-markets-act-and-data-act-rein-in-cloud-hyperscalers.

[34] Vanderbilt Pol’y Accelerator, How to Regulate the Cloud: A Blueprint to Address the Market Failures and National Security Risks of Cloud Computing (2025), https://cdn.vanderbilt.edu/vu-URL/wp-content/uploads/sites/412/2025/09/18140135/How-to-Regulate-the-Cloud.pdf; cf. Tejas N. Narechania & Ganesh Sitaraman, An Antimonopoly Approach to Governing Artificial Intelligence, 43 Yale L. & Pol’y Rev. 95 (2024) (treating cloud computing as an infrastructure layer that warrants regulation).

[35] See, e.g., The EU Commission Preliminarily Finds that 2 Leading Cloud Computing Providers Should Be Designated as Gatekeepers Under the DMA Despite Falling Below the Quantitative Thresholds (Amazon/Microsoft), e-Competitions (June 2026); Selçukhan Ünekbas, The EU’s Facebook Marketplace Decision: The Gatekeeper That Wasn’t, Truth on the Mkt. (June 4, 2026), https://laweconcenter.org/resources/the-eus-facebook-marketplace-decision-the-gatekeeper-that-wasnt (drawing implications from the Meta ruling for qualitative designations).

[36] DMA, supra note 1, art. 2(2)(i).

[37] Id. recital 14.

[38] Bania & Geradin, supra note 31 (arguing that the obligations imposed by the Digital Markets Act, Digital Services Act, and Data Act fit poorly with the technical and commercial characteristics of cloud services).

[39] Tyagi, supra note 33 (reconstructing the impact assessment’s ecosystem rationale for including cloud services and arguing that qualitative designation is better suited to innovation-intensive, business-facing markets).

[40] Preliminary Position, supra note 1.

[41] ByteDance, supra note 10, ¶ 210.

[42] Jean-Charles Rochet & Jean Tirole, Platform Competition in Two-Sided Markets, 1 J. Eur. Econ. Ass’n 990 (2003); Mark Armstrong, Competition in Two-Sided Markets, 37 RAND J. Econ. 668 (2006).

[43] Even these canonical platform markets do not fit neatly within the two-sided-market framework. See Dirk Auer & Nicolas Petit, Two-Sided Markets and the Challenge of Turning Economic Theory into Antitrust Policy, 60 Antitrust Bull. 426 (2015).

[44] Preliminary Position, supra note 1; see also Eur. Comm’n, Commission Reaches Preliminary Position that Amazon’s and Microsoft’s Market-Leading Cloud Services Should Be Designated Under the Digital Markets Act, Digit. Strategy (June 25, 2026), https://digital-strategy.ec.europa.eu/en/news/commission-reaches-preliminary-position-amazons-and-microsofts-market-leading-cloud-services-should (quoting Executive Vice Presidents Teresa Ribera and Henna Virkkunen).

[45] The firms facing designation make nearly identical arguments. See Amazon, Why Applying the DMA to Cloud Would Regulate Away EU Competitiveness and Resiliency (June 2026), https://www.aboutamazon.eu/news/policy/why-applying-the-DMA-to-cloud-would-regulate-away-eu-competitiveness-and-resiliency (arguing that cloud services involve no intermediation, cross-side network effects, or gateway function). We cite the paper as a party submission, not as independent authority.

[46] See Eur. Comm’n, Commission Concludes that Online Social Networking Service X Should Not Be Designated Under the Digital Markets Act, supra note 24.

[47] See Commission Decision of 5.9.2023, Alphabet, supra note 25; Commission Decision of 5.9.2023, Microsoft, supra note 25.

[48] See Eur. Comm’n, Commission Closes Market Investigations into Microsoft’s and Apple’s Services Under the Digital Markets Act, supra note 26.

[49] iPadOS, supra note 4; see also Bostoen & Monti, supra note 12 (analyzing the decision’s reasoning and reliance on projected end-user growth).

[50] Crémer, de Montjoye & Schweitzer, supra note 15; Furman Review, supra note 15.

[51] ByteDance, supra note 10, paras 45-46 (rejecting arguments that designation requires market definition or proof of market power).

[52] See Robertson, supra note 21; Georgios Gryllos, The New Digital Landscape: Interaction Between the DMA and Rules of National and EU Law Governing the Conduct of Gatekeepers, Concurrences No. 1-2024, Art. No. 116827, at 40 (2024).

[53] ByteDance, supra note 10, ¶¶ 296–297.

[54] William J. Baumol, Contestable Markets: An Uprising in the Theory of Industry Structure, 72 Am. Econ. Rev. 1 (1982); William J. Baumol, John C. Panzar & Robert D. Willig, Contestable Markets and the Theory of Industry Structure (1982).

[55] Chad Syverson, Macroeconomics and Market Power: Context, Implications, and Open Questions, 33 J. Econ. Persps. 23 (2019).

[56] Synergy Rsch. Grp., Cloud Market Annual Revenue Run Rate Topped Half a Trillion Dollars in Q1 as Growth Surge Continues (Apr. 2026), https://www.srgresearch.com/articles/cloud-market-annual-revenue-run-rate-topped-half-a-trillion-dollars-in-q1-as-growth-surge-continues (reporting first-quarter 2026 market shares of 28% for Amazon Web Services, 21% for Microsoft, and 14% for Google, with neoclouds accounting for 5% of the market and five providers ranking among the top 30); Synergy Rsch. Grp., Cloud Market Share Trends: Big Three Together Hold 63%, While Oracle and the Neoclouds Inch Higher (2025), https://www.srgresearch.com/articles/cloud-market-share-trends-big-three-together-hold-63-while-oracle-and-the-neoclouds-inch-higher (reporting that Amazon Web Services’ share declined from roughly 32% in 2021).

[57] David Byrne, Carol Corrado & Daniel E. Sichel, The Rise of Cloud Computing: Minding Your P’s, Q’s and K’s (Nat’l Bureau of Econ. Rsch., Working Paper No. 25188, 2018), https://www.nber.org/papers/w25188, reprinted in Measuring and Accounting for Innovation in the Twenty-First Century (Carol Corrado et al. eds., 2020).

[58] See Wasabi, Cloud Storage Fee Inflation, Wasabi Blog (Sept. 29, 2022), https://wasabi.com/blog/cost-optimization/cloud-storage-fee-inflation (reporting that Amazon S3 list prices fell by more than 80% in the early 2010s).

[59] Paul Klemperer, Competition When Consumers Have Switching Costs: An Overview with Applications to Industrial Organization, Macroeconomics, and International Trade, 62 Rev. Econ. Stud. 515 (1995); Joseph Farrell & Paul Klemperer, Coordination and Lock-In: Competition with Switching Costs and Network Effects, in 3 Handbook of Industrial Organization 1967 (Mark Armstrong & Robert Porter eds., 2007).

[60] Ofcom, Cloud Services Market Study: Final Report (Oct. 5, 2023), https://www.ofcom.org.uk/siteassets/resources/documents/consultations/category-3-4-weeks/244808-cloud-services-market-study/associated-documents/cloud-services-market-study-final-report.pdf [hereinafter Ofcom Report] (documenting strong competition for new customers); Competition & Mkts. Auth., Cloud Services Market Investigation: Summary of Final Decision (July 31, 2025), https://assets.publishing.service.gov.uk/media/688b20e6ff8c05468cb7b120/summary_of_final_decision.pdf [hereinafter CMA Final Decision].

[61] See Google Cloud, Eliminating Data Transfer Fees When Migrating Off Google Cloud (Jan. 2024), https://cloud.google.com/blog/products/networking/eliminating-data-transfer-fees-when-migrating-off-google-cloud; Amazon Web Servs., Free Data Transfer Out to Internet When Moving Out of AWS (Mar. 2024), https://aws.amazon.com/blogs/aws/free-data-transfer-out-to-internet-when-moving-out-of-aws; Microsoft Azure, Now Available: Free Data Transfer Out to Internet When Leaving Azure (Mar. 2024), https://azure.microsoft.com/en-us/updates?id=now-available-free-data-transfer-out-to-internet-when-leaving-azure.

[62] Regulation (EU) 2023/2854 of the European Parliament and of the Council of 13 December 2023 on Harmonised Rules on Fair Access to and Use of Data (Data Act), 2023 O.J. (L 2854) 1, arts. 23–31 [hereinafter Data Act]. For a more detailed discussion, see infra Section IV.B.

[63] Flexera, State of the Cloud Report (2026 ed.), https://info.flexera.com/CM-REPORT-State-of-the-Cloud

[64] CMA Final Decision, supra note 60; Ofcom Report, supra note 60 (both distinguishing multicloud architectures from workload-level switching).

[65] CMA Final Decision, supra note 60 (finding that Amazon Web Services and Microsoft each held U.K. market shares by value of up to 30%–40% and recommending that the CMA Board prioritize Strategic Market Status investigations into both providers’ cloud activities).

[66] Ofcom Report, supra note 60.

[67] CMA Final Decision, supra note 60 (finding materially higher effective prices for running Windows Server and SQL Server on rival cloud platforms than on Azure); see also CISPE, CISPE and Microsoft Agree Settlement in Fair Software Licensing Case (July 11, 2024), https://www.cispe.cloud/cispe-and-microsoft-agree-settlement-in-fair-software-licensing-case (settling the association’s 2022 complaint on terms that excluded Amazon Web Services, Google, and Alibaba).

[68] See Google Files EU Antitrust Complaint Accusing Microsoft of Stifling Cloud Competition, CNBC (Sept. 25, 2024), https://www.cnbc.com/2024/09/25/google-files-eu-antitrust-complaint-accusing-microsoft-of-stifling-cloud-competition.html. Google withdrew the complaint on Nov. 28, 2025, after the European Commission opened its cloud-market investigations. See Caroline Donnelly, Google Cloud Withdraws Complaint with European Commission over Microsoft’s Cloud Licensing Tactics, Computer Weekly (Dec. 1, 2025), https://www.computerweekly.com/news/366635494/Google-Cloud-withdraws-complaint-with-European-Commission-over-Microsofts-cloud-licensing-tactics.

[69] DMA, supra note 1, art. 3(9); Case T-1078/23, Meta Platforms, Inc. v. Comm’n, ECLI:EU:T:2026:357, paras 64 and 174  (Gen. Ct. June 3, 2026) [hereinafter Meta] (upholding Messenger’s designation as a distinct core platform service that individually constitutes an important gateway).

[70] See European Commission Lines Up Amazon and Microsoft for Cloud Gatekeeper Status, The Register (June 25, 2026), https://www.theregister.com/legal/2026/06/25/european-commission-lines-up-amazon-and-microsoft-for-cloud-gatekeeper-status/5262127; cf. Article 19, Investigations into Cloud Computing Under DMA a Welcome Move (Nov. 18, 2025), https://www.article19.org/resources/europe-investigations-into-cloud-computing-under-dma-a-welcome-move (noting, from a pro-designation perspective, the puzzle posed by Google Cloud’s exclusion).

[71] ByteDance, supra note 10 (rejecting the claim that the designation breached the principle of equal treatment).

[72] See, e.g., Case C-127/07, Arcelor Atlantique et Lorraine, ECLI:EU:C:2008:728, ¶ 23 (holding that comparable situations must not be treated differently, and different situations must not be treated alike, unless the difference is objectively justified).

[73] Preliminary Position, supra note 1 (describing cloud computing as “a prerequisite for AI”); see also sources cited supra note 45.

[74] Meta, supra note 69; see also Ct. Just. Eur. Union, Press Release No. 77/26 (June 3, 2026), https://curia.europa.eu/site/upload/docs/application/pdf/2026-06/cp260077en.pdf.

[75] Meta, supra note 69, ¶ 53.

[76] See Alba Ribera Martínez, The Chicken or Egg Dilemma: The General Court Partially Annuls the European Commission’s DMA Designation Decision Against Meta (Case T-1078/23), Kluwer Competition L. Blog (June 8, 2026), https://legalblogs.wolterskluwer.com/competition-blog/the-chicken-or-egg-dilemma-the-general-court-partially-annuls-the-european-commissions-dma-designation-decision-against-meta-case-t-107823 (discussing the legal-interest analysis and the probative-effort question).

[77] Zach Meyers & Marc Bourreau, A Competition Policy for Cloud and AI (Ctr. on Regul. in Eur., June 2025), https://cerre.eu/wp-content/uploads/2025/06/A-Competition-Policy-for-Cloud-and-AI_FINAL.pdf; Zach Meyers & Marc Bourreau, What Policy Interventions for a Competitive AI Sector? (Ctr. on Regul. in Eur., July 2025), https://cerre.eu/publications/what-policy-interventions-for-a-competitive-ai-sector.

[78] Christophe Carugati, The Competitive Relationship Between Cloud Computing and Generative AI (Bruegel, Working Paper No. 19/2023), https://www.bruegel.org/system/files/2023-12/WP%202023%2019%20Cloud%20111223.pdf (mapping largely nonexclusive cloud–AI partnerships and multihoming by model developers).

[79] Competition & Mkts. Auth., AI Foundation Models: Initial Report (Sept. 2023); Competition & Mkts. Auth., AI Foundation Models: Update Paper (Apr. 2024); Autorité de la concurrence, Opinion 24-A-05 of 28 June 2024 on the Competitive Functioning of the Generative Artificial Intelligence Sector.

[80] Fed. Trade Comm’n, Partnerships Between Cloud Service Providers and AI Developers: FTC Staff Report on AI Partnerships & Investments 6(b) Study (Jan. 2025), https://www.ftc.gov/system/files/ftc_gov/pdf/p246201_aipartnerships6breport_redacted_0.pdf.

[81] Synergy Rsch. Grp., Neocloud Market Forecast to Approach $400B by 2031, Driven by Surging AI Infrastructure Demand (2026), https://www.srgresearch.com/articles/neocloud-market-forecast-to-approach-400b-by-2031-driven-by-surging-ai-infrastructure-demand; see also sources cited supra note 56.

[82] Comments of the Int’l Ctr. for L. & Econ., In re Cloud Computing Request for Information, Fed. Trade Comm’n (June 2023), https://laweconcenter.org/resources/icle-response-to-the-ftcs-cloud-computing-rfi.

[83] Eur. Comm’n, Proposal for a Regulation Establishing a Framework of Measures for Strengthening Europe’s Cloud and AI Ecosystem (Cloud and AI Development Act), COM (2026) 502 final (June 3, 2026), https://digital-strategy.ec.europa.eu/en/policies/cloud-and-ai-development-act (noting that EU providers’ market share fell from roughly 29% in 2017 to 15% in 2022); Mario Draghi, The Future of European Competitiveness (Sept. 2024).

[84] Ofcom Report, supra note 60 (reporting a combined U.K. market share of 70%–80% and identifying frictions from egress fees, technical-interoperability barriers, and committed-spend discounts).

[85] CMA Final Decision, supra note 60.

[86] Press Release, Competition & Mkts. Auth., CMA Announces Package of Actions on Business Software and Cloud Services (Mar. 31, 2026), https://www.gov.uk/government/news/cma-announces-package-of-actions-on-business-software-and-cloud-services. The Strategic Market Status investigation into Microsoft’s business-software ecosystem began in May 2026, with a designation decision expected around February 2027.

[87] Christophe Humpe & Greg Dowell, CMA Decision to Shelve Cloud Services SMS Investigations Raises Questions, Macfarlanes (Apr. 2026), https://www.macfarlanes.com/insights/102mqfd/cma-decision-to-shelve-cloud-services-sms-investigations-raises-questions-around; see also Antony Adshead, CMA to Launch Strategic Market Status Investigation into Microsoft; Amazon Web Services Off the Hook, Computer Weekly (Mar. 2026), https://www.computerweekly.com/news/366640828/CMA-to-launch-strategic-market-status-investigation-into-Microsoft-Amazon-Web-Services-off-the-hook (collecting reactions from challenger providers).

[88] Digital Markets, Competition and Consumers Act 2024, c. 13, §§ 2, 5–6 (UK).

[89] Data Act, supra note 62, ch. VI, arts. 23–31, 34–35; see also Eur. Comm’n, Data Act Explained, Digit. Strategy, https://digital-strategy.ec.europa.eu/en/factpages/data-act-explained (explaining that switching charges are capped at cost during a transitional period and prohibited beginning Jan. 12, 2027, and that standard contractual clauses were published in 2025).

[90] Daniel Schnurr, Switching and Interoperability Between Data Processing Services in the Proposed Data Act, in Data Act: Towards a Balanced EU Regulation (Ctr. on Regul. in Eur. 2023), https://cerre.eu/wp-content/uploads/2023/03/230327_Data-Act-Book.pdf; Leonie Ott & Yifeng Dong, Clouds Connecting Europe: Interoperability in the EU Data Act, JIPITEC (2025), https://www.jipitec.eu/jipitec/article/download/435/434/2202.

[91] Autorité de la concurrence, Opinion 23-A-08, supra note 28; Autoriteit Consument & Markt, supra note 28.

[92] Ünekbas, supra note 32; see also Consolidated Version of the Treaty on European Union art. 5(4), 2012 O.J. (C 326) 13 (requiring proportionality in Union action).

[93] Eur. Comm’n, Commission Launches Market Investigations on Cloud Computing Services Under the Digital Markets Act, supra note 2; see also Eur. Comm’n, Commission Hosted Stakeholder Roundtable on Cloud Computing Services Under the Digital Markets Act (July 1, 2026), https://digital-markets-act.ec.europa.eu/commission-hosted-stakeholder-roundtable-cloud-computing-services-under-digital-markets-act-2026-07-01_en (describing the Article 19 investigation as “distinct and separate” from the designation investigations).

[94] See Alba Ribera Martínez, Generative AI in Check: Gatekeeper Power and Policy Under the DMA, Kluwer Competition L. Blog (Nov. 19, 2024), https://legalblogs.wolterskluwer.com/competition-blog/generative-ai-in-check-gatekeeper-power-and-policy-under-the-dma.

[95] Eur. Comm’n, Report on the First Review of the Digital Markets Act, COM (2026) 178 final (Apr. 28, 2026), https://digital-markets-act.ec.europa.eu/system/files/2026-04/DMA%20Review%20Report_COM_2026_178_1_EN.pdf; see also Megan Kirkwood, What the EU’s First Digital Markets Act Review Actually Changes, Tech Pol’y Press (Apr. 30, 2026), https://www.techpolicy.press/what-the-eus-first-digital-markets-act-review-actually-changes.

[96] See ByteDance, supra note 10; Meta, supra note 69 (upholding Messenger’s designation).

[97] Meta, supra note 69.

[98] Case C-627/24 P, ByteDance Ltd v. Comm’n (appeal lodged Sept. 26, 2024; argued May 12, 2026; judgment pending).

[99] Meta, supra note 69, paras 168, 219.

ICLE Issue Brief

The Invisible Infrastructure: Spectrum Policy for the AI Era

Executive Summary Radio spectrum is essential infrastructure for artificial intelligence, augmented reality, virtual reality, and other next-generation wireless applications. Yet spectrum is not a conventional natural resource. Its scarcity arises...

Executive Summary

Radio spectrum is essential infrastructure for artificial intelligence, augmented reality, virtual reality, and other next-generation wireless applications. Yet spectrum is not a conventional natural resource. Its scarcity arises from limits on bandwidth, interference, network design, and the legal rights that determine who may transmit, where, and under what conditions.

No single frequency band or access model can meet every need. Licensed spectrum supports wide-area networks and reliable service. Unlicensed spectrum powers Wi-Fi, short-range devices, and much indoor immersive use. Dynamic sharing can open bands that cannot be fully cleared, while satellite networks extend coverage beyond terrestrial systems. Policymakers should preserve this balance rather than judge allocations by auction revenue alone.

The current U.S. system creates avoidable delay and uncertainty. Divided authority between the Federal Communications Commission and the National Telecommunications and Information Administration complicates federal reallocation. The Spectrum Relocation Fund remains cumbersome, and worst-case interference analysis can block productive uses based on highly improbable scenarios.

The United States should strengthen interagency coordination, streamline relocation funding, adopt risk-informed interference analysis, expand advanced coordination tools, and present coherent positions internationally. These reforms would protect incumbents where necessary while making more spectrum available for investment, competition, and innovation.

I. Introduction

In the opening issue brief in this series, International Center for Law & Economics Director of Innovation Policy Kristian Stout examined how infrastructure shapes where innovation takes root.[1] Technology clusters flourish where roads, power, communications networks, and other shared resources support investment and growth. The returns may take time, but the United States’ past investments in these enabling conditions helped make it the world’s technological leader. This approach amounts to horizontal industrial policy, which creates broad conditions for innovation without choosing favored technologies or firms.[2]

Stout identifies several forms of infrastructure that the United States will need to sustain that lead. Radio spectrum—the frequencies used to transmit wireless signals—rarely receives equal attention. It tends to make news when Congress treats auction revenue as a way to pay for must-pass legislation or when harmful interference threatens to disrupt air travel.[3] Yet every wireless service depends on predictable access to frequencies where competing signals will not overwhelm or interrupt one another. Spectrum therefore forms a basic layer of modern communications infrastructure.

Spectrum is harder to picture than a highway, power line, or pipe. It consists of a finite range of electromagnetic frequencies that can carry signals through the air. Those signals support mobile calls, Wi-Fi, GPS navigation, emergency communications, satellite services, and countless other applications. Different frequencies have different physical properties, and several operators may want to transmit on the same frequency, in the same place, at the same time. Without rules governing those uses, interference can prevent every affected service from working as intended.

The United States has therefore created operating rights that divide access to spectrum among users. Federal agencies and international bodies allocate those rights to limit harmful interference and allow different services to coexist.[4] These decisions determine who may use particular frequencies, under what conditions, and for which purposes. Spectrum management is consequently an economic and political exercise as well as a technical one.

Poor spectrum management can constrain the digital economy much as highway congestion impedes commerce. Artificial intelligence (AI), autonomous vehicles, smart manufacturing, precision agriculture, and augmented- and virtual-reality applications require substantial wireless capacity, very low latency, and reliable connections. Meeting those demands requires a balanced strategy that combines high-powered exclusive licenses, shared-access regimes, and unlicensed spectrum.

Exclusive licenses give mobile carriers predictable protection from interference, allowing them to invest in dense 5G and future 6G networks. These networks can support AI-enabled and other data-intensive applications when users lack access to a dedicated local network. Unlicensed spectrum offers easier access for Wi-Fi, internet-of-things sensors, experimental technologies, and services operating over shorter distances. Shared-access regimes allow several users to operate within the same band under rules that coordinate their transmissions.

Each model serves different technical and economic purposes. Overreliance on any one of them can restrict entry, weaken investment certainty, or leave valuable frequencies underused. Exclusive licensing, shared access, and unlicensed use should therefore operate as complementary tools within a broader spectrum strategy.

The federal government must also move more quickly to reallocate underused spectrum held by incumbent users, including federal agencies. Commercial networks, scientific research, and emerging technologies will require access to additional frequencies. Delayed reallocation carries real costs by slowing deployment, investment, and experimentation.

Spectrum policy is infrastructure policy. The choices federal officials make today will shape whether the United States can build and deploy the next generation of wireless technologies.

II. What Spectrum Is, Why It Is Scarce, and How It Creates Value

Sound spectrum policy begins with a clear account of the resource being managed. Spectrum refers to the frequencies used to carry wireless signals, but the policy term often blends physical capacity, interference constraints, and government-created operating rights.

Those distinctions shape the analysis that follows. Technical scarcity reflects limits on bandwidth, receiver performance, and the number of systems that can operate without harmful interference. Legal scarcity arises from the licenses, band plans, and operating rules that determine who may transmit. Because those rights are indispensable and their value varies across commercial, public, and unlicensed uses, regulators must decide which allocation method will produce the greatest economic and public benefit.

A. What Is Spectrum?

Any discussion of spectrum policy should begin with the technology itself. Radios transmit information by modifying an electromagnetic wave, usually by changing its amplitude, frequency, or another feature of the signal. Most modern systems use digital transmission, which encodes information as binary data. Digital signals can carry large amounts of information and can be copied or regenerated with less degradation than analog signals.

An electromagnetic wave moves through repeating cycles. Its frequency measures how many cycles occur during a given period, usually one second. Frequency is measured in hertz. A wave that completes 1 million cycles per second operates at 1 megahertz, while one that completes 1 billion cycles per second operates at 1 gigahertz.

A radio receiver detects the electric and magnetic fields carried by an incoming wave. Those fields generate a small alternating current that corresponds to the wave’s frequency. Because the surrounding environment contains many electromagnetic signals, the receiver must isolate the one it is designed to use.

A tuner performs that task by adjusting the receiver’s resonant frequency. The receiver responds most strongly to the selected carrier frequency while filtering out much of the surrounding noise. It then demodulates the signal, extracting the information carried by the wave. Traditional amplitude modulation (AM) stores information in changes to the wave’s strength. Frequency modulation (FM) stores it in changes to the wave’s frequency. The receiver then amplifies and converts the extracted information into the desired output, such as sound from an AM radio broadcast.

This distinction matters for policymakers because “spectrum” can refer to different things. In physical terms, the radio spectrum is the range of frequencies used for wireless communications. In policy debates, officials often speak of “freeing up” spectrum or making more of it available. That language treats spectrum as a scarce, property-like resource. Frequency, though, differs from ordinary property in important ways. The underlying frequencies do not run out. Scarcity arises because multiple users may seek to transmit at the same frequency, time, and place, creating interference that prevents their systems from working as intended.

B. What Spectrum Scarcity Really Means

Spectrum is often described as a scarce natural resource. The analogy is useful, but incomplete. Radio frequencies are not consumed through use. Scarcity arises because communications systems have limited capacity and may interfere with one another when they operate at the same frequency, time, and place.[5]

Spectrum scarcity therefore has two related forms. Technical scarcity reflects limits on bandwidth, receiver performance, network design, and the number of systems that can operate without harmful interference. Legal scarcity results from the licenses, band plans, and operating rules that determine who may transmit and under what conditions. Together, these technical constraints and legal rights determine how much spectrum capacity users can put to productive use.

1.        Technical Scarcity

From a technical perspective, spectrum scarcity can describe two different constraints. The first concerns bandwidth, which is the range of frequencies available to carry a signal.[6] Wider channels can transmit more data per second than narrower ones.

Channels sit within larger frequency bands, each defined by an upper and lower boundary and often allocated for a particular use. A channel only a few megahertz wide can carry limited information at any one time. A much wider channel can carry far more data. Higher-frequency bands often accommodate wider channels,[7] but they also tend to have shorter range and weaker ability to penetrate walls and other obstacles. Spectrum policy therefore requires tradeoffs between channel width and the physical characteristics of the frequencies involved.[8]

Radio frequencies themselves are not depleted through use. A transmission does not consume a channel or leave less of it for the next user. The relevant constraint is the amount of information a channel can carry.

Claude Shannon formalized that limit. Shannon’s law establishes the maximum amount of information that a communications channel can transmit given its bandwidth and signal-to-noise ratio.[9] Better antennas, coding, and signal processing can move a system closer to that ceiling, but they cannot exceed it.

Policymakers usually have a second form of scarcity in mind. Several radios may seek to operate at the same frequency, time, and place. Electromagnetic waves can pass through one another, but a receiver may fail to distinguish its intended signal from surrounding transmissions or noise. The desired information may then become distorted, drowned out, or impossible to recover. That condition is interference.

Every radio system encounters some interference. Harmful interference occurs when interference prevents a service from functioning as intended.[10] The Federal Communications Commission (FCC) licenses many radio operations and adopts technical rules designed to limit that risk. This process is known as spectrum management.

Interference does not always result from too many users competing for too few frequencies. It may instead reflect poor receiver design, inadequate filtering, insufficient network density, or other engineering choices within a particular system. Coordination can also allow several users to share a channel while each operates near the channel’s technical capacity.

Technical spectrum scarcity therefore does not mean that one user consumes a finite resource at another’s expense. It describes limits created by channel capacity, receiver performance, network design, and the interaction among multiple radio systems.

2.        Legal Scarcity

Technical scarcity depends on both the bandwidth available to a system and its ability to operate without harmful interference. Spectrum management seeks to preserve that capacity by defining who may transmit, where, when, and under what technical conditions. Those legal rules create a second form of scarcity.

Before a radio service may operate in the United States, it generally needs authorization from either the FCC or the National Telecommunications and Information Administration (NTIA). The FCC oversees nonfederal uses, while NTIA manages spectrum used by federal agencies. Depending on the service, the FCC may issue an individual license or permit unlicensed operation under technical rules that apply within designated bands.[11]

A license gives its holder the legal right to transmit on specified frequencies, in specified locations, and subject to stated conditions. Band plans divide larger frequency ranges into channels and establish how many licenses may be issued. Because those rights are limited, several applicants may seek the same authorization. The FCC initially relied on first-come, first-served assignments and later used comparative hearings when applicants competed for the same license.[12]

The FCC and NTIA manage spectrum by separating users across frequency, geography, time, or some combination of the three.[13] Clear operating rights and technical limits can reduce harmful interference and allow more systems to function at once. Those limits can also restrict performance. Some applications therefore require several channels or exclusive rights within a band to obtain sufficient capacity and reliability.

Regulators must also distinguish harmful interference from ordinary increases in background noise. A new entrant should not lose access merely because its operations add some interference. The relevant question is whether that interference prevents another authorized service from functioning as intended.

Legal and technical scarcity together define each operator’s bundle of rights and restrictions. Those rules aim to provide enough bandwidth and protection from interference for the service to work. Because many users seek the same rights, allocating licenses and bands has become increasingly difficult and politically contentious.

For most operators, the legal authorization to transmit is the scarce input that matters most. Any proposal to reassign frequencies or revise the rights attached to a license can change the value and viability of existing systems. That is why even narrow technical proceedings before the FCC and NTIA often produce fierce disputes.

C. Spectrum Rights as an Economic Input

Access to spectrum is an indispensable input for any radio operation. Unlike many production inputs, spectrum rights cannot be replaced, manufactured, or avoided. A manufacturer that cannot obtain a particular mineral may redesign a product around another material. A logistics company facing a fuel shortage may reroute shipments or use another mode of transportation. A radio operator without legal authority to transmit cannot operate.

This lack of substitutes gives spectrum rights a distinctive economic character. In most markets, scarcity raises prices, which encourages conservation, increased production, or the development of alternatives. Higher license prices cannot create additional frequencies. Engineering can increase the amount of information carried over a band or allow more users to share it, but those gains remain subject to physical limits.

Dynamic spectrum sharing, improved interference mitigation, denser networks, and more advanced modulation can increase the productive use of existing frequencies. These techniques allow communications systems to approach the capacity limit described by Shannon’s law. They do not eliminate that limit.

The value of spectrum rights also varies sharply across users and applications. A license or unlicensed-access framework defines a bundle of rights and restrictions, but its economic value depends on the service involved, the capacity the operator can use, and the revenue or operational benefit that capacity can produce.

For a commercial mobile carrier, spectrum is a core input into a network serving millions of subscribers. A license’s value may depend on the population within the licensed area, expected data demand, the band’s technical characteristics, and the competitive consequences of allowing a rival to acquire it. The high prices paid in FCC auctions reflect carriers’ assessments of the long-term commercial value of those rights.[14] Nationwide mobile carriers have historically dominated such auctions, but cable companies, fixed-wireless providers, and other network operators also treat spectrum as one component of broader capital investment in communications infrastructure.

Other users value spectrum differently. A television broadcaster may care most about a signal’s geographic reach and the advertising revenue associated with that audience.[15] A federal agency operating radar, military communications, or scientific instruments may measure value through mission performance rather than revenue. Traditional market measures offer only a partial account of those uses.

Unlicensed spectrum presents another valuation problem. Wi-Fi routers, Bluetooth devices, industrial sensors, and other connected technologies rely on access that no single firm owns. Businesses, cable operators, universities, hospitals, manufacturers, municipalities, and households invest heavily in equipment and networks that use those frequencies. No auction bid captures the full value of that activity because the benefits are dispersed across billions of devices and transactions.[16]

These different uses complicate efforts to allocate spectrum efficiently. Competitive auctions generally provide the best mechanism for discovering value when a limited number of operators seek exclusive licenses. Bids reveal how much firms expect to earn from the rights offered and direct licenses toward users willing to pay the most.[17]

Auction prices do not, however, capture every form of economic or public value. Users that generate direct revenue can usually express their demand through a bid more readily than users whose benefits are indirect, diffuse, or tied to public missions. A mobile carrier can estimate subscriber revenue. A weather satellite, military radar, hospital network, or open Wi-Fi system may create substantial value that never appears on a licensee’s balance sheet.

Spectrum policy should seek to maximize the value created by an allocation and assignment, rather than auction receipts alone. In some cases, that goal will support an auction for exclusive licenses. In others, it may favor unlicensed access, shared use, or a private transaction that places frequencies into service more quickly.[18]

Regulators therefore face a recurring institutional choice. Markets can reveal which parties place the highest monetary value on defined rights. But government agencies must still define those rights, address uses whose benefits are difficult to monetize, and decide when exclusive licensing, sharing, or unlicensed access will produce the greatest value.

III. How Spectrum Rights Are Allocated and Reallocated

Radio operating rights are indispensable inputs for wireless services, making their allocation and assignment among the most consequential decisions in spectrum management. The quality, certainty, and flexibility of those rights shape whether firms will invest in networks and devices capable of supporting artificial intelligence, augmented reality, virtual reality, and other data-intensive applications.

The current system divides authority between the FCC and the NTIA, whose differing mandates can slow reallocation and create uncertainty. Within bands under FCC control, regulators must choose among exclusive licenses, unlicensed access, and dynamic-sharing arrangements, each of which offers different levels of interference protection, flexibility, and investment certainty. Secondary markets can later move licensed rights toward more productive uses, though transaction costs and limits on federal participation constrain their reach.

A. Divided Authority and Regulatory Delay

The United States is unusual among major economies in dividing spectrum-management authority between two federal agencies with different mandates and constituencies.[19] The Federal Communications Commission (FCC) governs nonfederal radio operations. Its authority traces to the Federal Radio Commission, which Congress created in response to disorder in early radio broadcasting.[20] Congress directed the FCC to regulate radio communications in the public interest, a mandate that has often pushed the agency toward productive use, flexible allocation, and market-based assignment.[21]

The National Telecommunications and Information Administration (NTIA) manages spectrum used by federal agencies. Its role grew out of the Interdepartment Radio Advisory Committee (IRAC), a cooperative body that agencies formed before Congress created a formal regulatory system for civilian users.[22] NTIA also seeks efficient spectrum use, but its institutional structure gives incumbent agencies substantial influence over decisions affecting their operations. Its approach therefore tends to place greater weight on protecting federal systems from harmful interference, though priorities vary by administration.[23]

The FCC and NTIA must make joint decisions about a shared resource, even though their institutional incentives often diverge. Neither agency has final authority over every decision modern spectrum management requires. The FCC can regulate nonfederal operators and reallocate bands occupied solely by commercial users. It cannot compel a federal agency to relocate, nor can it determine whether a federal assignment remains necessary without NTIA’s cooperation.

NTIA can use presidential authority over the executive branch to direct agencies to relinquish or share spectrum. In practice, the IRAC gives incumbent agencies considerable influence, and aggressive action depends heavily on White House direction. The resulting structure lacks a clear final arbiter.

That uncertainty carries economic costs. Delays reduce the value of spectrum rights by postponing deployment and revenue.[24] Auction bidders and equipment manufacturers also need confidence that allocation decisions will remain settled. When later challenges may reopen those decisions, firms have less reason to invest in networks, devices, and services tied to the affected bands.

The consequences become clearest during spectrum reallocation. The 3.1-3.55 GHz band supported federal defense radar systems, and the FCC could not repurpose those frequencies without agreement from the Department of Defense (DOD) and NTIA.[25] Congress ultimately directed further study and sharing through the MOBILE NOW Act.[26] Without that mandate, even the limited arrangement covering the upper 100 MHz of the band might not have emerged because the DOD had little institutional reason to surrender access voluntarily.

The 24 GHz proceeding showed how neighboring federal operations can create uncertainty even when no federal incumbent occupies the band itself.[27] The National Oceanic and Atmospheric Administration (NOAA) raised interference objections late in the process, after auction planning was underway. The agency appeared to bypass the established IRAC process and took its concerns directly to Congress and the public. That dispute weakened confidence that the FCC’s allocation decision was final and threatened to reduce the licenses’ value.

The 5.9 GHz proceeding revealed a related problem. An agency with no operating rights in or adjacent to the band, but with a strong programmatic interest in its use, exerted substantial pressure to reopen FCC decisions.[28] These episodes show how divided authority allows federal and other incumbent interests to resist reallocation, prolong proceedings, and reduce the value of spectrum rights even after the technical record supports a change.

Successful spectrum management therefore depends on close coordination between the FCC and NTIA, backed by clear White House direction. The next generation of wireless applications will require faster decisions involving difficult technical and economic tradeoffs. An administration that seeks continued U.S. leadership in wireless technology must align the agencies around common priorities, shared technical standards, and a consistent account of the national interest. Without that coordination, the federal government will spend too much time reopening old disputes while new technologies wait for access.

B. Licensed, Unlicensed, and Secondary-Market Access

Even when a band falls entirely under FCC control, allocating access presents difficult choices. The FCC uses two primary models. It may grant licenses to individual operators, or it may permit unlicensed operation under generally applicable technical rules.

A license defines an operator’s rights and restrictions. These may include the frequencies, power levels, geographic areas, and times in which the licensee may transmit. The precise terms depend on the band plan, the service involved, and neighboring operations.[29]

Many licenses provide exclusive access to a frequency range and protection against harmful interference. Those rights give operators greater confidence that later entrants will not jeopardize investments in networks and equipment. Other licenses grant several operators similar or overlapping rights, particularly in bands used for satellite services.[30]

Licensing can also support sharing across time or geography. The 3.5 GHz Citizens Broadband Radio Service (CBRS) band, for example, gives naval radar systems priority access while allowing Priority Access Licensees to operate when they will not interfere with those federal systems.[31]

The FCC’s second model permits unlicensed operation. Unlicensed bands initially offered inventors a low-cost way to develop and test devices without obtaining an individual license.[32] Consumers encounter this model through Wi-Fi routers, Bluetooth headphones, and other devices that create short-range personal or local networks.

Requiring every consumer to obtain FCC approval before setting up a home network would make those technologies commercially impractical. Device manufacturers instead design products to comply with the FCC’s Part 15 rules and obtain equipment authorization. Consumers may then operate approved devices in designated unlicensed bands without further agency permission.[33]

Unlicensed access supports a large share of internet traffic, much of which travels over Wi-Fi.[34] Part 15 imposes power and technical limits intended to accommodate many nearby users. Unlicensed devices must also accept interference from other lawful operations. A user generally has no regulatory remedy when a neighboring device causes interference while complying with FCC rules.

Licensed and unlicensed access serve different purposes. A license offers greater certainty, stronger interference protection, and often higher permitted power. Those features support wide-area networks (WANs) and reduce some of the risks associated with capital-intensive broadband deployment.

Unlicensed access works best for localized uses that can tolerate variable interference conditions. In a large apartment building, residents can establish separate wireless networks without seeking individual licenses and usually without causing harmful interference to their neighbors. Part 15 also allows firms to develop and deploy short-range communications for internet-of-things devices without the cost and delay of securing operating licenses.

These two models allocate initial operating rights, but only licenses generally create transferable rights. An unlicensed user has no individual property-like interest to sell or assign. A licensee, by contrast, may transfer all or part of its authorization to another party, subject to FCC rules and approval.

Secondary-market transactions can move spectrum rights toward users that value them more highly, but transaction costs often impede those deals. A licensee may need to divide a geographic license into smaller areas, separate frequencies within a band, negotiate operating protections, and obtain FCC consent. Recent policy changes have reduced some of these costs, but they have not removed them.[35] Secondary markets remain a viable yet underused means of reallocating spectrum rights.

C. Dynamic Spectrum Sharing

“Spectrum sharing” has become a prominent theme in recent policy debates, but the term can obscure more than it clarifies. Every spectrum allocation involves sharing. The FCC defines how users divide access across frequency, geography, and time.

An exclusive license is one form of sharing. It gives one operator priority rights within a defined frequency range and geographic area while requiring others to operate in adjacent channels, different locations, or at different times. A mobile carrier that wins a C-band license receives priority within its licensed area, but it still shares the broader band with neighboring licensees and other services. Users within the carrier’s network also share the same frequencies through network coordination.

Unlicensed systems rely on a different arrangement. Many short-range networks may operate on the same frequencies at the same time because their limited power and geographic reach allow nearby users to coexist. FCC technical rules govern how those devices share access without granting any one user priority rights.

Current policy debates often use “spectrum sharing” to describe a narrower model. Dynamic sharing uses technical and regulatory systems to permit multiple users to access the same frequencies in the same area, sometimes at nearly the same time. Rather than assigning static rights years in advance, these systems coordinate access as operating conditions change.[36]

Dynamic sharing has attracted more attention as regulators face fewer bands that can be cleared for exclusive commercial licenses. The 3.5 GHz CBRS band offers the most ambitious U.S. example. CBRS uses a three-tier hierarchy that assigns priority among several classes of users operating within the same frequencies.[37]

Federal incumbents, primarily naval radar systems along the coasts, occupy the highest tier. Their operations receive the strongest protection and may preempt lower-tier users when necessary. Priority Access Licensees occupy the second tier. They obtain geographically defined rights to specific channels and receive protection from other nonfederal users, but they must yield when incumbent federal systems need access.

General Authorized Access users occupy the third tier. They may operate without an individual license when federal incumbents and Priority Access Licensees are not using the relevant frequencies in the area. This structure incorporates unlicensed access into a coordinated sharing system rather than treating it as a residual use.

An automated frequency coordinator known as the Spectrum Access System (SAS) manages these priorities. The cloud-based system tracks incumbent activity, assigns channels, revokes access when higher-priority users need the band, and manages interference among the three tiers.[38] It translates the FCC’s regulatory hierarchy into operating decisions that respond to current conditions rather than relying entirely on a fixed band plan.

CBRS shows that dynamic sharing can accommodate changing demand while giving commercial operators some basis for investment. It also exposes the model’s costs. Priority Access Licensees face greater uncertainty than holders of traditional exclusive licenses because they may lose access when federal incumbents return. The system’s geographic and technical complexity may also exceed the capabilities of some operators.[39]

Those constraints may limit the services that shared bands can support. Applications involving artificial intelligence, augmented reality, or virtual reality may require consistent capacity and low latency. A licensee that must vacate a channel on short notice may struggle to provide that quality of service.

Dynamic sharing nevertheless expands the available set of allocation tools. Spectrum management need not rely exclusively on either traditional licenses or unlicensed access. Regulators can design sharing systems around the technical characteristics, incumbent uses, and commercial demands of a particular band.

The next challenge is to determine where dynamic coordination can improve spectrum use without creating unacceptable uncertainty. That question will grow more difficult as terrestrial, satellite, and airborne systems increasingly seek access to the same frequencies. Future sharing frameworks must provide clear priority rules, reliable coordination, and enough operating certainty to support investment.

D. Secondary Markets for Spectrum Rights

Operators may also sell or lease spectrum rights, either in full or in part. Secondary markets allow licensees to exchange those rights after the initial assignment without requiring the FCC to conduct a new allocation proceeding whenever market conditions change.[40]

The economic case for secondary markets is straightforward. The value of spectrum rights varies among users and over time. One licensee may lack the infrastructure, customers, or business model needed to use a license productively, while another could generate greater value from the same rights. A voluntary transaction can benefit both parties and move spectrum toward a more productive use with limited regulatory involvement.

The FCC embraced this logic in the early 2000s by establishing a framework for license transfers and leases. A licensee may assign an entire license to another holder, partition it by selling rights in part of the geographic service area, or disaggregate it by transferring part of the assigned frequency range. A licensee may also lease some or all of its operating rights while retaining the underlying license.[41]

Together, these mechanisms support a wide range of commercial arrangements. They allow parties to transfer only the rights relevant to a transaction rather than requiring the FCC to auction a newly configured license.

Secondary-market transactions have helped carriers assemble large, contiguous blocks of spectrum suitable for nationwide 5G networks. National carriers have acquired licenses from regional operators, cable companies, and other holders that could not use the rights as intensively.[42] The C-band reallocation also incorporated market mechanisms that allowed satellite operators to negotiate relocation terms and share in some of the value created by clearing the band for flexible use.[43]

Secondary markets support other arrangements as well, including private enterprise networks, utility communications, fixed-wireless services, neutral-host systems, and mobile services offered by cable companies or mobile virtual-network operators (MVNOs). Most transactions have involved permanent transfers or longer-term leases. More advanced automated coordination could eventually permit licensees to sell unused capacity for shorter periods, allowing another operator to access the band under privately negotiated terms.[44]

Secondary markets remain an incomplete substitute for FCC action. Spectrum transfers can involve substantial transaction costs, including negotiations over geography, frequency, interference protection, and agency approval. Concerns about spectrum warehousing also persist when licensees retain underused rights in anticipation of future gains rather than deploying service.[45]

Secondary markets offer even less help with underused federal spectrum. Federal agencies generally cannot sell or lease their assignments for direct financial benefit. Moving those frequencies toward higher-valued uses still requires political direction, interagency coordination, and formal reallocation.

IV. Spectrum for AI, AR, and VR Applications

Artificial intelligence (AI), augmented reality (AR), and virtual reality (VR) will all increase wireless demand, but they impose different technical requirements. AR and VR need sustained capacity, low latency, and reliable connections. AI generates additional traffic, including greater upload demand, while also offering tools to improve spectrum coordination and sharing.

No single frequency band or access model can satisfy all of these needs. Lower frequencies provide coverage, mid-band frequencies balance reach and capacity, and higher frequencies support dense, short-range connections. Licensed, unlicensed, and shared-access regimes each serve different applications. Satellite networks add another layer by extending coverage and backhaul beyond terrestrial systems. Spectrum policy must combine these bands, access models, and network layers into a coherent strategy that supports both investment and experimentation.

A. A Layered Spectrum Strategy

No single frequency band can meet every wireless-network requirement. Lower frequencies travel farther and penetrate buildings more effectively, while higher frequencies can support wider channels and greater capacity over shorter distances. Coverage, capacity, propagation, and reliability therefore involve unavoidable tradeoffs.

The next generation of wireless applications will require a layered spectrum strategy. Different frequency ranges must supply different capabilities within an integrated network, and each layer needs operating rights, interference protection, and regulatory certainty suited to its role.

1.        Low Band Below 1 GHz

Low-band frequencies travel long distances and penetrate buildings well, but their relatively narrow channels limit data capacity. They are poorly suited to immersive media and other data-intensive applications. They remain valuable for widespread, low-rate connectivity supporting distributed artificial intelligence (AI) and internet-of-things devices.

Low band works especially well when most processing occurs on the device and the application needs only a persistent connection. Its propagation characteristics allow users to maintain basic connectivity across large geographic areas and inside buildings.

2.        Lower Mid-Band at Roughly 1–6 GHz

Lower mid-band spectrum is central to current 5G deployments because it balances capacity and coverage. Reallocating it can be difficult, however, because many bands already support federal and commercial incumbents.

The lower 3 GHz band at 3.1–3.45 GHz, the 3.5 GHz CBRS band, and the C-band at 3.7–4.2 GHz can support wide-area mobile augmented reality (AR) and cloud-rendered virtual reality (VR).[46] Signals in these ranges travel far enough to serve suburban and exurban areas without the dense small-cell networks required at higher frequencies. They also penetrate buildings well enough to provide indoor service without always requiring a separate indoor network.

These bands can accommodate channels wide enough to support cloud-rendered AR, AI inference, and other data-intensive applications used by pedestrians, drivers, and workers on industrial floors.

3.        The 6 GHz Unlicensed Band at 5.925–7.125 GHz

The 6 GHz band provides 1,200 MHz of unlicensed spectrum and supports Wi-Fi 6E and Wi-Fi 7. It will play a major role in AR, VR, and many consumer-facing AI applications.

Regulators first authorized low-power indoor devices and very-low-power portable operations in the band. They later added higher-power, geofenced device categories aimed at AR and VR headsets, wearables, and similar products used indoors and outdoors.[47]

Most immersive applications operate indoors and across short distances. Those conditions make 6 GHz a natural fit for a substantial share of AR and VR traffic.

4.        Upper Mid-Band at Roughly 7–15 GHz

Upper mid-band frequencies offer wide channels without the severe range limits associated with millimeter wave. The 7.125–8.4 GHz segment, for example, can provide large contiguous blocks of spectrum while retaining propagation characteristics suitable for some wide-area coverage.

Standards organizations and industry groups have identified several extended mid-band ranges as candidates for future wireless use, including 7.125–8.5 GHz, 10.7–13.25 GHz, and 14–15.35 GHz.[48] North American studies have modeled extended-reality and other high-demand applications in the 3.1–3.45 GHz, 7.125–8.5 GHz, and 12.7–13.25 GHz bands.[49]

The shorter propagation range of upper mid-band frequencies may also make some portions suitable for unlicensed operation. Their principal advantage is the ability to support wide channels for extended reality without imposing the coverage limitations of millimeter wave.

5.        Millimeter Wave at Roughly 24–47 GHz

Millimeter-wave bands provide enormous capacity over short distances. They are well suited to dense environments such as venues, campuses, factories, and indoor networks, where fixed or tethered AR and VR systems can use very wide channels.[50]

These frequencies travel shorter distances and are easily blocked by walls, foliage, and other obstacles. They therefore complement mid-band coverage rather than replace it. As networks become denser and equipment improves, millimeter wave will likely assume a larger role in high-capacity wireless infrastructure.

6.        Sub-Terahertz and Terahertz Bands Above Roughly 100 GHz

Researchers are studying frequencies around 100–140 GHz and 275–325 GHz for use in the 2030s and beyond. These bands could eventually support terabit-per-second capacity for holographic communications, digital twins, and the most demanding extended-reality applications.[51]

Severe signal loss, strict line-of-sight requirements, and immature hardware will constrain these frequencies for the foreseeable future. Their most likely early uses involve short-range indoor communications and sensing. Mid-band frequencies will continue to carry most wide-area traffic.

B. Matching Allocation Models to Emerging Technologies

Making additional bands available for commercial use solves only part of the problem. The FCC must also decide whether to assign those bands through exclusive licenses, unlicensed access, or dynamic sharing. AI, AR, and VR depend on different combinations of coverage, capacity, reliability, and ease of access, so the choice among these models can shape which applications develop.

Exclusive licenses give operators defined rights to exclude other users, protect against harmful interference, and operate at higher power. That certainty supports the large investments required to build wide-area networks. Auctions can also generate substantial public revenue. Exclusive rights may limit entry, though, and can leave capacity underused when licensees do not fully employ their assigned frequencies.

Unlicensed bands take a different approach. Any device that complies with the FCC’s technical rules may operate without an individual license. The benefits extend across Wi-Fi, Bluetooth, and other short-range technologies, making them difficult to capture through a single auction bid or license valuation. Estimates credit unlicensed spectrum with generating trillions of dollars in annual economic value.

Dynamic-sharing systems occupy the middle ground. The 3.5 GHz CBRS band uses a three-tier coordination system that permits commercial users to operate when incumbent federal radar systems do not need the frequencies. Automated sensing and database tools manage access and enforce priority rights.

These allocation models support different uses. Indoor, tethered, and short-range immersive applications align closely with unlicensed spectrum, particularly the 6 GHz band. Outdoor and mobile AR applications, including heads-up navigation and mobile mixed reality, depend more heavily on the coverage and quality-of-service protections available through licensed mid-band networks.

AI applications use both. Latency-sensitive edge inference may rely on licensed networks when mobility and reliability matter. Large model updates, data synchronization, and stationary applications can shift substantial traffic to unlicensed networks. No single allocation model can support the full range of immersive and AI-enabled services.

The One Big Beautiful Bill Act, signed in July 2025, restored the FCC’s general spectrum-auction authority after it expired in March 2023. The law directed the federal government to identify at least 800 MHz within the 1.3–10.5 GHz range for auction and required an auction of upper C-band spectrum.[52]

Congress excluded the heavily contested 3.1–3.45 GHz and 7.4–8.4 GHz federal bands from that mandate. It did not provide similar statutory protection for the 5.925–7.125 GHz unlicensed band or CBRS. That omission prompted concern among Wi-Fi and shared-access advocates that frequencies supporting AR, VR, and edge-AI applications could later be converted to exclusive licensed use.[53] The Trump administration has continued to support preserving the full 6 GHz band for Wi-Fi.[54]

The spectrum needs of AI, AR, and VR therefore call for a layered portfolio of both frequency bands and access models. Licensed mid-band spectrum supplies wide-area coverage and predictable service. The 6 GHz unlicensed band and millimeter-wave frequencies provide dense, short-range capacity for many immersive applications. Dynamic sharing can expand access where full clearing or exclusive licensing would prove impractical.

The allocation balance matters as much as the amount of spectrum available. A policy that favors exclusive licensing too heavily could sacrifice the dispersed benefits of Wi-Fi and shared systems. A policy that relies too heavily on unlicensed or shared access could weaken the certainty needed for large network investments and applications requiring guaranteed service. The FCC should preserve a deliberate mix of licensed, unlicensed, and shared access suited to the technical demands of each band and application.

C. Satellite Networks as a Third Connectivity Layer

A full account of spectrum demand must include low-Earth-orbit (LEO) satellite constellations, which are becoming a third connectivity layer alongside fixed and mobile networks. Systems such as Starlink and Project Kuiper operate roughly 300 to 2,000 kilometers above Earth, far below geostationary satellites at about 36,000 kilometers.[55] Their lower altitude reduces latency, often to less than 100 milliseconds, which can support many interactive applications.[56]

Connectivity-focused LEO systems rely primarily on the Ku band at 12–18 GHz for user-terminal links and the Ka band at 26.5–40 GHz for gateway and feeder links. Higher-capacity Q/V bands at 37.5–51 GHz are emerging for next-generation feeder links, though they are more vulnerable to signal loss.[57] Optical intersatellite links can also carry traffic between satellites, reducing pressure on radio frequencies and avoiding some ground-based routing delays.

These systems operate through coordinated, licensed allocations governed internationally by the International Telecommunication Union’s (ITU) nongeostationary fixed-satellite-service framework. Regulators do not generally assign these frequencies through national auctions. Instead, they establish interference limits and coordination rules that allow multiple constellations to use the same bands.[58]

Direct-to-device connectivity and Supplemental Coverage from Space are developing even faster. Rather than relying only on dedicated satellite bands and specialized terminals, these services allow ordinary mobile devices to connect directly to satellites when no terrestrial cell site is available. They may use terrestrial mobile frequencies or L- and S-band mobile-satellite-service spectrum. Since the FCC adopted an initial regulatory framework in 2024, the model has entered commercial service and prompted multibillion-dollar transactions involving mobile-satellite spectrum.[59]

For AI, AR, and VR, LEO service will complement terrestrial networks rather than replace them. Its clearest role is extending coverage to rural, maritime, aviation, and disaster-affected areas where fiber and dense cellular networks are unavailable. It can also provide resilient backhaul to terrestrial edge nodes that perform AI inference and cache content closer to users.

Latency will limit the most demanding immersive applications. A LEO round trip of roughly 20 to 50 milliseconds can support cloud-rendered or social VR, video, telemetry, AI inference, and model synchronization. It remains too slow for tightly coupled AR and VR experiences that require motion-to-photon latency below about 15 milliseconds. Those applications will continue to depend on on-device processing or nearby terrestrial edge infrastructure.[60]

Direct-to-device service may reach lightweight AR wearables and always-on AI assistants sooner. It could support off-grid notifications, positioning, and low-rate queries well before it can deliver full immersive video.

Satellite spectrum presents management problems that differ from those affecting terrestrial networks. Terrestrial licenses often divide frequencies into exclusive blocks. Satellite systems instead depend on coordination among operators.[61]

ITU rules assign priority largely by filing date. In the United States, the FCC uses processing rounds that give earlier-authorized systems priority over later applicants. A later system must coordinate with earlier constellations or comply with default protection standards.[62]

Equivalent power-flux-density (EPFD) limits add another constraint. These rules cap the combined power that nongeostationary systems may direct toward geostationary satellites, even when no particular geostationary link faces a demonstrated threat. The limits can restrict how many satellites a constellation may direct toward one area and reduce total network capacity.[63]

In 2026, the FCC moved toward a performance-based framework for important Ku- and Ka-band frequencies. The new approach relies on a default 3% throughput-degradation threshold and good-faith bilateral coordination. The agency also granted interim waivers to leading constellations before finalizing the rules.[64]

Coordination still depends heavily on negotiation among operators. As more constellations enter service and orbital density rises, the number of overlapping systems and potential interference relationships grows quickly. U.S. rules are also moving ahead of the international framework, which continues to rely on EPFD limits.

The priority system favors incumbents. Earlier filings receive stronger protection, which rewards operators that apply and deploy first. It also encourages speculative filings because an operator can secure priority before putting spectrum to productive use.

Deployment milestones seek to limit that behavior by requiring operators to launch a specified share of an authorized constellation within fixed periods. Those requirements also raise the capital needed to enter the market and may favor well-financed incumbents over smaller or later challengers.

Rules designed to prevent interference can therefore restrict entry when they grant durable advantages to early filers or impose high upfront deployment costs. Satellite policy faces the same basic tradeoff as terrestrial spectrum policy. Regulators must protect existing operations without allowing coordination rules to preserve underused rights or exclude more productive entrants.

D. AI as Both Spectrum User and Management Tool

Artificial intelligence complicates the usual choice among licensed, unlicensed, and shared access because it affects both spectrum demand and spectrum management. Generative-AI and edge-AI applications can produce substantial bursts of traffic across mid- and upper-mid-band frequencies. They may also require far more upload capacity than current consumer applications, placing pressure on networks designed primarily for downloads.

AI may also help networks use existing frequencies more efficiently. Machine-learning systems can identify unused capacity, predict interference conditions, and adjust channel access in real time. These tools could allow secondary users to operate without causing harmful interference to incumbents.

Research on reinforcement learning and hybrid optimization for 6G cognitive-radio networks reports gains in spectral efficiency and reductions in interference.[65] If these methods mature and regulators accept them, spectrum policy will increasingly focus on how efficiently users can share a band, alongside decisions about whether to license it exclusively or permit unlicensed access.

AI therefore occupies an unusual role. It increases demand for wireless capacity while offering tools that may ease some of the resulting congestion. Its contribution to dynamic coordination could become especially valuable as immersive applications place greater demands on scarce frequencies.

V. A Spectrum Policy Agenda for Emerging Technologies

Realizing the benefits of artificial intelligence, augmented reality, and virtual reality will require more than adding spectrum to a federal pipeline. Policymakers must preserve a balanced mix of licensed, unlicensed, and shared access, move underused federal bands into commercial use, improve coordination between the FCC and the NTIA, and replace reflexive worst-case interference analysis with risk-informed methods.

The United States must also engage more coherently in international spectrum policy. Decisions made through the International Telecommunication Union and the World Radiocommunication Conference shape global equipment markets, national-security interests, and competition with China. Each band presents distinct technical and economic questions, but these principles should guide the broader policy agenda.

A. Preserve a Balanced Mix of Access Models

AI, AR, and VR rely on different wireless capabilities at different times. Regulators should therefore preserve a mix of frequency bands and access models rather than favoring one regime across the board.

Exclusive licenses support high-powered, wide-area networks and provide the interference protection needed for capital-intensive deployment. Those features matter for mobile AR and latency-sensitive AI inference. Unlicensed spectrum supplies low-cost, permissionless capacity for indoor and short-range immersive applications, as well as AI workloads that generate substantial traffic in both directions. Dynamically shared bands can accommodate incumbents while opening additional capacity to commercial users. Each model serves a distinct purpose.

The political process does not value these benefits evenly. Auctions produce large, visible, and immediate federal revenue. The gains from unlicensed and shared spectrum appear more diffusely through consumer surplus, lower entry barriers, and new devices and services. They are also harder to estimate in advance.[66] When Congress uses auction receipts to offset federal spending, that asymmetry creates pressure to convert more bands to exclusive licenses.

That pressure bears directly on the 6 GHz unlicensed band and the 3.5 GHz CBRS framework. Both support immersive and edge-computing applications, yet both remain exposed to proposals for licensed reallocation.

An excessive tilt toward unlicensed or shared use would create different costs. Without enough exclusive-use spectrum and reliable interference protection, operators may lack the certainty needed to invest billions of dollars in wide-area networks.[67] Mobile immersive services cannot become widely available without that infrastructure.

Allocation decisions should therefore account for consumer welfare and total economic value rather than auction revenue alone. Regulators should compare the full benefits and costs of exclusive licensing, unlicensed access, and dynamic sharing in each band.

The same approach should govern satellite and direct-to-device systems. Rules for nonterrestrial networks should promote competition and economic value while ensuring that the satellite layer complements terrestrial networks rather than dividing spectrum policy into separate and inconsistent regimes.

B. Reform Federal Spectrum Reallocation

Much of the prime mid-band spectrum needed for AI, AR, and VR remains assigned to federal users, especially the Department of Defense (DOD). Reallocating those frequencies for commercial use requires coordination between the NTIA and the FCC. The One Big Beautiful Bill Act was designed to accelerate that process, but its structure shows why federal reallocation remains the weakest part of the spectrum pipeline. If that process stalls, pressure may shift toward nonfederal bands.

The law’s 800 MHz pipeline draws on two sources.[68] It directs NTIA to identify at least 500 MHz of federal spectrum between 1.3 and 10.5 GHz, while excluding the 3.1–3.45 GHz and 7.4–8.4 GHz bands reserved for the DOD. NTIA must identify at least 200 MHz within two years, with FCC auctions scheduled on staggered deadlines extending into the early 2030s.

The remaining 300 MHz must come from nonfederal spectrum under FCC control. That tranche includes a requirement to auction at least 100 MHz of upper C-band spectrum between 3.98 and 4.2 GHz.

The statute does not require the auction of any particular federal band. It establishes a total target and directs NTIA to identify qualifying frequencies that the FCC must later auction. Meeting the federal target therefore depends on identifying suitable bands and relocating or accommodating incumbent systems.

That process requires cooperation from the agencies using those frequencies. Clearing a federal band may require moving systems into adjacent frequencies, modifying military equipment, or redesigning operations. The executive branch can direct NTIA to pursue relocation, but it cannot easily dismiss operational and national-security objections from agencies that must move.

If the DOD refuses to accommodate a relocation, NTIA may struggle to identify the full 500 MHz. A statutory target cannot make frequencies available when the responsible agency will not relinquish them. Congress’s exclusion of the lower 3 GHz and 7.4–8.4 GHz bands illustrates the problem.[69] Those exemptions responded to legitimate defense concerns, but similar objections may arise as NTIA examines other bands.

The FCC can deliver only the 300 MHz drawn from nonfederal spectrum without relying on another agency. If the federal portion proves difficult to clear, auction deadlines, projected revenue, and political pressure may encourage the FCC to draw more heavily on bands within its own jurisdiction.

That pressure could fall on frequencies already supporting immersive and edge-AI applications, including the 3.55–3.7 GHz CBRS band and the 5.925–7.125 GHz unlicensed band. Congress declined to protect either band in the final legislation. A process intended to reclaim underused federal spectrum could therefore consume commercial, shared, or unlicensed spectrum when federal incumbents resist.

Durable reallocation requires federal-agency cooperation, adequate funding for relocation, and clear White House direction. Regulators must also reduce the procedural barriers that delay transitions once agencies agree to move.

Congress created the Spectrum Relocation Fund (SRF) through the Commercial Spectrum Enhancement Act of 2004 to reimburse federal agencies for relocation costs.[70] The fund directs a portion of auction proceeds toward expenses associated with moving federal systems. It was meant to remove a recurring obstacle by ensuring that agencies would not resist reallocation merely because their budgets could not absorb the cost.

The fund has not operated smoothly.[71] Before receiving money even to study whether relocation is feasible, an agency must prepare a detailed pipeline plan, obtain review from the Technical Panel, secure approval from the director of the Office of Management and Budget, and complete a mandatory congressional-notification period. These requirements can delay the preliminary studies needed to determine whether a band can be cleared or shared.[72]

The Trump administration has taken steps to improve the process, but several of its most burdensome requirements, including the 60-day congressional-notification period, are statutory. Administrative reforms alone cannot remove them.[73]

Congress should streamline the review and notification process while preserving meaningful oversight. Faster access to relocation funding would allow NTIA to study bands sooner, shorten auction timelines, increase license values by giving bidders greater certainty, and bring additional mid-band spectrum into commercial use more quickly.

C. Strengthen FCC-NTIA Coordination

The aviation-altimeter dispute surrounding the lower C-band exposed serious weaknesses in coordination between the FCC and the NTIA. The Biden administration responded with several reforms. In February 2022, the agencies launched a Spectrum Coordination Initiative. Six months later, they signed an updated memorandum of understanding, the first revision in nearly two decades.[74]

The agreement formalized coordination at both the leadership and staff levels. It required the FCC chair and NTIA administrator to meet at least quarterly and their staffs to meet monthly. It also created procedures for sharing plans up to a year in advance and extended the notice period for proposals that could cause interference from 15 to 20 business days. These measures sought to identify conflicts early rather than allow them to erupt near the end of a proceeding.

The 2023 National Spectrum Strategy and its 2024 implementation plan expanded that effort. They called for longer-term interagency planning, peer-reviewed models for evaluating reallocation and coexistence, and a pipeline of bands for detailed study. They also proposed a national testbed for dynamic spectrum sharing, including the use of artificial intelligence to support real-time coordination.[75]

Coordination remains difficult, and further improvement will be necessary to carry out the One Big Beautiful Bill Act. When a band can be cleared, effective planning determines whether federal systems relocate on time and at a reasonable cost. When clearing is impractical, commercial access may depend on dynamic sharing. That approach works only when the FCC, NTIA, and incumbent agencies jointly develop, test, and trust the technical framework.

Both reallocation and sharing depend on durable cooperation grounded in a common technical record. The FCC and NTIA should continue refining their procedures, disclose concerns early, and resolve disputes before agencies and private firms commit substantial resources. Without that discipline, the new statutory pipeline may reproduce the delays and uncertainty that the coordination reforms were designed to prevent.

D. Adopt Risk-Informed Interference Analysis

Every spectrum reallocation and sharing arrangement depends on a threshold question. How much harmful interference would a proposed use cause to incumbents operating in or near the band? The method used to answer that question often determines whether regulators permit new entry at all.

For decades, agencies have relied heavily on deterministic, worst-case analysis.[76] This method assumes that transmitters operate at maximum power, at the least favorable distance and geometry, under the most adverse propagation conditions, and at the same time. Such caution imposed little cost when spectrum was lightly used. In today’s congested bands, it can block entry or impose severe operating restrictions even when the probability of harm is remote.

Worst-case analysis treats every conceivable event as equally relevant, regardless of likelihood. A harmful-interference scenario may require several unlikely conditions to occur simultaneously, including peak power, minimum separation, and unusually adverse propagation. Evaluating only the most severe possible outcome systematically overstates risk and gives incumbents a potent means of resisting new services. An alarming hypothetical can derail entry even when expected harm is negligible.

Risk-informed interference assessment asks a broader set of questions.[77] What harmful events could occur? How likely are they? What consequences would follow? Aviation, nuclear, and environmental regulators have used quantitative risk assessment for decades to evaluate hazards whose probabilities and consequences vary.

The process generally has four steps:

  1. Identify significant interference hazards.
  2. Define a measure for the consequences of each hazard.
  3. Estimate each hazard’s likelihood and consequences using realistic deployment densities, equipment-use patterns, and statistical propagation models.
  4. Combine those results into a probabilistic assessment of risk.[78]

This method does not guarantee approval for a new entrant. It does, however, give regulators a fuller account of likely outcomes rather than allowing one extreme scenario to control the decision.

Risk-informed analysis is especially valuable for dynamic-sharing systems. Automated coordinators such as the CBRS Spectrum Access System and the 6 GHz automated frequency-coordination system must assign channels and manage interference in real time. They cannot resolve every potential conflict through an individual proceeding. They need objective criteria that account for both the probability and severity of interference.

Clear thresholds give incumbents and entrants greater certainty because the rules governing coexistence are established before deployment. Worst-case assumptions instead produce unnecessarily large exclusion zones and protection margins, wasting much of the capacity that sharing is intended to make available.

The FCC used probabilistic interference analysis when it opened the 6 GHz band to unlicensed devices despite incumbents’ worst-case objections. The U.S. Circuit Court of Appeals for the D.C. Circuit upheld that approach as reasonable, confirming that quantitative risk assessment can provide a legally defensible basis for spectrum decisions.[79] The National Spectrum Strategy likewise calls for data-driven, risk-informed compatibility and coexistence studies.[80]

Regulators should make risk-informed analysis the default for reallocation and sharing proceedings. Agencies should develop internal expertise, publish their models and assumptions, and allow independent researchers and affected parties to test the results. Greater transparency would improve both the quality and credibility of interference assessments.

Artificial intelligence can strengthen this approach. One promising tool is the spectrum digital twin, a continuously updated virtual model of a real radio environment. Regulators, operators, and researchers can use such models to simulate electromagnetic systems under many operating conditions before making allocation decisions.[81]

A digital twin can represent environments ranging from a single building or industrial campus to a national network. Rather than producing one static worst-case estimate, it can run thousands of simulations across realistic combinations of device locations, power levels, traffic patterns, and propagation conditions. The result is a probabilistic account of interference risk that can also identify ways to improve spectrum use while protecting incumbents.

Risk-informed analysis does not discount catastrophic harms. Some systems support safety-of-life or national-security functions for which even a rare failure could carry grave consequences. A sound risk assessment weighs severity alongside likelihood and can impose stringent protections when potential harm is extreme.[82]

Its advantage lies in distinguishing those cases from ordinary disputes in which incumbents invoke remote hazards to delay competition. Protection should correspond to the actual risk posed by a proposed use rather than applying the same degree of caution across every band and service.

The consequences for AI, AR, and VR are substantial. Much of the mid-band capacity these applications need will depend on reallocation and sharing. Worst-case analysis can keep usable frequencies unavailable because of improbable combinations of events. A risk-informed standard would protect critical systems while allowing regulators to make more productive use of spectrum.

E. Strengthen U.S. Leadership in International Spectrum Policy

Spectrum policy does not stop at national borders. Every four years, the International Telecommunication Union (ITU) convenes the World Radiocommunication Conference (WRC) to revise the international Radio Regulations and coordinate how countries allocate frequency bands.[83] For AI, AR, and VR, this process matters for two reasons. It creates global economies of scale, and it has become an arena for strategic competition, especially with China.

When countries harmonize a band for the same use, manufacturers can design chipsets, devices, and base stations to a common specification. Producing equipment for a global market lowers costs, improves interoperability, and speeds adoption. Those gains can make AR and VR hardware more affordable and allow AI-connected devices to reach a broader market.

China has pursued a coordinated, state-backed effort to place its firms in leadership roles within standards bodies and incorporate Chinese technical proposals into 5G and early 6G standards. Its centralized regulatory system can reallocate prime bands more quickly than the United States. Chinese firms also hold roughly 40% of declared 5G standard-essential patents.

Patent-declaration counts provide an imperfect measure of influence. Firms often declare patents that later prove nonessential, independent reviews find that only a fraction of declared 5G patents are truly essential, and Chinese portfolios contain fewer high-value radio-access-network patents. Even so, the volume of Chinese participation reflects sustained public and private investment in shaping technical standards. China has also sought satellite-interference limits that could constrain U.S. LEO deployments.[84]

The United States and its allies rely more heavily on private firms and consensus-based institutions. That model can produce strong technical standards, but domestic disputes sometimes weaken the U.S. position. Disagreements between commercial and federal spectrum users have prevented the United States from advancing unified mid-band proposals at some WRCs.[85]

Technical standards also influence which vendors supply networks around the world. Standards shaped disproportionately by Chinese proposals may favor Chinese equipment makers. That creates supply-chain, espionage, and surveillance risks of the same kind that prompted U.S. programs to remove Huawei and ZTE equipment.[86] Those risks may prove especially acute in developing countries with limited resources to assess vendors or replace compromised infrastructure.

International proceedings must also protect U.S. defense needs. Bands reserved domestically for military systems may face pressure for identification as international mobile telecommunications spectrum. Resisting such proposals when they would impair assured military access is itself a national-security objective.

The 6 GHz band illustrates the broader commercial competition. The United States authorized the band for unlicensed use in 2020, supporting Wi-Fi and a growing market for unlicensed devices and infrastructure. China has favored licensed mobile networks and seeks broader international adoption of Chinese 5G and 6G equipment. Decisions about international harmonization can therefore influence whether future markets favor licensed cellular systems or the unlicensed technologies in which U.S. firms hold important advantages.

Sustained, coordinated U.S. engagement at the ITU and WRC is necessary to secure globally harmonized bands, protect critical federal operations, and promote technical rules that support competition. The United States must resolve domestic disagreements early enough to present coherent proposals internationally. Otherwise, other countries will shape the standards and allocations on which future AI, AR, and VR networks depend.

VI. Conclusion

Radio spectrum is essential infrastructure for the AI era, but it cannot support next-generation applications alone. Wireless capacity depends on fiber backhaul, edge computing, data centers, devices, and power systems developing alongside it. Spectrum policy must ensure that this communications layer keeps pace with the rest of the infrastructure chain.

The United States will need more than additional frequencies. It needs a layered mix of low-, mid-, and high-band spectrum, paired with licensed, unlicensed, and shared-access models suited to different technical demands. Terrestrial and satellite networks must complement one another. Exclusive rights must provide enough certainty to support investment, while unlicensed and shared bands preserve access for Wi-Fi, immersive applications, new devices, and smaller entrants.

Current institutions can frustrate those goals through accumulated delay and uncertainty. Divided authority between the FCC and the NTIA can slow federal reallocation. The Spectrum Relocation Fund can delay the studies it was created to finance. Worst-case interference analysis can block productive uses based on remote hazards. Domestic disagreements can also weaken U.S. influence at the World Radiocommunication Conference, where international allocations and standards shape equipment markets for decades.

These problems do not require rebuilding the entire spectrum-management system. Policymakers can improve it through sustained FCC-NTIA coordination, faster access to relocation funding, risk-informed interference analysis, transparent technical models, spectrum digital twins, and a coherent U.S. strategy at the International Telecommunication Union. Clear White House direction will be necessary to align agencies whose institutional incentives often diverge.

The OBBBA’s 800 MHz pipeline provides a mandate, but its value will depend on implementation. Federal resistance could delay reallocation and shift pressure toward productive unlicensed and shared bands. Poorly designed sharing rules could discourage investment. Coordination frameworks that entrench early satellite entrants could restrict competition. Each decision should account for total economic value rather than auction revenue or incumbent protection alone.

Success would produce an integrated spectrum system in which licensed, shared, and unlicensed access serve complementary purposes, satellite networks extend terrestrial coverage, and U.S. proposals shape global standards. Failure would preserve underused federal assignments, expose productive bands to reallocation pressure, and leave new services waiting while agencies reopen old interference disputes. American leadership in AI, augmented reality, virtual reality, and wireless communications will depend in part on whether spectrum governance can move with the technologies it is meant to support.

[1] Kristian Stout, Infrastructure Is Destiny: The Geography of the Next Technology Race, Int’l Ctr. for L. & Econ. (May 26, 2026), https://laweconcenter.org/resources/infrastructure-is-destiny-the-geography-of-the-next-technology-race.

[2] Id.

[3] Peter Elkind, Inside the Government Fiasco That Nearly Closed the U.S. Air System, ProPublica (May 26, 2022), https://www.propublica.org/article/fcc-faa-5g-planes-trump-biden; Jeffrey Westling, Primer: A Staffer’s Guide to Spectrum Auction Reauthorization, Am. Action Forum (Feb. 20, 2025), https://www.americanactionforum.org/insight/primer-a-staffers-guide-to-spectrum-auction-reauthorization.

[4] Jonathan E. Nuechterlein & Philip J. Weiser, Digital Crossroads: Telecommunications Law and Policy in the Internet Age (2d ed. 2013).

[5] Jean Pierre De Vries & Jeffrey Westling, Not a Scarce Natural Resource: Alternatives to Spectrum-Think, TPRC45 (Oct. 2, 2017), https://ssrn.com/abstract=2943502.

[6] Id.

[7] See, e.g., Mustafa Riza Akdeniz et al., Millimeter Wave Channel Modeling and Cellular Capacity Evaluation, 32 IEEE J. on Selected Areas in Commc’ns 1164 (2014) (discussing millimeter-wave spectrum as a means to increase capacity by providing access to wider channels).

[8] Fed. Commc’ns Comm’n, Office of Eng’g & Tech., OET Bulletin No. 70, Millimeter Wave Propagation: Spectrum Management Implications (July 1997), https://transition.fcc.gov/Bureaus/Engineering_Technology/Documents/bulletins/oet70/oet70a.pdf.

[9] C.E. Shannon, A Mathematical Theory of Communication, 27 Bell Sys. Tech. J. 379 (1948).

[10] 47 C.F.R. § 15.3 (2024) (defining “harmful interference” as “[a]ny emission, radiation or induction that endangers the functioning of a radio navigation service or of other safety services or seriously degrades, obstructs or repeatedly interrupts a radiocommunications service operating in accordance with [Title 47]”).

[11] 47 U.S.C. §§ 154, 302a, 303, 304, 307, 336, 544a.

[12] Nuechterlein & Weiser, supra note 4; see also Thomas W. Hazlett, Assigning Property Rights to Radio Spectrum Users: Why Did FCC License Auctions Take 67 Years?, 41 J.L. & Econ. 529 (1998).

[13] See U.S. Gov’t Accountability Off., GAO-24-106325, Spectrum Management: Key Practices Could Help Address Challenges to Spectrum Sharing (July 2024), https://www.gao.gov/assets/gao-24-106325.pdf.

[14] See, e.g., Fed. Commc’ns Comm’n, FCC Announces Winning Bidders in C-Band Auction; Auction 107 of 3.7 GHz Service Licenses Yields Over $81 Billion in Gross Bids (Feb. 25, 2021), https://www.fcc.gov/document/fcc-announces-winning-bidders-c-band-auction.

[15] Jeffrey Westling, Eric Fruits & Kristian Stout, Comments of the Int’l Ctr. for L. & Econ., Empowering Local Broadcast TV Stations to Meet Their Public Interest Obligations: Exploring Market Dynamics Between National Programmers and Their Affiliates, MB Docket No. 25-322 (Dec. 10, 2025), https://laweconcenter.org/wp-content/uploads/2025/12/Network-Affiliation-Comments-of-the-International-Center-for-Law-Economics.pdf.

[16] NCTA—The Internet & Television Ass’n, Spectrum & Wi-Fi, https://www.ncta.com/priorities/dynamic-networks/spectrum-and-wi-fi (last modified Feb. 12, 2026).

[17] Hazlett, Assigning Property Rights to Radio Spectrum Users, supra note 12.

[18] Paul Milgrom, Jonathan Levin & Assaf Eilat, The Case for Unlicensed Spectrum 3–4 (Oct. 12, 2011), https://web.stanford.edu/~jdlevin/Papers/UnlicensedSpectrum.pdf.

[19] Jeffrey Westling, Rivalrous Regulators: Historical Analysis of the Dual Agency Approach to Spectrum Management, R Street Pol’y Study No. 231 (Oct. 4, 2021), https://www.rstreet.org/2021/10/04/rivalrous-regulators-historical-analysis-of-the-dual-agency-approach-to-spectrum-management.

[20] R.H. Coase, The Federal Communications Commission, 2 J.L. & Econ. 1, 6 (1959).

[21] 47 U.S.C. § 303 (granting the Federal Communications Commission authority to regulate radio communications “as public convenience, interest, or necessity requires”); 47 U.S.C. § 307(a) (requiring the Commission to grant broadcast licenses “if public convenience, interest, or necessity will be served thereby”); 47 U.S.C. § 309(a) (requiring the Commission to grant license applications when “public interest, convenience, and necessity will be served”).

[22] R.H. Coase, The Interdepartment Radio Advisory Committee, 5 J.L. & Econ. 17 (1962).

[23] Westling, Rivalrous Regulators, supra note 19.

[24] Id. at 1.

[25] Press Release, Sen. Deb Fischer, Defense Officials to Fischer: If DOD Is Forced to Vacate Spectrum Frequencies, U.S. Would Assume High Level of Risk for Homeland Defense (May 13, 2025), https://www.fischer.senate.gov/public/index.cfm/2025/5/defense-officials-to-fischer-if-dod-is-forced-to-vacate-spectrum-frequencies-u-s-would-assume-high-level-of-risk-for-homeland-defense.

[26] MOBILE NOW Act, S. 19, § 5, 115th Cong. (2017).

[27] Jeffrey Westling, It Takes Two to Make a Proceeding Go Slow, R Street Inst. (July 20, 2020), https://www.rstreet.org/commentary/it-takes-two-to-make-a-proceeding-go-slow.

[28] Seth L. Cooper, D.C. Circuit Upholds FCC’s 5.9 GHz Order Reallocating Spectrum for Unlicensed Use, Fed. Soc’y Blog (Sept. 12, 2022), https://fedsoc.org/commentary/fedsoc-blog/d-c-circuit-upholds-fcc-s-5-9-ghz-order-reallocating-spectrum-for-unlicensed-use.

[29] See generally Fed. Commc’ns Comm’n, Licensing, https://www.fcc.gov/licensing (last visited June 8, 2026).

[30] Eric Fruits & Kristian Stout, Comments of the Int’l Ctr. for L. & Econ., Modernizing Spectrum Sharing for Satellite Broadband, SB Docket No. 25-157 (July 28, 2025), https://laweconcenter.org/wp-content/uploads/2025/07/2025-EPFD-Comments.pdf.

[31] Randall Berry, Thomas W. Hazlett, Michael L. Honig & J. Nicholas Laneman, Evaluating the CBRS Experiment (Aug. 1, 2023) (unpublished manuscript), https://ssrn.com/abstract=4528763.

[32] Milgrom, Levin & Eilat, supra note 18, at 3–5 (“[U]nlicensed spectrum is an enabling resource. It provides a platform for innovation upon which innovators may face lower barriers to bringing wireless products to market because they are freed from the need to negotiate with exclusive license holders.”).

[33] 47 C.F.R. pt. 15 (2024).

[34] Opensignal, USA, Converged Experience, April 2026 (Apr. 30, 2026), https://insights.opensignal.com/2026/04/usa-converged-experience-april-2026/dt.

[35] Partitioning, Disaggregation, and Leasing of Spectrum, Report and Order and Second Further Notice of Proposed Rulemaking, WT Docket No. 19-38, FCC 22-53, 37 FCC Rcd. 8825 (2022).

[36] Nat’l Telecommc’ns & Info. Admin., Advanced Dynamic Spectrum Sharing Demonstration in the National Spectrum Strategy (June 28, 2024), https://www.ntia.gov/issues/national-spectrum-strategy/advanced-dynamic-spectrum-sharing-demonstration-in-the-national-spectrum-strategy.

[37] Amendment of the Commission’s Rules with Regard to Commercial Operations in the 3550-3650 MHz Band, Report and Order and Second Further Notice of Proposed Rulemaking, GN Docket No. 12-354, FCC 15-47, 30 FCC Rcd. 3959 (2015).

[38] Id. ¶¶ 301–378.

[39] Berry et al., supra note 31 (“The U.S. experience in the CBRS band has not evinced efficiencies in reducing delays, or in enhancing the flow of large amounts of bandwidth to higher valued uses. In terms of what rival nations have accomplished in their 3.5 GHz allocations, which uniformly rely primarily on awarding flexible, exclusive rights and which do not include the U.S.’s approximately 50-50 split between licensed and unlicensed, substantially more spectrum has been put into play [via exclusive licensing].”).

[40] Martin Cave, Chris Doyle & William Webb, Spectrum Trading: Secondary Markets, in Essentials of Modern Spectrum Management 85 (2007).

[41] Promoting Efficient Use of Spectrum Through Elimination of Barriers to the Development of Secondary Markets, Report and Order and Further Notice of Proposed Rulemaking, WT Docket No. 00-230, FCC 03-113, 18 FCC Rcd. 20604 (2003); see also Promoting Efficient Use of Spectrum Through Elimination of Barriers to the Development of Secondary Markets, Second Report and Order, Order on Reconsideration, and Second Further Notice of Proposed Rulemaking, WT Docket No. 00-230, FCC 04-167, 19 FCC Rcd. 14165 (2004).

[42] Linda Hardesty, Sprint PCS Spectrum Looks Like Boon for T-Mobile, Fierce Network (Aug. 6, 2019), https://www.fierce-network.com/5g/sprint-pcs-spectrum-looks-like-boon-for-t-mobile.

[43] Expanding Flexible Use of the 3.7 to 4.2 GHz Band, Report and Order and Order of Proposed Modification, GN Docket No. 18-122, FCC 20-22, 35 FCC Rcd. 2343, ¶ 178 (2020), https://www.fcc.gov/document/fcc-expands-flexible-use-c-band-5g-0.

[44] See, e.g., Lili Cao & Haitao Zheng, Towards Real-Time Dynamic Spectrum Auctions, 87 Computer Networks 1 (2008) (proposing a low-complexity auction framework for allocating spectrum in real time among large numbers of wireless users with dynamic traffic).

[45] See John W. Mayo & Scott Wallsten, Enabling Efficient Wireless Communications: The Role of Secondary Spectrum Markets, 22 Info. Econ. & Pol’y 61 (2010); see also U.S. Gov’t Accountability Off., GAO-14-236, Spectrum Management: FCC’s Use and Enforcement of Buildout Requirements (Feb. 2014), https://www.gao.gov/assets/gao-14-236.pdf (discussing spectrum warehousing concerns).

[46] 5G Ams., From Spectrum Scarcity to Scale: Why the Hunt for Mid-Band Spectrum Is Defining the 5G-to-6G Transition (Dec. 3, 2025), https://www.5gamericas.org/from-spectrum-scarcity-to-scale-why-the-hunt-for-mid-band-spectrum-is-defining-the-5g-to-6g-transition.

[47] Unlicensed Use of the 6 GHz Band; Expanding Flexible Use in Mid-Band Spectrum Between 3.7 and 24 GHz, Report and Order and Further Notice of Proposed Rulemaking, ET Docket No. 18-295, GN Docket No. 17-183, FCC 20-51, 35 FCC Rcd. 3852 (2020); Unlicensed Use of the 6 GHz Band; Expanding Flexible Use in Mid-Band Spectrum Between 3.7 and 24 GHz, Fourth Report and Order and Third Further Notice of Proposed Rulemaking, ET Docket No. 18-295, GN Docket No. 17-183, FCC 26-1 (Jan. 30, 2026).

[48] Nokia, Spectrum for 6G Explained, https://www.nokia.com/6g/spectrum-for-6G-explained (last visited June 8, 2026).

[49] ATIS Next G Alliance, Derivation of Spectrum Needs for 6G (June 2024), https://nextgalliance.org/white_papers/6g-spectrum-considerations.

[50] Maxim Susloparov, Artem Krasilov & Evgeny Khorov, Providing High Capacity for AR/VR Traffic in 5G Systems with Multi-Connectivity, IEEE PIMRC 2022 (2022), https://arxiv.org/pdf/2208.08277.

[51] Ian F. Akyildiz, Chong Han, Zhen Hu, Shuai Nie & Josep M. Jornet, Terahertz Band Communication: An Old Problem Revisited and Research Directions for the Next Decade, 70 IEEE Trans. Commc’ns 4250 (2022).

[52] One Big Beautiful Bill Act, Pub. L. No. 119-21, 139 Stat. 72 (2025).

[53] NCTA—The Internet & Television Ass’n, Why Protecting Wi-Fi and CBRS Is Smart Policy—and Smart Business (June 10, 2025), https://www.ncta.com/news/protecting-wi-fi-and-cbrs-is-smart-policy.

[54] Arielle Roth, Assistant Sec’y of Com. for Commc’ns & Info. & Adm’r, Nat’l Telecommc’ns & Info. Admin., Remarks at the Americas Spectrum Management Conference (Oct. 30, 2025), https://www.ntia.gov/speech/testimony/2025/remarks-assistant-secretary-arielle-roth-americas-spectrum-management-conference (“Let me be clear: OB3 does not alter U.S. policy for the 6 GHz band, which was designated for unlicensed use during the first Trump Administration. That remains our position.”).

[55] LEO Policy Working Group, Low Earth Orbit Satellites: Policies to Promote Spectrum Sharing, Foster Competition, and Close Digital Divides: A Report of the LEO Policy Working Group, New Am. & Int’l Ctr. for L. & Econ. (Oct. 30, 2025), https://www.newamerica.org/insights/leo-satellites.

[56] Id.

[57] Aizaz U. Chaudhry & Halim Yanikomeroglu, Laser Inter-Satellite Links in a Starlink Constellation: A Classification and Analysis, 16 IEEE Vehicular Tech. Mag. 48 (June 2021).

[58] Int’l Telecommc’n Union, ITU Radio Regulatory Framework for Space Networks (2020), https://www.itu.int/en/ITU-R/space/snl/Documents/ITU-Space_reg.pdf.

[59] Single Network Future: Supplemental Coverage from Space; Space Innovation, Report and Order and Further Notice of Proposed Rulemaking, IB Docket No. 22-271, FCC 24-28 (Mar. 15, 2024).

[60] Mohammed S. Elbamby, Cristina Perfecto, Mehdi Bennis & Klaus Doppler, Toward Low-Latency and Ultra-Reliable Virtual Reality, 32 IEEE Network 78 (2018).

[61] LEO Policy Working Group, supra note 55.

[62] See, e.g., Space Bureau Opens Processing Rounds for NGSO FSS Systems, Public Notice, DA 26-552 (Space Bureau June 5, 2026), https://docs.fcc.gov/public/attachments/DA-26-552A1.pdf.

[63] Int’l Telecommc’n Union, Equivalent Power-Flux Density Limits Examination: Part I—Overview (Dec. 2024), https://www.itu.int/en/ITU-R/seminars/wrs/Documents/2024/Space-Workshops/EPFD%20Part%20I%20Overview%20WRS-2024.pdf; see also Modernizing Spectrum Sharing for Satellite Broadband, Report and Order, SB Docket No. 25-157, FCC 26-26, ¶ 18 (rel. May 1, 2026), https://docs.fcc.gov/public/attachments/FCC-26-26A1.pdf.

[64] Modernizing Spectrum Sharing for Satellite Broadband, supra note 63.

[65] Nada Abdel Khalek, Deemah H. Tashman & Walaa Hamouda, Advances in Machine Learning-Driven Cognitive Radio for Wireless Networks: A Survey, 26 IEEE Commc’ns Surveys & Tutorials 1201 (2024).

[66] Westling, Primer: A Staffer’s Guide to Spectrum Auction Reauthorization, supra note 3.

[67] CTIA, The Looming Spectrum Crisis (Mar. 27, 2025), https://www.ctia.org/news/the-looming-spectrum-crisis.

[68] One Big Beautiful Bill Act, Pub. L. No. 119-21, 139 Stat. 72 (2025).

[69] Id. § 40002(b)(1).

[70] Commercial Spectrum Enhancement Act of 2004, Pub. L. No. 108-494, tit. II, 118 Stat. 3986, 3991 (2004) (codified at 47 U.S.C. §§ 923(g)–(i), 928).

[71] Arielle Roth, Assistant Sec’y of Com. for Commc’ns & Info., Remarks at the 2026 CTIA Summit (May 6, 2026), https://www.ntia.gov/speech/testimony/2026/remarks-assistant-secretary-arielle-roth-2026-ctia-summit.

[72] Id.

[73] 47 U.S.C. § 928(g)(2)(D)(ii).

[74] Press Release, Nat’l Telecommc’ns & Info. Admin., FCC, NTIA Establish Spectrum Coordination Initiative (Feb. 15, 2022), https://www.ntia.gov/press-release/2022/fcc-ntia-establish-spectrum-coordination-initiative; Memorandum of Understanding Between the Federal Communications Commission and the National Telecommunications and Information Administration (Aug. 1, 2022), https://www.ntia.gov/other-publication/2022/memorandum-understanding-between-fcc-and-ntia.

[75] Nat’l Telecommc’ns & Info. Admin., National Spectrum Strategy (Nov. 2023), https://www.ntia.gov/sites/default/files/publications/national_spectrum_strategy_final.pdf; Nat’l Telecommc’ns & Info. Admin., National Spectrum Strategy Implementation Plan (Mar. 12, 2024), https://www.ntia.gov/sites/default/files/publications/national-spectrum-strategy-implementation-plan.pdf.

[76] Spectrum & Receiver Performance Working Grp., Fed. Commc’ns Comm’n Technological Advisory Council, A Quick Introduction to Risk-Informed Interference Assessment (ver. 1.00, Apr. 1, 2015), https://transition.fcc.gov/bureaus/oet/tac/tacdocs/meeting4115/Intro-to-RIA-v100.pdf.

[77] Id. at 1.

[78] Id. at 3.

[79] AT&T Servs., Inc. v. FCC, No. 20-1190, at 15 (D.C. Cir. Dec. 28, 2021).

[80] Nat’l Telecommc’ns & Info. Admin., National Spectrum Strategy, supra note 75, at 16.

[81] Serhat Tadik et al., Digital Spectrum Twins for Enhanced Spectrum Sharing and Other Radio Applications, IEEE J. Radio Frequency Identification (2023), https://ieeexplore.ieee.org/document/10293151.

[82] Spectrum & Receiver Performance Working Grp., Fed. Commc’ns Comm’n Technological Advisory Council, supra note 76.

[83] Int’l Telecommc’n Union, World Radiocommunication Conferences (WRC), https://www.itu.int/en/ITU-R/conferences/wrc/Pages/default.aspx (last visited June 9, 2026).

[84] Evan Grey, The 200,000-Satellite Filing: When Commercial Loopholes Become State Weapons, SatNews (Jan. 23, 2026), https://satnews.com/2026/01/23/the-200000-satellite-filing-when-commercial-loopholes-become-state-weapons.

[85] Jeffrey Westling, Primer: World Radio Conference 2023, Am. Action Forum (Aug. 30, 2023), https://www.americanactionforum.org/insight/primer-world-radio-conference-2023.

[86] Secure and Trusted Communications Networks Act of 2019, Pub. L. No. 116-124, 134 Stat. 158 (2020) (codified at 47 U.S.C. §§ 1601–1609) (authorizing the Federal Communications Commission to prohibit the use of federal subsidies for covered equipment and to reimburse providers for removing Huawei and ZTE equipment).


ICLE Issue Brief

The Tax Cartel: How Global Harmonization Undermines Growth, Sovereignty, and Democracy

Executive Summary International tax cooperation once focused on preventing double taxation while respecting national sovereignty. Over the past three decades, the Organisation for Economic Co-operation and Development, the European Union,...

Executive Summary

International tax cooperation once focused on preventing double taxation while respecting national sovereignty. Over the past three decades, the Organisation for Economic Co-operation and Development, the European Union, and the United Nations have pursued a broader agenda aimed at limiting tax competition, reallocating taxing rights, and imposing minimum corporate tax rates. The Base Erosion and Profit Shifting initiative, the OECD’s two-pillar framework, EU blacklists, and the proposed U.N. tax convention shift authority away from national governments and toward institutions with less democratic accountability.

The economic case for this agenda is weak. Corporate taxes discourage investment, reduce productivity, and depress wages. Tax competition helped cut average statutory corporate rates across OECD countries from about 47% in 1980 to roughly 23% in 2023, yet corporate-tax revenue remained stable or increased, total tax-to-GDP ratios rose, and high-income earners paid a growing share of taxes. The predicted “race to the bottom” never arrived.

This brief uses the Democratically Deficient Organizations (DoDO) framework to explain why tax harmonization continues despite that record. In essence: politicians in high-tax countries, intergovernmental bodies, advocacy groups, public-sector unions, foundations, and affiliated academics pursue different interests but support the same policies. Their funding, research, lobbying, and moral rhetoric create the appearance of consensus while narrowing democratic debate and insulating tax policy from competition.

Governments should abandon the global minimum tax, reject the proposed U.N. tax convention, reform the EU blacklist, and end public funding for organizations that campaign for tax harmonization. International institutions should return to the facilitation of cooperation among sovereign states rather than dictating tax rates or punishing jurisdictions that choose lower ones. Restoring tax competition would strengthen investment, wages, fiscal discipline, and democratic control.

“Man is generally considered by statesmen and projectors as the materials of a sort of political mechanics. Projectors disturb nature in the course of her operations in human affairs; and it requires no more than to let her alone, and give her fair play in the pursuit of her ends that she may establish her own designs. Little else is requisite to carry a state to the highest degree of opulence from the lowest barbarism, but peace, easy taxes, and a tolerable administration of justice; all the rest being brought about by the natural course of things. All governments which thwart this natural course, which force things into another channel or which endeavour to arrest the progress of society at a particular point, are unnatural, and to support themselves are obliged to be oppressive and tyrannical.” — Adam Smith (1755)[1]

I.   Introduction

Imagine the outcry if the president issued an executive order requiring every state to impose a minimum corporate tax rate of 15%. The order would almost certainly be unconstitutional. It would also strip states of a core democratic choice.

Yet international institutions have pursued a similar result with far less public debate. Over the past three decades, they have built a system designed to limit tax competition among countries and pressure governments toward common rules and minimum rates.

States compete to attract individuals and businesses. They do so through public spending, regulation, and taxation. In one of economics’ most cited articles, Charles Tiebout argued that this competition gives governments incentives to provide public goods and levy taxes that reflect residents’ collective preferences.[2] Tax competition can therefore help keep political power with the governed rather than those who govern.

For individuals, this process depends heavily on mobility.[3] Tiebout recognized that his theory applies most readily where people can move across jurisdictions with few barriers, as they can among U.S. states.

The same basic logic applies to companies, though they value a narrower set of public goods. These include clear and flexible company law, strong shareholder protections, simple incorporation procedures, and reliable contract enforcement.[4] Lower corporate tax rates also increase after-tax profits, making them attractive to shareholders.

Many companies are also highly mobile. Their legal domicile need not match the location of their owners, employees, or physical assets. That mobility gives jurisdictions incentives to improve the mix of legal services and taxes they offer.

Smaller jurisdictions have often responded by specializing in company law, incorporation services, and related legal infrastructure, while imposing low or zero corporate tax rates. Their success is consistent with Tiebout’s theory. Competition has encouraged jurisdictions to offer legal and fiscal arrangements that companies value.

A broad coalition has spent the past three decades trying to weaken that competition. It includes politicians, intergovernmental bodies, philanthropic foundations, advocacy groups, public-sector trade unions, and academics. Together, they have built an elaborate system of international tax coordination.

Supporters argue that multinational companies and wealthy individuals exploit differences among national tax systems, producing a “race to the bottom.” Their proposed remedy is greater tax harmonization, including common tax bases, disclosure rules, blacklists, and minimum rates.

This study examines the campaign for tax harmonization, the institutions created to advance it, the effects of those institutions, and the organizations that sustain them. It uses the Democratically Deficient Organizations (DoDO) framework, which explains how coalitions can form and persist even when their policies conflict with society’s broader interests.[5]

Section II traces the main developments in international tax coordination over the past three decades, including the Organisation for Economic Co-operation and Development’s (OECD) 1998 campaign against “harmful tax competition,” the Base Erosion and Profit Shifting project, the global minimum tax, and the proposed United Nations tax convention.

Section III examines the economic evidence on tax competition, with particular attention to corporate and capital taxation and the role of competition among jurisdictions.

Section IV explains the DoDO model, identifies the principal actors in the international-tax coalition, and shows how they create the appearance of consensus.

Section V draws conclusions and proposes reforms.

II.   From Tax Coordination to Tax Harmonization

For most of the 20th century, international tax agreements focused on preventing double taxation. These treaties respected national sovereignty by allocating taxing rights among jurisdictions so that the same income would not generally face tax twice.

The Organisation for European Economic Co-operation promoted this approach beginning in the 1950s. Its fiscal committee argued that double taxation discouraged investment and economic development.[6] Its successor, the Organisation for Economic Co-operation and Development (OECD), continued that work and published a “Draft Double Taxation Convention on Income and Capital” in 1963.[7] The OECD still supports such treaties.[8]

Over the past three decades, the OECD’s role has expanded well beyond preventing double taxation. It has led campaigns against “harmful tax competition,” created the Base Erosion and Profit Shifting initiative, pressed low-tax jurisdictions to adopt its rules through peer review and exclusion, and developed the Pillar One and Pillar Two tax regimes. The United Nations has since begun work on an even broader global tax convention.

This section traces that expansion. Section III then examines how these measures affect tax competition, national sovereignty, and democratic control.

A. The OECD Targets ‘Harmful Tax Competition’

In May 1996, the OECD’s governing Council of Ministers directed the organization to “analyse and develop measures to counter the distorting effects of harmful tax competition on investment and financing decisions and the consequences for national tax bases, and report back in 1998.”[9] The Group of Seven (G7) Council later stated the concern more plainly:

Finally, globalisation is creating new challenges in the field of tax policy.  Tax schemes aimed at attracting financial and other geographically mobile activities can create harmful tax competition between States, carrying risks of distorting trade and investment and could lead to the erosion of national tax bases.  We strongly urge the OECD to vigorously pursue its work in this field, aimed at establishing a multilateral approach under which countries could operate individually and collectively to limit the extent of these practices. We will follow closely the progress on work by the OECD, which is due to produce a report by 1998.

The resulting report, “Harmful Tax Competition: An Emerging Global Issue,” identified a range of “harmful tax practices.” Its main targets were preferential regimes offered by OECD members, such as reduced rates for certain companies and patent-box regimes, as well as “tax havens.”[10]

The report identified four features of a tax haven: no or nominal taxes, limited transparency, laws that restrict information sharing with other governments, and tolerance of shell companies with little or no genuine economic activity.

In 2001, U.S. Treasury Secretary Paul O’Neill objected that the initiative treated low tax rates as inherently suspect and threatened to dictate domestic tax policy to other jurisdictions:

I am troubled by the underlying premise that low tax rates are somehow suspect and by the notion that any country, or group of countries, should interfere in any other country’s decision about how to structure its own tax system. I also am concerned about the potentially unfair treatment of some non-OECD countries. The United States does not support efforts to dictate to any country what its own tax rates or tax system should be, and will not participate in any initiative to harmonize world tax systems. The United States simply has no interest in stifling the competition that forces governments – like businesses – to create efficiencies.[11]

Under U.S. pressure, the OECD narrowed the tax-haven portion of the project. It temporarily stopped using the “no substantial activities” criterion to determine which low-tax jurisdictions counted as uncooperative and shifted its focus toward transparency and information exchange. However, the broader framework targeting low- and no-tax jurisdictions remained intact.

The retreat proved to be merely tactical. The OECD expanded its authority through transparency rules, information-sharing initiatives, working groups, committees, and peer-review mechanisms. After the 2008 financial crisis, that machinery supported a much more ambitious international tax agenda, which we now explore.

B. BEPS and the Inclusive Framework

The OECD’s tax-coordination project centers on its Base Erosion and Profit Shifting (BEPS) initiative, launched in 2013 at the Group of 20’s (G20) direction.[12] Its premise appears in the name. BEPS seeks to protect national tax bases by limiting companies’ ability to shift profits from high-tax to low-tax jurisdictions.

By the 2000s, large U.S. multinationals were increasingly using differences among national tax codes to book much of their foreign profit in low-tax jurisdictions and defer U.S. corporate income tax on those earnings.[13] Critics portrayed these arrangements as egregious tax avoidance, even though the companies generally acted within the law. That criticism helped supply the political case for BEPS.

In 2013, the OECD adopted a 15-point BEPS Action Plan. It included four minimum standards governing transfer pricing, treaty abuse, country-by-country reporting, and dispute resolution.[14]

The G20/OECD Inclusive Framework has become central to the project. Established in 2016, it now includes 147 jurisdictions, each committed to implementing the BEPS Action Plan.[15]

Neither the G20 nor the Inclusive Framework has formal lawmaking authority. The G20 supplies the political mandate for the OECD’s tax agenda, while the Inclusive Framework gives that agenda a veneer of broad participation and legitimacy.[16]

C. Enforcing BEPS Through Reputation and Exclusion

OECD and G20 members designed the BEPS rules largely to address profit shifting from higher-tax countries. In principle, those countries could have changed their domestic laws and tax treaties. Instead, they adopted rules that depended on cooperation from the low-tax jurisdictions receiving the shifted profits.

The OECD lacked formal enforcement power, so it relied on reputation and exclusion. Jurisdictions that joined the OECD/G20 Inclusive Framework, adopted the BEPS package, and submitted to peer review retained access to the treaty system and the status of a cooperative jurisdiction. Those that stayed outside or failed to comply risked designation as noncooperative by the OECD, the G20, and the European Union, as well as greater scrutiny from banks, tax authorities, and commercial counterparties.

BEPS Action 5 also revived the OECD’s campaign against “harmful tax practices.”[17] The Forum on Harmful Tax Practices reviews preferential tax regimes for features that facilitate base erosion and profit shifting.

Action 5 restored a substantial-activities requirement for low-tax jurisdictions. Those jurisdictions could no longer permit entities with no genuine operations, employees, premises, or other economic connection to claim local tax residence. Many responded by adopting economic-substance laws and new reporting requirements.

Since 2017, the Council of the European Union has maintained a blacklist of “noncooperative jurisdictions for tax purposes.”[18] The EU bases its criteria heavily on OECD standards and evaluates third countries in part on their compliance with BEPS.

Most offshore financial centers depend on access to European capital, banks, investors, and professional-services firms. The threat of blacklisting therefore gave the EU considerable coercive power and pushed many jurisdictions to adopt BEPS-compliant reforms.

The blacklist also applies a double standard. The EU screens third countries against criteria that it does not apply to its own members, even though several member states might struggle to satisfy them.

D. Global Minimum Taxes

Over the past decade, the OECD and, more recently, the United Nations have pursued global minimum-tax rules.

1.               The OECD’s Two Pillars

The OECD’s approach consists of two rule sets, known as Pillar One and Pillar Two, developed through the informal Inclusive Framework.

Pillar Two centers on the Global Anti-Base Erosion rules, known as GloBE. These rules impose a 15% minimum effective corporate tax rate on multinational enterprises with annual revenue above €750 million.[19]

GloBE applies country by country. When a corporate group’s effective tax rate in a jurisdiction falls below 15%, a top-up tax applies after an allowance for payroll and tangible assets.

The jurisdiction where the shortfall arises has first priority through a qualified domestic minimum top-up tax. If that jurisdiction does not collect the difference, the ultimate parent’s jurisdiction may do so under the income-inclusion rule. If neither acts, the undertaxed-payments rule allows other countries to collect the top-up, often by denying deductions.

This structure has created conflict among OECD members. The undertaxed-payments rule fits uneasily with existing tax treaties, and members of the U.S. Congress have proposed retaliatory taxes on companies based in countries that apply it to U.S. firms.

Competition among jurisdictions has also continued. Some countries have adopted corporate tax rates as low as 9%, while others have considered rates between 5% and 15%. The minimum tax has shifted business among jurisdictions rather than ended competition for it.

The United States has not implemented Pillar Two and may never do so. Republican members of the House Ways and Means Committee warned that the undertaxed-payments rule would allow foreign governments to tax U.S. domestic profits and proposed retaliatory legislation.[20] In January 2026, the OECD negotiated a “side-by-side” package that largely exempted U.S.-headquartered multinationals from Pillar Two’s most burdensome provisions.[21]

Pillar One applies only to companies with more than $20 billion in annual global revenue and profit margins above 10%. It would reallocate “Amount A,” equal to 25% of profit above the 10% threshold, to the countries where customers are located.

This rule would require large U.S. technology companies to pay more tax to foreign governments and less to the U.S. government. The OECD released a draft Multilateral Convention to implement Amount A in October 2023, but the convention has not opened for signature.[22]

2.               The U.N. Tax Convention

In December 2023, the U.N. General Assembly created an ad hoc committee to draft terms for a Framework Convention on International Tax Cooperation. In December 2024, it approved terms of reference for an intergovernmental negotiating committee.

A total of 110 countries voted in favor. The United States voted against the measure and withdrew from the negotiations in February 2025, calling the process “unwelcome overreach.” The United Kingdom also opposed the resolution.[23]

The proposed convention would add another layer of supranational tax governance to the OECD-led system. The project has expanded considerably since the OECD’s 1998 transparency initiative. It now reaches toward a binding global tax treaty that would further constrain national tax sovereignty and competition.

Proponents argue that greater harmonization would strengthen democracy. The next section examines why its effects may run in the opposite direction.

III.   The Economic Case for Tax Competition

Against the push for tax harmonization described in Section II, this section examines how corporate and capital taxes affect investment, wages, growth, and government revenue. It also considers how competition among jurisdictions can improve legal institutions, discipline tax policy, and attract mobile capital.

The evidence cuts against the claim that tax competition creates a fiscal “race to the bottom.” Lower corporate tax rates have often coincided with stable or rising revenue, greater investment, and a larger tax share paid by high-income earners.

A. Corporate Taxes and Economic Growth

Taxes fund public goods such as national defense, policing, and impartial courts. Governments should raise that revenue through taxes that distort economic activity as little as possible. As Adam Smith observed, “Little else is requisite to carry a state to the highest degree of opulence from the lowest barbarism, but peace, easy taxes, and a tolerable administration of justice.”[24]

By “easy taxes,” Smith appears to have meant taxes that impose the least drag on production and growth. A 2008 study by OECD economists compared the effects of different taxes and reached a clear conclusion:

Corporate taxes are found to be most harmful for growth, followed by personal income taxes, and then consumption taxes. Recurrent taxes on immovable property appear to have the least impact. A revenue neutral growth-oriented tax reform would, therefore, be to shift part of the revenue base from income taxes to less distortive taxes such as recurrent taxes on immovable property or consumption.[25] [Emphasis added.]

Corporate income taxes reduce the after-tax return on investment and therefore discourage some projects that otherwise would proceed. The effect is especially pronounced for productive and mobile forms of capital. In an open economy, capital tends to move toward jurisdictions offering the highest after-tax returns. Countries that tax corporate income more heavily therefore attract less investment and may experience slower productivity and wage growth.

A substantial empirical literature supports that relationship. In a study covering 85 countries, Simeon Djankov and his coauthors measured the taxes imposed on a standardized midsize business. After controlling for other factors, they found:

The effective corporate tax rate has a large adverse impact on aggregate investment, FDI, and entrepreneurial activity. For example, a 10 percent increase in the effective corporate tax rate reduces aggregate investment to GDP ratio by 2 percentage points. Corporate tax rates are also negatively correlated with growth, and positively correlated with the size of the informal economy.[26]

A later study in the Journal of Accounting and Economics developed an alternative measure based on the cash effective tax rates paid by publicly listed firms.[27] That measure captured statutory rates, other features of the tax code, enforcement, and corporate tax planning. The authors found “a strong robust negative relation between country-level effective tax rates and future macroeconomic growth.”[28]

Studies of tax changes reach similar conclusions. Christina D. Romer, who chaired President Barack Obama’s Council of Economic Advisers, and David H. Romer examined major U.S. tax changes after World War II. They found that a tax cut equal to 1% of gross domestic product increased GDP by between 2.5% and 3%.[29]

Other estimates are smaller but still substantial. Karel Mertens and Morten O. Ravn found that a 1-percentage-point reduction in the average corporate tax rate increased real GDP per capita by 0.4% after one year and 0.6% after two years.[30]

Investment provides one of the main channels through which corporate taxes affect growth. Recent research, including a 2023 study by the OECD Economics Department, finds that lower corporate taxes increase business investment.[31]

Michael Christl and Monika Köppl-Turyna examined changes in European Union countries’ rankings on the Tax Foundation’s International Tax Competitiveness Index. They found that a one-point improvement in a country’s corporate-tax score was associated with a cumulative 0.16% increase in economic growth over three years.[32]

Research on the composition of taxation points in the same direction. Increases in consumption taxes and value-added taxes generally impose less harm on growth than increases in corporate income taxes. Broadening the tax base by eliminating deductions and targeted incentives also tends to cause less damage than raising corporate rates.[33]

B. Workers Bear Much of the Corporate Tax

Supporters of corporate tax harmonization often argue that corporate taxes redistribute wealth from capital owners to workers. That claim overlooks two problems.

First, corporate taxes discourage investment. Lower investment slows innovation, productivity growth, and economic expansion. The result is less wealth to redistribute and fewer gains for consumers and workers.

Second, workers bear a substantial share of the tax through lower wages. Corporate taxes reduce the after-tax return on capital, which leads firms to invest less and lowers worker productivity. Companies then employ fewer workers or pay them less.

Arnold Harberger first demonstrated this effect theoretically in 1962.[34] Later empirical studies reached similar conclusions. Wiji Arulampalam, Michael P. Devereux, and Giorgia Maffini analyzed more than 55,000 companies across nine European countries and found that, over time, a $1 increase in corporate taxes reduced the wage bill by about 75 cents.[35]

Clemens Fuest, Andreas Peichl, and Sebastian Siegloch found a comparable result using German municipal data. Their 2018 study estimated that a €1 increase in corporate taxes reduced wages by about 51 cents.[36]

C. The Costs of Taxing Capital

Supporters of tax harmonization also favor common taxes on private capital, including wealth taxes on individuals and profit taxes on corporations. When personal wealth derives from corporate profits, imposing both taxes can amount to double taxation, with serious consequences for saving, investment, and growth.

The literature on corporate taxation forms part of a broader body of research on capital taxes. The Chamley-Judd theorem, developed independently by Christophe Chamley in 1986 and Kenneth Judd in 1985, shows that the optimal long-run tax rate on capital income approaches zero.[37]

The logic is straightforward. Capital taxes compound over time. Even modest rates can therefore impose large long-run welfare costs by discouraging the saving and investment that support future consumption.

Experience with wealth taxes points in the same direction. Most European countries that imposed annual net wealth taxes in 1990 later repealed or narrowed them. Austria abolished its tax in 1994. Denmark and Germany followed in 1997, the Netherlands in 2001, Finland, Iceland, and Luxembourg in 2006, and Sweden in 2007. France replaced its broad wealth tax in 2018 with a narrower tax on real estate.

Today, only a few OECD countries retain comprehensive annual net wealth taxes. They include Colombia, Norway, Spain, and Switzerland, where cantons impose the tax.[38]

Countries that tried annual wealth taxes often found them hard to administer, easy to avoid or evade, and costly relative to the modest revenue they produced.

D. Jurisdictional Competition and Better Governance

Charles Tiebout’s seminal 1956 paper showed how competition for mobile residents and businesses can discipline governments.[39] When people and firms can “vote with their feet,” jurisdictions face pressure to provide public goods efficiently and avoid excessive taxation.

Smaller jurisdictions that depend heavily on legal and financial services have especially strong incentives to offer clear law and low taxes. A jurisdiction that relies on mobile capital cannot afford arbitrary rules, legal instability, or tax rates that drive companies elsewhere.

The evidence reflects those incentives. Small jurisdictions that develop into financial centers often combine low or zero taxes on corporations and capital with effective government and reliable legal systems.[40]

Delaware taxes companies only on locally derived profits and operates a specialized court for corporate disputes. It supplies the corporate law used by most large U.S. companies.

The Cayman Islands impose no direct taxes and maintain a highly developed legal system, with the Judicial Committee of the Privy Council in the United Kingdom as the court of final appeal. Cayman has become the leading domicile for investment funds.

The British Virgin Islands also impose no direct taxes and use a legal system similar to Cayman’s. They have become a leading international jurisdiction for company formation, much like Delaware on a global scale.

Bermuda also uses the Privy Council as its highest court. It historically imposed no direct taxes, though it recently adopted the global minimum tax for qualifying companies. Several of the world’s largest reinsurance companies are based there.

Dubai, Singapore, and Hong Kong also rely to varying degrees on English law, maintain relatively low taxes, and operate as major financial centers.

These jurisdictions compete by offering legal certainty, adaptable regulation, and efficient administration. Offshore financial centers support dense networks of lawyers, accountants, professional directors, and trust and fund administrators. Their commercial success depends on maintaining the rule of law.

They also channel capital from developed countries into less developed ones. Investors can rely on the law of the financial center when the destination country’s legal system offers less certainty.[41] Development-finance institutions often route investments through these jurisdictions for the same reason.[42]

Competition has also changed corporate tax rates. Across OECD countries, the average statutory corporate tax rate fell from about 47% in 1980 to roughly 23% in 2023.[43] Corporate tax revenue nevertheless remained relatively stable at about 2.5% to 3.5% of gross domestic product.[44]

Lower rates may have broadened the tax base by reducing incentives for avoidance and attracting investment. As a result, corporate tax revenue held steady or, in some countries, increased.

E. No Race to the Bottom

The tax-harmonization agenda rests on a central empirical claim that tax competition creates a “race to the bottom” and erodes government revenue. The data do not support it.[45]

Romer and Romer found that 45% to 90% of corporate tax cuts were self-financing. Lower corporate rates increased economic activity enough that revenue gains from other taxes offset much of the initial loss.[46]

OECD data tell a similar story. Between 1965 and 2022, the unweighted average tax-to-GDP ratio across OECD countries rose from about 25% to nearly 34%.[47] Corporate tax revenue also trended upward.

Tax systems have become more progressive at the same time. In the United Kingdom, the top 1% of earners paid about 11% of income tax in 1978-79 and roughly 29% in 2023-24.[48] In the United States, the top 1% paid 14.1% of all federal taxes in 1979 and 27.3% in 2022.[49]

Corporate tax rates therefore fell while total revenue remained stable or increased, tax-to-GDP ratios rose, and higher earners paid a larger share of the tax burden. Competition reduced one of the taxes most harmful to growth without weakening governments’ fiscal capacity. That record contradicts the premise behind the harmonization project.

IV. The Coalition Behind Tax Harmonization

If tax competition generally promotes growth and disciplines government, why has tax harmonization gained so much institutional support? This section answers that question through the Democratically Deficient Organizations (DoDO) framework.

The framework explains how politicians, intergovernmental bodies, advocacy groups, unions, foundations, academics, and corporations can pursue shared policies despite limited electoral accountability. Their motives differ, but their interests often align around higher and more uniform taxes on corporations and capital.

This section first explains how DoDO coalitions form and operate. It then identifies the main organizations supporting tax harmonization, examines the incentives that sustain their cooperation, and shows how moral language and claims of consensus narrow the range of acceptable debate.

A. How DoDOs Form and Operate

The DoDO framework explains how policies emerge through institutions that lack direct electoral accountability. It applies to organizations with no democratic mandate, such as corporations, nongovernmental organizations, and foundations, as well as institutions whose authority is several steps removed from voters, such as government agencies and intergovernmental bodies.

The framework starts from a simple claim. These organizations often pursue ideological goals, material interests, or both. They may coordinate directly or move in parallel toward the same ends, even when those ends conflict with the broader interests of voters.

The framework also draws on the principal-agent problem. When principals delegate authority to agents, they surrender some control, and agents rarely carry out their wishes perfectly. Economists have long studied this problem.[50]

In government, the gap between principals and agents grows wider. Modern states operate through large bureaucracies that most voters cannot closely observe.[51] Voters also disagree among themselves, leaving politicians considerable discretion. When politicians delegate authority to agencies or intergovernmental organizations, the connection between voter preferences and policy weakens further. That creates more room for outside organizations to influence officials.

The DoDO framework builds on two related theories of political behavior. The first is Bruce Yandle’s Baptist-and-Bootlegger coalition. The second is Timur Kuran and Cass Sunstein’s theory of availability cascades.

Yandle used Sunday liquor restrictions to explain how moral campaigners and commercial interests can support the same rule for different reasons. Baptists favored the restrictions on religious and moral grounds. Bootleggers favored them because limits on lawful sales increased demand for illicit alcohol. The groups did not need to coordinate. They merely preferred the same policy.

Kuran and Sunstein’s availability-cascade theory explains how ideas gain political force through salience and repetition.[52] People have limited attention and tend to focus on risks that come readily to mind. A dramatic event, sustained campaign, or repeated claim can make an issue seem more common or urgent than the evidence supports.

“Availability entrepreneurs” then amplify the concern. News coverage expands, public anxiety grows, and policymakers begin to treat the claim as settled fact.

A DoDO network can generate and reinforce these cascades. Advocacy groups frame problems in alarming terms because alarm attracts attention, donations, and political support. Journalists repeat those claims because alarming stories draw readers. Politicians embrace proposed remedies because they fear electoral punishment. Foundations and companies fund supportive research. Agencies cite that research to justify larger mandates.

As the cascade builds, committees, reports, and commissions follow. Laws and treaties may come next. New institutions then acquire staff, budgets, and constituencies with an interest in preserving them. Claims of consensus and necessity reinforce the arrangement.

Each participant may act rationally according to its own incentives. The combined result can still work against the public interest.

B. The Tax-Harmonization Coalition

The tax-harmonization DoDO ecosystem brings together politicians in high-tax countries, intergovernmental bodies, advocacy groups, public-sector unions, foundations, academics, and coordinating organizations. Each group has distinct motives, but their efforts reinforce one another.[53]

1.               High-Tax Politicians

Politicians in high-tax countries such as the United States, United Kingdom, Germany, and France favor corporate taxes partly because they can present them as taxes on businesses rather than individuals. Polling consistently shows that voters prefer taxes they believe someone else will pay.[54]

During the postwar era, capital controls and relatively closed national markets limited the mobility of corporate tax bases. Governments therefore had more freedom to impose high statutory corporate tax rates.[55]

That freedom narrowed after countries began removing capital controls in the late 1970s, trade barriers fell, and financial transactions moved online. Investors could more easily structure transactions through jurisdictions offering low or zero taxes and reliable legal systems.[56] High-tax countries responded by reducing corporate tax rates and improving their legal and fiscal offerings, as Section III describes.[57]

Many politicians still wanted to tax profits earned elsewhere, but unilateral action created a coordination problem. Each government had an incentive to cut its own rate to attract investment. Their answer was coordinated restraint on tax competition.[58]

2.               The OECD Tax Cartel

As early as 1977, high-tax countries used the OECD to advance a “Recommendation of the Council on Tax Evasion and Avoidance.” It declared that “tax avoidance and evasion are contrary to fiscal equity, have serious budgetary effects and distort international competition.”[59]

The recommendation directed the OECD’s Committee on Fiscal Affairs “to pursue a programme of work to facilitate the anti-avoidance and evasion procedures of Member countries and improve the means available for international co-operation and exchanges of information and experiences.”[60] That work produced a series of reports and, eventually, the Base Erosion and Profit Shifting initiative.

This agenda appears to conflict with the OECD’s stated mission of promoting economic growth.[61] The organization has long supported treaties that reduce double taxation, and its own research finds that corporate taxes impose especially large costs on growth.

Andrew P. Morriss and Lotta Moberg attribute the shift to the OECD’s institutional incentives:

We ask why the OECD evolved from a forum focused on lowering transactions costs to increase private sector competition across borders into a cartel aimed at restricting competition among states. We conclude that this transition was in part the result of entrepreneurship by a group of OECD staff who spotted an opportunity to expand their mission, yielding a concomitant increase in resources and prestige. They accomplished this by providing a framework for interests within a group of high tax states to create a cartel that would channel competition in tax policy away from areas where those states had a competitive disadvantage and toward areas in which they had a competitive advantage.[62]

The OECD does not act alone. The European Union reinforces BEPS through its blacklist and related tax rules. The OECD/G20 Inclusive Framework, though lacking formal legal authority, creates the appearance of broad participation while implementing rules designed largely by a small group of powerful countries.

The EU also funds organizations that support tax harmonization. It helped establish the EU Tax Observatory, whose International Tax Observatory is directed by Gabriel Zucman. The organization says it conducts research, promotes democratic debate, and connects researchers, advocacy groups, and policymakers. Its work largely supports progressive income taxation, coordinated corporate taxes, and wealth taxes as responses to inequality.

3.               Advocacy Groups

Organizations such as the Tax Justice Network, Oxfam, Christian Aid, and the Global Alliance for Tax Justice supply moral and political support for international limits on tax competition.

Their campaigns frame corporate taxation as a question of fairness, redistribution, and corporate responsibility. They argue that competition creates a “race to the bottom” in corporate tax rates.[63]

These groups often claim that low-tax jurisdictions divert money that could fund hospitals or schools and help companies and wealthy individuals avoid paying their “fair share.” Such claims can fuel availability cascades directed against low-tax jurisdictions, multinational companies, and wealthy individuals.

The campaigns also give politicians political cover to support BEPS, wealth taxes, corporate-tax coordination, and the proposed United Nations tax convention.

4.               Public-Sector Unions

Public-sector unions support high corporate tax rates for two main reasons. They believe higher rates increase the revenue available for public spending, including member salaries. Higher taxes on private companies can also weaken the case for contracting public services to private providers, helping protect union jobs.

Unions including the AFL-CIO, the American Federation of Teachers, the Service Employees International Union, and Local 23 support tax-harmonization campaigns through donations, lobbying, coalition participation, and publications.[64]

Public Services International represents more than 30 million public-sector workers and co-publishes the annual “State of Tax Justice” reports. In 2022, it established the Network of Unions for Tax Justice, which includes more than 30 unions across four continents.[65] The International Trade Union Confederation has declared that “tax justice is workers’ justice.”[66]

5.               Foundations and Governments

Public-sector unions provide only part of the funding behind tax-harmonization campaigns. Large U.S. foundations, including the Ford Foundation and Open Society Foundations, have also funded the Tax Justice Network and related groups.[67]

The same foundations may support research, advocacy, and intergovernmental organizations. That funding structure can make a relatively narrow donor base appear to represent broad agreement.

Governments also fund organizations that lobby for policies those governments support. The European Union finances several pro-tax advocacy groups. The European Commission created the EU Tax Observatory with a €1.2 million grant.[68] Norway’s aid agency, Norad, has funded the Tax Justice Network, while the Finnish and Dutch foreign ministries have supported tax-justice groups through development budgets.

Christopher Snowdon calls this the “sock puppet” phenomenon. Governments fund advocacy groups that then lobby for the same policies.[69]

6.               The Academic Network

Much of the academic case for tax harmonization relies on the concept of “profit misalignment.” The term resembles “profit shifting,” but the two measure different things.

Profit-shifting research asks whether companies contractually move profits to lower-tax jurisdictions under existing law. Profit-misalignment research begins with a hypothetical allocation based largely on where a company’s employees and physical assets are located. Profits count as “misaligned” whenever the actual allocation differs from that model.

This method tends to produce much larger estimates of profits attributed to low-tax jurisdictions than conventional measures of profit shifting. Many studies using the Tax Justice Network’s version of profit misalignment were written by its staff and affiliates, including Chief Executive Alex Cobham and adviser Petr Janský.[70]

7.               ICRICT

In 2015, many of the leading organizations in the tax-harmonization coalition created the Independent Commission for the Reform of International Corporate Taxation (ICRICT). Its website describes its origins:

ICRICT was initiated by a coalition of the following intergovernmental, civil society and labor organizations: Action Aid, Alliance-Sud, the Arab NGO Network for Development, the Center for Economic and Social Rights, Christian Aid, the Council for Global Unions, the Global Alliance for Tax Justice, Oxfam, Public Services International, Tax Justice Network, South Center and the World Council of Churches. The creation and work of ICRICT is supported by Action Aid, Laudes Foundation, Luminate, The Open Society Foundation and the Wellspring Philanthropic Fund.[71]

ICRICT’s commissioners include prominent advocates of higher taxes on corporations and capital. The organization describes them as “a group of leaders from around the world who believe that, at this moment in history, there is both an urgent need and an unprecedented opportunity to bring about significant reform of the international corporate taxation system.”[72]

Its reports promote reforms that extend beyond the OECD’s original agenda. Its first report criticized BEPS for treating companies within a multinational group as separate legal entities rather than as a single enterprise.[73]

Some of ICRICT’s proposals later appeared in the OECD/G20 global minimum tax, including the principle of a corporate-tax floor. ICRICT nevertheless considers the agreement too weak. It favors a 25% minimum rate rather than 15%, broader reallocations of taxing rights, and a U.N.-led Framework Convention on International Tax Cooperation.[74]

C. Moralizing Tax Policy

The DoDO ecosystem’s most corrosive method of manufacturing consensus may be the treatment of fiscal policy as a moral test. Terms such as “tax justice,” “tax abuse,” and “illicit flows” recast disputes over tax policy as contests between virtue and vice.

Under this framing, jurisdictions that choose low tax rates commit “abuse,” while companies that lawfully reduce their tax liabilities engage in “base erosion.” Legitimate disagreement becomes moral deviance.

That rhetoric weakens democratic self-correction. Once dissent is treated as evidence of bad faith, policymakers have less reason to confront competing evidence or reconsider failed assumptions.

V.   Conclusions and Policy Recommendations

The tax-harmonization campaign rests on a claim the evidence does not support. Tax competition has not produced a fiscal “race to the bottom.” OECD research identifies corporate income taxes as especially harmful to growth, yet statutory corporate rates fell for decades while total tax revenue rose.[75] Corporate-tax receipts remained stable or increased, and high-income taxpayers paid a growing share of the total burden.

Competition among jurisdictions also encouraged governments to improve company law, legal certainty, and administrative efficiency. Harmonization weakens that discipline. It protects high-tax governments from competitive pressure while shifting authority toward institutions several steps removed from voters.

The resulting system also suffers from an accountability problem. Intergovernmental bodies, advocacy groups, unions, foundations, and affiliated researchers reinforce one another’s claims, often using moral language to present contested policy choices as settled obligations. That process narrows democratic debate and allows institutions without direct electoral mandates to shape national tax policy.

Reform should restore sovereignty, accountability, and subsidiarity.

A. Abandon the Global Minimum Tax

Pillar Two is a coordinated effort by governments to restrain competition over corporate tax rates. It suppresses the same competitive pressure that helped reduce one of the taxes most damaging to investment, productivity, and wages.

The United States has not adopted Pillar Two, and the OECD’s side-by-side arrangement already weakens the claim that the regime establishes a coherent global standard. Governments should abandon Pillar Two rather than preserve an unstable system of top-up taxes, retaliatory measures, and overlapping claims to the same profits.

B. Reject the U.N. Tax Convention

National governments should retain authority over their own tax systems, including the power to compete for investment and mobile capital. That authority forms part of fiscal sovereignty and helps discipline public spending and taxation.[76]

The proposed U.N. Framework Convention on International Tax Cooperation would add another layer of supranational control to an already extensive OECD-led system. Governments should reject it.

C. Reform the EU Blacklist

The European Union should stop using blacklisting to pressure sovereign jurisdictions into adopting tax policies designed by the OECD and EU. The current system applies standards to third countries that the EU does not consistently impose on its own members.

Any remaining review process should focus narrowly on fraud, secrecy, and refusal to exchange legally required information. It should not punish jurisdictions merely for choosing low tax rates.

D. End Government Funding for Tax Campaigns

Governments should stop funding advocacy groups and research organizations that campaign for policies those same governments support. Public financing of the Tax Justice Network, the EU Tax Observatory, and similar organizations blurs the line between independent research and state-sponsored advocacy.

Research used to justify international tax rules should disclose its funding, methods, institutional affiliations, and potential conflicts. Policymakers should also distinguish estimates of unlawful evasion or actual profit shifting from models that label profits “misaligned” because they depart from a hypothetical allocation.

The postwar international order created institutions to help sovereign states cooperate, not to replace democratic control over domestic policy. International tax coordination has drifted well beyond preventing double taxation and exchanging information. It now seeks to determine minimum rates, reallocate taxing rights, and penalize governments that choose different policies.

That drift carries economic and political costs.[77] It weakens competition, burdens investment and wages, and transfers power away from voters. Restoring fiscal sovereignty would strengthen both economic growth and democratic accountability.

[1] From a lecture recorded by Dugald Stewart. See Kwok Ping Tsang, Is the 1755 Smith the Prequel of the 1776 Smith?, Adam Smith Works (Oct. 6, 2021), https://www.adamsmithworks.org/documents/tsang-1775-adam-smith-1776-prequel.

[2] Charles M. Tiebout, A Pure Theory of Local Expenditures, 64 J. Pol. Econ. 416, 416–24 (1956).

[3] Id. at 424 (“If consumer-voters are fully mobile, the appropriate local governments, whose revenue-expenditure patterns are set, are adopted by the consumer-voters. While the solution may not be perfect because of institutional rigidities, this does not invalidate its importance. The solution, like a general equilibrium solution for a private spatial economy, is the best that can be obtained given preferences and resource endowments.”).

[4] Companies also typically consider the availability of skilled labor and other factors tied to public goods.

[5] Julian Morris, Defending Democracy from the DoDOs: How Power Escapes Democratic Control, Int’l Ctr. for L. & Econ. (Mar. 12, 2026), https://laweconcenter.org/resources/defending-democracy-from-the-dodos-part-i-how-power-escapes-democratic-control. As explained below, the DoDO framework builds on and extends Bruce Yandle’s Baptist-and-Bootlegger theory. See Bruce Yandle, Bootleggers and Baptists—The Education of a Regulatory Economist, 7 Regulation 12, 12–16 (1983); Adam Smith & Bruce Yandle, Bootleggers and Baptists: How Economic Forces and Moral Persuasion Interact to Shape Regulatory Politics 15–40 (Cato Inst. 2014). It also draws on broader insights from the public-choice school.

[6] Org. for Econ. Co-operation & Dev. (OECD), Draft Double Taxation Convention on Income and Capital 1963 7 (Oct. 19, 1963), https://www.oecd.org/en/publications/draft-double-taxation-convention-on-income-and-capital_9789264073241-en.html.

[7] Id.

[8] OECD, Model Tax Convention on Income and on Capital 2017 (Full Version) (Apr. 25, 2019), https://www.oecd.org/en/publications/model-tax-convention-on-income-and-on-capital-2017-full-version_g2g972ee-en.html; OECD, The 2025 Update to the OECD Model Tax Convention (Nov. 19, 2025), https://www.oecd.org/en/publications/2025/11/the-2025-update-to-the-oecd-model-tax-convention_c7031e1b.html.

[9] OECD, Meeting of the Council at Ministerial Level, Paris, 21–22 May 1996, Communiqué (1996), https://government.is/news/article/1996-05-21-Statement-at-the-Meeting-of-the-OECD-Council-at-Ministerial-Level-Paris-May-21-22-1996.

[10] OECD, Harmful Tax Competition: An Emerging Global Issue (May 19, 1998), https://www.oecd.org/en/publications/1998/04/harmful-tax-competition_g1ghgc60.html.

[11] U.S. Dep’t of the Treasury, Treasury Secretary O’Neill Statement on OECD Tax Havens (May 10, 2001), https://home.treasury.gov/news/press-releases/po366.

[12] G20, G20 Leaders’ Declaration: Los Cabos Summit (June 2012), https://www.g20.utoronto.ca/2012/2012-0619-loscabos.html; OECD, Addressing Base Erosion and Profit Shifting (Feb. 2013), https://www.oecd.org/en/publications/2013/02/addressing-base-erosion-and-profit-shifting_g1g2a9bc.html.

[13] One well-known example was the “Double Irish,” a tax-planning structure widely used by technology and pharmaceutical companies.

[14] OECD, Action Plan on Base Erosion and Profit Shifting (2013), https://doi.org/10.1787/9789264202719-en.

[15] OECD, Members of the OECD/G20 Inclusive Framework on BEPS (updated Dec. 5, 2025), https://www.oecd.org/content/dam/oecd/en/topics/policy-issues/beps/inclusive-framework-on-beps-composition.pdf.

 [16] See generally Jakob Vestergaard & Robert H. Wade, Establishing a New Global Economic Council: Governance Reform at the G20, the IMF and the World Bank, 3 Glob. Pol’y 257, 257–69 (2012), https://doi.org/10.1111/j.1758-5899.2012.00169.x.

[17] OECD, Harmful Tax Practices, https://www.oecd.org/en/topics/harmful-tax-practices.html (last visited June 16, 2026); OECD, Harmful Tax Practices—2018 Progress Report on Preferential Regimes: Inclusive Framework on BEPS: Action 5, OECD/G20 Base Erosion & Profit Shifting Project (OECD Publ’g 2018), https://doi.org/10.1787/9789264311480-en; OECD, Substantial Activities in No or Only Nominal Tax Jurisdictions: Additional Guidance for the Spontaneous Exchange of Information and Opt-In Notification Template 7 (2021), https://www.oecd.org/content/dam/oecd/en/topics/policy-sub-issues/harmful-tax-practices/substantial-activities-in-no-or-only-nominal-tax-jurisdictions-guidance.pdf.

[18] Council of the Eur. Union, Criteria for Establishing the EU List of Non-Cooperative Jurisdictions for Tax Purposes (last reviewed Jan. 11, 2024), https://www.consilium.europa.eu/en/policies/eu-list-of-non-cooperative-jurisdictions/criteria; Council of the Eur. Union, EU List of Non-Cooperative Jurisdictions for Tax Purposes (last reviewed Feb. 17, 2025), https://www.consilium.europa.eu/en/policies/eu-list-of-non-cooperative-jurisdictions.

[19] OECD, Tax Challenges Arising from Digitalisation of the Economy—Global Anti-Base Erosion Model Rules (Pillar Two) (Dec. 2021).

[20] Press Release, Republican Members of the U.S. House Comm. on Ways & Means, At OECD, Chairman Smith Warns That Congress Will Reject New Job-Killing Global Tax Surrender (Sept. 1, 2023), https://waysandmeans.house.gov/2023/09/01/at-oecd-chairman-smith-warns-that-congress-will-reject-new-job-killing-global-tax-surrender.

[21] OECD/G20 Inclusive Framework on BEPS, Side-by-Side Package (Jan. 5, 2026), https://www.oecd.org/content/dam/oecd/en/topics/policy-sub-issues/global-minimum-tax/side-by-side-package.pdf; see also Gary Clyde Hufbauer, How US Multinationals Escaped the Global Minimum Corporate Tax, Peterson Inst. for Int’l Econ. (July 7, 2025), https://www.piie.com/blogs/realtime-economics/2025/how-us-multinationals-escaped-global-minimum-corporate-tax.

[22] OECD, Multilateral Convention to Implement Amount A of Pillar One (Oct. 11, 2023), https://www.oecd.org/content/dam/oecd/en/topics/policy-issues/cross-border-and-international-tax/multilateral-convention-to-implement-amount-a-of-pillar-one.pdf.

[23] G.A. Res. 78/230, U.N. Doc. A/RES/78/230 (Dec. 22, 2023); G.A. Res. 79/235, U.N. Doc. A/RES/79/235 (Dec. 24, 2024); Jonathan Shrier, U.S. Deputy Representative to the U.N. Econ. & Soc. Council, Explanation of Vote on the United Nations Framework Convention on International Tax Cooperation (Aug. 16, 2024), U.S. Mission to the U.N., https://usun.usmission.gov/explanation-of-vote-on-the-united-nations-framework-convention-on-international-tax-cooperation; Foreign, Commonwealth & Dev. Off. & Tara Soomro, Ambassador to ECOSOC, This Resolution Did Not Provide Sufficient Reassurance for Our Concerns: UK Explanation of Vote at the UN Second Committee (Nov. 27, 2024), https://www.gov.uk/government/speeches/this-resolution-did-not-provide-sufficient-reassurance-for-our-concerns-uk-explanation-of-vote-at-the-un-second-committee.

[24] Tsang, supra note 1.

[25] Åsa Johansson, Christopher Heady, Jens Arnold, Bert Brys & Laura Vartia, Taxation and Economic Growth, OECD Econ. Dep’t, Working Paper No. 620, 11–14 (2008); see also OECD, Tax Policy Reform and Economic Growth 18–19 (2010).

[26] Simeon Djankov, Tim Ganser, Caralee McLiesh, Rita Ramalho & Andrei Shleifer, The Effect of Corporate Taxes on Investment and Entrepreneurship, 2 Am. Econ. J.: Macroeconomics 31 (2010).

[27] Terry Shevlin, Lakshmanan Shivakumar & Oktay Urcan, Macroeconomic Effects of Corporate Tax Policy, 68 J. Acct. & Econ. 101233 (2019), https://www.sciencedirect.com/science/article/abs/pii/S0165410119300205.

[28] Id.

[29] Christina D. Romer & David H. Romer, The Macroeconomic Effects of Tax Changes: Estimates Based on a New Measure of Fiscal Shocks, 100 Am. Econ. Rev. 763 (2010).

[30] Karel Mertens & Morten O. Ravn, The Dynamic Effects of Personal and Corporate Income Tax Changes in the United States, 103 Am. Econ. Rev. 1212 (2013).

[31] Tibor Hanappi, Valentine Millot & Sébastien Turban, How Does Corporate Taxation Affect Business Investment? Evidence from Aggregate and Firm-Level Data, OECD Econ. Dep’t, Working Paper No. 1765 (2023), https://doi.org/10.1787/04e682d7-en.

[32] Michael Christl & Monika Köppl-Turyna, Competitiveness of the Tax System and Economic Growth, Glob. Lab. Org. Discussion Paper No. 1754 (2026), https://www.econstor.eu/bitstream/10419/340903/1/GLO-DP-1754.pdf.

[33] Era Dabla-Norris & Frederico Lima, Macroeconomic Effects of Tax Rate and Base Changes: Evidence from Fiscal Consolidations, IMF Working Paper No. WP/18/220 (2018), https://www.imf.org/-/media/files/publications/wp/2018/wp18220.pdf. This accords with broader findings on tax rates. See, e.g., Eric Engen & Jonathan Skinner, Taxation and Economic Growth, 49 Nat’l Tax J. 617 (1996) (concluding that a 5-percentage-point reduction in marginal tax rates would increase long-run annual GDP growth by 0.2 to 0.3 percentage points).

[34] Arnold C. Harberger, The Incidence of the Corporation Income Tax, 70 J. Pol. Econ. 215 (1962).

[35] Wiji Arulampalam, Michael P. Devereux & Giorgia Maffini, The Direct Incidence of Corporate Income Tax on Wages, 56 Eur. Econ. Rev. 1038 (2012).

[36] Clemens Fuest, Andreas Peichl & Sebastian Siegloch, Do Higher Corporate Taxes Reduce Wages? Micro Evidence from Germany, 108 Am. Econ. Rev. 393 (2018).

[37] Christophe Chamley, Optimal Taxation of Capital Income in General Equilibrium with Infinite Lives, 54 Econometrica 607 (1986); Kenneth L. Judd, Redistributive Taxation in a Simple Perfect Foresight Model, 28 J. Pub. Econ. 59 (1985).

[38] OECD, The Role and Design of Net Wealth Taxes in the OECD, OECD Tax Pol’y, Stud. No. 26 (2018). Of the 12 European countries that imposed annual net wealth taxes in 1990—Austria, Denmark, Finland, France, Germany, Iceland, Italy, Luxembourg, the Netherlands, Spain, Sweden, and Switzerland—nine later repealed them: Austria (1994), Denmark (1997), Germany (1997), the Netherlands (2001), Finland (2006), Iceland (2006), Luxembourg (2006), Sweden (2007), and France (2017). See id. at 15–20; see also PricewaterhouseCoopers, Net Wealth/Worth Tax Rates (2026), https://taxsummaries.pwc.com/quick-charts/net-wealth-worth-tax-rates (last visited June 8, 2026).

[39] Tiebout, supra note 2.

[40] Dhammika Dharmapala & James R. Hines Jr., Which Countries Become Tax Havens?, 93 J. Pub. Econ. 1058 (2009); James R. Hines Jr. & Eric M. Rice, Fiscal Paradise: Foreign Tax Havens and American Business, 109 Q.J. Econ. 149 (1994).

[41] Judith Tyson, International Financial Centres and Development Finance (ODI Glob. 2021), https://www.econstor.eu/bitstream/10419/193660/1/106743190X.pdf.

[42] Paddy Carter, Why Do Development Finance Institutions Use Offshore Financial Centres? (ODI Glob. Oct. 2017), https://odi.org/en/publications/why-do-development-finance-institutions-use-offshore-financial-centres.

[43] Michael P. Devereux, Rachel Griffith & Alexander Klemm, Corporate Income Tax Reforms and International Tax Competition, 35 Econ. Pol’y 449 (2002); Ruud A. de Mooij & Sjef Ederveen, Taxation and Foreign Direct Investment: A Synthesis of Empirical Research, 10 Int’l Tax & Pub. Fin. 673 (2003); OECD, Corporate Tax Statistics 20–24 (2023); Tax Found., Corporate Tax Rates Around the World (2023) (showing the GDP-weighted average corporate tax rate fell from about 47% in 1980 to about 23% in 2023).

[44] OECD, Corporate Tax Statistics, supra note 44, at 20–24.

[45] Ruud A. de Mooij & Sjef Ederveen, Corporate Tax Elasticities: A Reader’s Guide to Empirical Findings, 24 Oxford Rev. Econ. Pol’y 680 (2008).

[46] Romer & Romer, supra note 30.

[47] OECD, Revenue Statistics 2023 15–18 (2023). Between 1965 and 2022, the unweighted average tax-to-GDP ratio across OECD countries rose from about 24.9% to 34.0%.

[48] Inst. for Fiscal Stud., Income Tax Explained, IFS TaxLab (Nov. 22, 2023), https://ifs.org.uk/taxlab/taxlab-taxes-explained/income-tax-explained.

[49] Cong. Budget Off. (CBO), The Distribution of Household Income 2022 (2026), https://www.cbo.gov/publication/62300.

[50] See, e.g., Armen A. Alchian & Harold Demsetz, Production, Information Costs, and Economic Organization, 62 Am. Econ. Rev. 777, 777–95 (1972); Michael C. Jensen & William H. Meckling, Theory of the Firm: Managerial Behavior, Agency Costs and Ownership Structure, 3 J. Fin. Econ. 305, 305–60 (1976); Eugene F. Fama, Agency Problems and the Theory of the Firm, 88 J. Pol. Econ. 288, 288–307 (1980); Eugene F. Fama & Michael C. Jensen, Separation of Ownership and Control, 26 J.L. & Econ. 301, 301–25 (1983).

[51] See, e.g., Anthony Downs, Inside Bureaucracy (Little, Brown & Co. 1967); William A. Niskanen Jr., Bureaucracy and Representative Government (Aldine-Atherton 1971); Barry R. Weingast & Mark J. Moran, Bureaucratic Discretion or Congressional Control? Regulatory Policymaking by the Federal Trade Commission, 91 J. Pol. Econ. 765, 765–800 (1983); Mathew D. McCubbins & Thomas Schwartz, Congressional Oversight Overlooked: Police Patrols Versus Fire Alarms, 28 Am. J. Pol. Sci. 165, 165–79 (1984).

[52] Timur Kuran & Cass R. Sunstein, Availability Cascades and Risk Regulation, 51 Stan. L. Rev. 683 (1999).

[53] For a detailed and insightful account of the competing interests among politicians, bureaucrats, businesses, and the OECD in international tax policy, see Andrew P. Morriss & Lotta Moberg, Cartelizing Taxes: Understanding the OECD’s Campaign Against “Harmful Tax Competition”, 4 Colum. J. Tax L. 1 (2012), https://scholarship.law.tamu.edu/facscholar/53.

[54] Dan Neidle, Has Britain Run Out of Other People to Tax?, Tax Pol’y Assocs. (June 5, 2026), https://taxpolicy.org.uk/2026/06/05/taxing-other-people-uk.

[55] Philipp Genschel, Globalization, Tax Competition, and the Welfare State, 30 Pol. & Soc’y 245 (2002).

[56] Morriss & Moberg, supra note 54

[57] Michael P. Devereux, Ben Lockwood & Michela Redoano, Do Countries Compete over Corporate Tax Rates?, 92 J. Pub. Econ. 1210 (2008); Michael P. Devereux, Developments in the Taxation of Corporate Profit in the OECD Since 1965: Rates, Bases and Revenues, Oxford Univ. Ctr. for Bus. Tax’n, Working Paper No. 07/04 (2007).

[58] See Morriss & Moberg, supra note 54.

[59] OECD, Issues in International Taxation No. 1: International Tax Avoidance and Evasion 11 (1987).

[60] Id.

[61] The OECD’s founding convention defines its mission as: “(a) to achieve the highest sustainable economic growth and employment and a rising standard of living in Member countries, while maintaining financial stability, and thus contribute to the development of the world economy; (b) to contribute to sound economic expansion in Member as well as non-member countries in the process of economic development; and (c) to contribute to the expansion of world trade on a multilateral non-discriminatory basis in accordance with international obligations.” OECD, Convention on the Organisation for Economic Co-operation and Development art. 1 (Dec. 14, 1960), https://www.oecd.org/en/about/legal/text-of-the-convention-on-the-organisation-for-economic-co-operation-and-development.html.

[62] Morriss & Moberg, supra note 54, at 4.

[63] See, e.g., Tax Just. Network et al., The State of Tax Justice 2020: Tax Justice in the Time of COVID-19 (2020); Esmé Berkhout, Oxfam, Tax Battles: The Dangerous Global Race to the Bottom on Corporate Tax (2016); Sally Golding et al., Tax Justice Advocacy: A Toolkit for Civil Society (Christian Aid 2011); Christian Aid, Death and Taxes: The True Toll of Tax Dodging (2008); Glob. All. for Tax Just., Tax Justice at the World Social Forum (Aug. 2, 2016); Tax Just. Network, Tax Competition and the Race to the Bottom (2020).

[64] FACT Coal., Coalition Members and Supporters, https://thefactcoalition.org/about-us/coalition-members-and-supporters (last visited June 18, 2026).

[65] Pub. Servs. Int’l (PSI), Tax Programme, https://publicservices.international/resources/page/tax?id=9469 (last visited June 18, 2026). PSI established the Network of Unions for Tax Justice (NUTJ) in 2022, which includes more than 30 trade unions across four continents. PSI is also a founding member of the Independent Commission for the Reform of International Corporate Taxation (ICRICT).

[66] Int’l Trade Union Confederation (ITUC), Tax Justice Is Workers’ Justice (2023). In 2015, the Dutch trade-union federation FNV funded a two-year PSI project with affiliate unions in Ghana focused on tax justice.

[67] Ford Found., Grants Database (Grant No. 106264) (awarding Tax Justice Network Ltd. £532,500 (2016–17) and $2,000,000 (2018)); Norad, Combating Fiscal Fraud and Empowering Regulators Programme (£655,200); Eur. Comm’n, Combating Fiscal Fraud and Empowering Regulators Programme (£619,160); Open Soc’y Found., Grant to Tax Just. Network ($180,000 (2019)); Adessium Found., Grant to Tax Just. Network (£261,000 (2017)); Wallace Glob. Fund, Grants to Tax Just. Network ($40,000 annually (2018–19)); Ford Found., Grants Database (Grant No. 128687) (awarding Glob. All. for Tax Just. $505,000 (2017–19)).

[68] Eur. Comm’n, Directorate-Gen. for Tax’n & Customs Union, EU Tax Observatory Establishment Grant (€1.2 million (2020–21)); see also Paris Sch. of Econ., EU Tax Observatory, https://www.taxobservatory.eu (last visited June 18, 2026).

[69] Christopher Snowdon, Sock Puppets: How the Government Lobbies Itself and Why (Inst. of Econ. Aff. 2012).

[70] Julian Morris, Updated Survey of the “Profit Misalignment” Literature (on file with author and available on request, Mar. 2026). See, e.g., Alex Cobham & Petr Janský, Measuring Misalignment: The Location of US Multinationals’ Economic Activity Versus the Location of Their Profits, 37 Dev. Pol’y Rev. 91 (2019). Janský is a researcher at Charles University, a coauthor of the Tax Justice Network’s Corporate Tax Haven Index, and a named adviser to the Tax Justice Network’s State of Tax Justice 2020. The concept of “profit misalignment” derives from Alex Cobham & Simon Loretz, International Distribution of the Corporate Tax Base: Implications of Different Apportionment Factors Under Unitary Taxation (Int’l Ctr. for Tax & Dev. Nov. 2014).

[71] Indep. Comm’n for the Reform of Int’l Corp. Tax’n (ICRICT), About Us: The Coalition, https://www.icrict.com/about-us/the-coalition (last visited June 18, 2026).

[72] ICRICT, About Us: What’s ICRICT?, https://www.icrict.com/about-us (last visited June 18, 2026).

[73] ICRICT, Evaluation of the Independent Commission for the Reform of International Corporate Taxation for the Base Erosion and Profit-Shifting Project of the G20 and OECD (Oct. 2015), https://www.icrict.com/reports/icrict-beps-evaluation.

[74] ICRICT, ICRICT’s Statement on the Negotiation of a UN Framework Convention on International Tax Cooperation (UN FCITC) (Feb. 3, 2025), https://www.icrict.com/corporate-taxation/icricts-statement-on-the-negotiation-of-a-un-framework-convention-on-international-tax-cooperation-un-fcitc.

[75] Johansson et al., supra note 26.

[76] Tiebout, supra note 2.

[77] Freedom House, Freedom in the World 2025: The Human Cost of Democratic Decline (Feb. 2025), https://freedomhouse.org/sites/default/files/2025-02/FITW_World_2025_Feb.2025.pdf.

ICLE Issue Brief

Don’t Import the Distortion: Why MFN Drug Pricing Would Weaken U.S. Innovation

Executive Summary U.S. patients pay more than patients in other wealthy countries for the same branded prescription drugs, but that gap does not prove that the United States overpays. It...

Executive Summary

U.S. patients pay more than patients in other wealthy countries for the same branded prescription drugs, but that gap does not prove that the United States overpays. It reflects the systematic suppression of branded-drug prices abroad through monopsony purchasing, health-technology assessment, and external reference pricing. Most-favored-nation (MFN) pricing would respond by tying U.S. reimbursement to foreign prices. In April 2025, the U.S. Department of Commerce opened a Section 232 national-security investigation into imports of pharmaceuticals and pharmaceutical ingredients, and the Bureau of Industry and Security later moved toward an onshoring framework that conditions tariff relief on MFN pricing agreements.

That is the wrong remedy for a real problem. Foreign governments use pricing institutions to underpay for innovative medicines while shifting a disproportionate share of global pharmaceutical research and development costs onto U.S. patients and purchasers. But by tying U.S. reimbursement to foreign prices, MFN pricing would import the very distortion U.S. policy should confront.

The likely result would be lower expected returns on pharmaceutical R&D, fewer new drugs, and a shift away from high-risk therapies in areas such as rare disease, oncology, and neurology, where patients often have few or no alternatives. Evidence from pharmaceutical markets, Medicare reimbursement shocks, and related medical-device markets points in the same direction: compressing the revenue base that finances innovation reduces investment, weakens supply, and can push production offshore.

The better framework is to treat foreign pricing systems as anticompetitive market distortions when they suppress competitive returns, distort price formation, and free-ride on U.S.-financed innovation. The Department of Commerce should remove the MFN-pricing condition from the company-specific onshoring framework. Section 232 should function as a national-security tool, not a backdoor domestic price-control regime. The Office of the U.S. Trade Representative should instead pursue targeted trade enforcement and negotiations aimed at transparency, nondiscrimination, and a more proportionate foreign contribution to global pharmaceutical R&D.

I.   Introduction

U.S. patients pay more than patients in other wealthy countries for the same branded prescription drugs. That fact is not in dispute. The fight is over what it means—and what, if anything, U.S. policy should do about it.

Advocates of most-favored-nation (MFN) pricing read the gap as evidence that the United States overpays. Their proposed fix is to tie U.S. reimbursement to prices paid abroad. In practical terms, MFN pricing would make foreign prices a benchmark—or ceiling—for what U.S. programs pay for covered drugs.

That conclusion is wrong. The U.S.–foreign price gap does not show overpayment in any meaningful aggregate sense. Nor does it reflect competitive pricing abroad. It reflects the systematic suppression of branded-drug prices in foreign markets through three mechanisms: monopsony purchasing, health-technology assessment, and external reference pricing.

A monopsony exists when a dominant buyer can push prices below competitive levels. In pharmaceutical markets, that buyer is often a national health system or single-payer government program. Health-technology assessment (HTA) refers to administrative methods that estimate whether a drug’s expected health benefits justify its price. External reference pricing (ERP) means setting a domestic drug price by looking to prices charged in other countries. Together, these tools operate as industrial policy: foreign governments suppress prices for innovative drugs while shifting much of the cost of global pharmaceutical research and development (R&D) onto the United States.

The broader U.S. drug-pricing debate has increasingly moved toward importing those foreign benchmarks. The Centers for Medicare & Medicaid Services tried an MFN model for Medicare Part B in 2020, but courts blocked the rule and the agency later withdrew it. The Inflation Reduction Act of 2022 (IRA) created a Medicare “maximum fair price” negotiation program that is not formally MFN pricing but operates through similar administered-price mechanisms for selected high-revenue drugs. And in 2025, the U.S. Department of Commerce opened a Section 232 national-security investigation into imports of pharmaceuticals and pharmaceutical ingredients, asking whether foreign-government practices threaten domestic production capacity and supply-chain resilience. The Bureau of Industry and Security (BIS), a Commerce component, later moved toward an onshoring framework that conditions tariff relief on MFN pricing agreements.[1]

That is the wrong turn. The Section 232 investigation correctly identifies a real trade and national-security problem: foreign pricing institutions can weaken U.S. pharmaceutical interests by suppressing returns, shifting R&D costs to U.S. patients, and discouraging domestic production. But MFN pricing does not fix that distortion. It imports it.

Recent empirical work shows how strongly drug-development pipelines respond to expected U.S. revenue. A 20% reduction in expected U.S. pharmaceutical revenue—the upper end of what Congressional Budget Office (CBO) and academic models have projected for MFN- and IRA-style proposals—is associated with roughly 8.6% fewer new drugs developed by U.S. companies and 7.5% fewer new drugs developed by European companies. By contrast, a comparable cut to European revenue produces only about a 4% drop in U.S. drug development. The relationship is lopsided: U.S. revenues drive innovation around the world, while European revenues mostly drive innovation in Europe. Compressing the U.S. revenue base does not redistribute global pharmaceutical investment. It shrinks it.

The drugs that disappear from the pipeline would not be randomly distributed. When firms must triage portfolios under tighter revenue expectations, the projects most vulnerable to cancellation are those with the most marginal economics: breakthrough therapies for rare diseases, drugs for narrow patient subpopulations, and frontier programs in fields like neurology and oncology, where development costs and failure rates are highest. The patients who lose most are those whose conditions are hardest to treat and for whom no good alternative therapy exists.

Aggregate estimates therefore understate the welfare loss. They count the cancer-immunotherapy program that never starts the same as the line extension that never starts. The human cost of that shift cannot be measured with precision, but its direction is clear: patients least served by today’s medicine depend most heavily on preserving the revenue tail that makes tomorrow’s treatments worth pursuing.

The U.S.–foreign price gap is therefore not simply a pricing problem. It is a trade problem. Foreign governments use monopsony buying power, biased HTA, and reference pricing to suppress branded-drug prices below competitive levels and shift R&D costs onto U.S. patients. Importing those prices through MFN locks in the foreign distortion rather than confronting it.

This brief makes four claims.

First, the relevant distortion is concentrated in branded innovative drugs, not the prescription-drug market as a whole. Generics dominate U.S. prescription volume, and U.S. generic prices are low by international standards. The headline U.S.–foreign price gap comes from a narrow segment of patented drugs where foreign governments can capture U.S.-financed innovation returns.

Second, pharmaceutical price controls carry unusually high dynamic costs. Drug development requires large fixed investments, long timelines, high failure rates, and returns earned during a limited patent-protected window. MFN pricing would compress the price-cost margin that finances R&D, reduce expected innovation, and skew investment away from high-risk therapies whose social value may far exceed their reimbursement price.

Third, foreign pricing institutions can be understood as anticompetitive market distortions (ACMDs): government-backed interventions that suppress competition, distort price formation, and shift innovation costs across borders. That framework distinguishes legitimate domestic health policy from trade-distorting free-riding and gives policymakers a way to identify the specific foreign practices that warrant a U.S. response.

Fourth, the proper remedy is targeted trade enforcement, not domestic price imitation. ACMD-calibrated tariffs and negotiations can target the foreign institutions causing the distortion while preserving U.S. incentives for innovation and domestic production. MFN does the opposite. It uses trade authority to impose a domestic price-control regime that undermines the same pharmaceutical base Section 232 is supposed to protect.

Part II explains the branded-drug distortion and why international comparisons reveal foreign underpayment for innovative drugs rather than general U.S. overpayment. Part III examines the economics of pharmaceutical price controls, the empirical link between expected revenue and innovation, and why MFN pricing is a poor instrument even for those who favor lower U.S. prices. Part IV develops the ACMD framework and explains why targeted, distortion-calibrated trade enforcement is better suited to the foreign-pricing problem than broad tariffs or MFN pricing. Part V concludes with the policy recommendation: remove the MFN-pricing condition from the onshoring framework and address foreign price suppression directly through disciplined trade enforcement.

II.   The Branded-Drug Distortion

The central empirical fact in the most-favored-nation pricing debate is the mismatch between the U.S. share of global pharmaceutical spending and the U.S. share of global pharmaceutical profit. In 2022, the United States accounted for about 50% of worldwide prescription-drug revenue but only 13% of volume among countries covered by IQVIA MIDAS, a widely used pharmaceutical-sales database. Among OECD countries, the U.S. share was roughly 60% of revenue and 24% of volume.[2] The profit gap is even starker: although the United States accounts for roughly 34% of total OECD gross domestic product at purchasing-power parity, American consumers generate more than 70% of pharmaceutical profits across those countries.[3]

At first glance, per-drug price comparisons point in the same direction. U.S. prescription-drug prices average roughly 2.56 times those in OECD comparator countries overall and 3.44 times those comparators for branded drugs specifically.[4] Stopping there makes the United States look like the outlier that overpays.

But that framing focuses on a small, highly visible segment of the market: expensive branded medicines still under patent. Generics account for roughly nine of every 10 U.S. prescriptions, and U.S. generic prices are the lowest among peer countries.[5] When prescription costs are weighted by real-world prescribing volume rather than by the highest-priced branded medicines, net Medicare and Medicaid prescription costs are about 18% lower than those in Germany, France, the United Kingdom, Canada, and Japan.[6]

Foreign governments are not suppressing drug prices across the board. They target the narrow slice of branded innovative drugs where U.S.-funded R&D returns can be captured. That same slice drives the headline price comparisons.[7]

The result is a concentrated distortion, not a general U.S. pricing failure. Foreign systems use monopsony purchasing, HTA, and ERP to push branded-drug prices below competitive levels. Those tools distort price discovery, shift innovation costs to U.S. patients, and create a pricing ratchet in which one suppressed foreign price becomes another country’s benchmark. The policy question is not whether U.S. prices differ from foreign prices. They do. The question is whether the United States should import the distortion or confront it.

A. How Foreign Pricing Systems Suppress Branded-Drug Prices

Three mechanisms produce this distortion in branded-drug markets.

The first is centralized-negotiation monopsony.[8] A monopsony exists when a dominant buyer can push prices below competitive levels. Single-payer and national-health-service systems consolidate buying power that no private purchaser could replicate, then use that power to impose price ceilings on patented medicines. The basic economic effect is familiar: prices fall below competitive levels, quantity may fall as well, and surplus shifts from sellers to the buyer. The difference here is that the buyer is a sovereign and the seller is making long-horizon, option-valued investments in R&D.

The second mechanism is biased health-technology assessment. HTA agencies evaluate whether a drug’s expected health benefits justify its price. In practice, they often give public buyers a technical framework for setting reimbursement below willingness to pay. Once an HTA agency assigns a low “value” to a therapy, that figure becomes a reimbursement ceiling. And the methods often understate innovation’s value.

Germany’s Federal Joint Committee, known as G-BA, routinely refuses to recognize surrogate or intermediate endpoints—clinical-trial measures such as progression-free survival or HbA1c levels—unless manufacturers satisfy strict evidentiary requirements. That depresses assessed value for therapies whose most important benefits take years to observe.[9] The United Kingdom’s National Institute for Health and Care Excellence held its £20,000–£30,000 per quality-adjusted life-year threshold unchanged from 1999 until April 2026, when it raised the band modestly to £25,000–£35,000. That remains well below an inflation-adjusted equivalent of roughly £56,800, given cumulative U.K. inflation of about 90% over the same period.[10] France’s Comité Économique des Produits de Santé routinely ties each new drug to a five-year volume contract, with mandatory clawbacks of 50% to 70% of revenue above the agreed cap.[11]

These agencies also discount future health gains, which means they systematically underweight the long-term benefits of curative or disease-modifying therapies. The calculation may look technocratic. The effect is not. It pushes prices lower for treatments whose social value may unfold over decades.

The third mechanism is external reference pricing. Under ERP, governments set domestic prices by looking to prices charged in other countries. The method turns one country’s suppressed price into another country’s ceiling.

Canada’s 2022 move to the Patented Medicine Prices Review Board 11 basket deliberately removed the United States and Switzerland—its two highest-price comparators—and substituted six mid-priced OECD countries.[12] Canada’s parliamentary budget officer estimated that the change would have cut 2018 spending on patented drugs by about 19%.[13]

South Korea’s “two-waiver” pathway goes further. A drug must first be priced below the lowest figure in the “A7” high-income comparator countries, which include the United States. The National Health Insurance Service then references OECD countries outside the A7, expressly omitting U.S. prices.[14] The result is a pricing ratchet: the most suppressed foreign price becomes the benchmark for still more suppression elsewhere.

B. Anticompetitive Market Distortions

Together, these institutions create what this paper terms an anticompetitive market distortion (ACMD). Foreign governments use monopsony buying power, HTA, and administratively imposed price ceilings to hold manufacturer revenues below competitive levels. They replace market-based price formation with government price-setting. The immediate harm is not fewer competitors. It is a distorted price-discovery process. The downstream consequence is a distorted global allocation of R&D costs.

These institutions qualify as ACMDs because they suppress prices below competitive levels and substantially lessen competition without any overriding public-policy justification relative to a system that internalizes the costs of pharmaceutical innovation rather than free-riding on them.

They also generate two related forms of free-riding. First, foreign patients receive innovation largely financed by U.S. purchasers at artificially suppressed prices, shifting welfare abroad. Second, foreign pharmaceutical firms and national economies gain a competitive advantage over their U.S. counterparts by capturing sales and operating lower-cost health systems without contributing proportionately to the research and development that makes those medicines possible.[15] Viewed this way, these pricing institutions resemble a coordinated international buyers’ cartel—conduct that would almost certainly attract antitrust scrutiny if private purchasers tried it.[16]

Two clarifications are important.

First, this trade-distortion framework does not require proof that foreign pricing institutions explicitly favor domestic firms over U.S. companies. Systematically suppressing pharmaceutical returns below competitive levels disadvantages U.S. innovators in major export markets even without domestic favoritism. These same policies have also weakened Europe’s own pharmaceutical sector, which has fallen from global leadership in the 1970s to a far more limited role today.[17]

Second, characterizing these institutions as ACMDs helps separate legitimate domestic health policy from trade-distorting conduct. Countries remain free to ration care, decline to reimburse particular treatments, or negotiate prices for their own populations. The problem arises when governments systematically structure those policies to avoid bearing any meaningful share of pharmaceutical-innovation costs while continuing to benefit from the resulting medicines.

III.   Price Controls, Innovation, and the MFN Mistake

Price controls create familiar problems in ordinary markets: shortages when the controlled price falls below the market-clearing level, lower quality when suppliers cut costs in ways regulators cannot easily monitor, and weaker investment as capital moves to less-regulated alternatives.

Pharmaceutical markets face all three risks, but their cost structure makes the innovation loss especially severe. Drug development requires large upfront investment, long timelines, and repeated failure. Once a medicine reaches market, the marginal cost of producing each additional dose is often low. The price charged during the patent-protected window therefore does more than cover today’s pills. It finances the full R&D portfolio, including the many drug candidates that fail before approval.

That structure makes simple “lower prices mean higher welfare” intuitions unreliable. Lower prices may improve access to medicines that already exist, but they also reduce the expected returns that determine whether future medicines get developed at all. MFN pricing compounds that problem by tying U.S. prices to foreign benchmarks already shaped by monopsony purchasing, health-technology assessment, and external reference pricing. It does not correct a distortion. It imports one, then magnifies it through the market that most strongly drives global pharmaceutical innovation.

A. Price Controls Reduce Pharmaceutical Innovation

Pharmaceutical R&D is a high-fixed-cost, low-marginal-cost business. Developing a new molecular entity—a drug built around a new active ingredient—costs billions of dollars, and more than 90% of clinical drug-development programs fail.[18] Once a successful molecule is approved, the marginal cost of manufacturing each pill or dose is small relative to price. The price charged during the patent-protected window therefore finances the entire research portfolio: the successful drug and the many failed candidates behind it.

That makes pharmaceutical pricing different from pricing in markets with flatter cost structures. A price control does not simply transfer surplus from producers to consumers. It compresses the signal that determines whether firms invest in high-risk, long-horizon research in the first place.

Ramsey-Boiteux pricing addresses this problem. When firms must recover large fixed or common costs, pricing at marginal cost usually cannot cover total costs. The second-best solution is to recover those costs through differential markups, with larger markups where demand is less elastic.[19] Pharmaceutical R&D fits that model. It is a global joint cost, and each market that uses the resulting medicine must help recover it through the difference between price and marginal cost.

Patricia Danzon applies that logic directly to pharmaceuticals. Differential pricing across countries, set roughly in inverse proportion to demand elasticity, is the second-best efficient way to finance global R&D. Once the sunk cost of research is recognized, the standard welfare case against pharmaceutical price discrimination largely dissolves.[20] Uniform pricing is not the efficient benchmark that MFN pricing and external reference pricing (ERP) implicitly assume. Forced convergence toward a single price—and especially toward the lowest price a monopsony buyer will accept—moves pricing away from the efficient structure, not toward it.

The usual rejoinder is that lower prices improve access to medicines that already exist, while the losses fall on future patients whose drugs never get developed. That is true, but it understates the asymmetry. The short-run gain is bounded by current consumption and current willingness to pay. The long-run loss is the present value of forgone drugs, including curative or disease-modifying therapies whose value to patients may far exceed their reimbursement price. This is the classic seen-and-unseen problem in pharmaceutical pricing: the access gain is visible and immediate; the innovation loss is diffuse, delayed, and counterfactual.

The empirical literature points in the same direction. Researchers have used demographic shifts, coverage expansions, reimbursement shocks, and cross-country institutional differences to test how expected revenue affects pharmaceutical innovation. The estimates differ, but the direction does not: higher expected revenue produces more innovation, and lower expected revenue produces less.

Daron Acemoglu and Joshua Linn isolate the effect of market size on drug development by using demographic changes—older age cohorts growing or shrinking over time—that were unrelated to scientific opportunity. Their preferred estimate implies that a 1% increase in potential market size produces roughly 4% to 6% more new drug entries.[21] Pierre Dubois and co-authors, using improved data and methods, estimate a lower elasticity of 0.23, implying that about $2.5 billion in additional expected revenue is needed, on average, to support one new chemical entity.[22]

More recent work estimating these effects by region finds that innovation by U.S.-headquartered firms responds to U.S. expected revenue with an elasticity of roughly 0.43, while innovation by European-headquartered firms responds to U.S. expected revenue with an elasticity of roughly 0.38.[23] That finding directly supports the point at issue here: compressing U.S. revenue places an outsized drag on global innovation.

Applied to the Congressional Budget Office’s projected 10% to 20% reduction in expected pharmaceutical revenue under H.R. 3-style negotiation, those elasticities imply large effects. On the conservative Dubois elasticity of 0.23, the expected reduction in new-drug entries would be roughly 2.3% to 4.6%. On the regional estimates, the same revenue cut would imply roughly 4.3% to 8.6% fewer new drugs developed by U.S. firms and 3.8% to 7.6% fewer new drugs developed by European firms.[24]

Other estimates imply still larger losses. Rexford Santerre and John Vernon simulate a U.S. price-control regime that would have limited drug-price growth to general Consumer Price Index inflation from 1981 to 2000.[25] They estimate that the regime would have reduced capitalized pharmaceutical R&D by $265 billion to $293 billion, in 2000 dollars, and produced about 38% fewer new drug innovations over the period.[26]

Santerre and Vernon also compare those losses with the consumer-surplus gains the same regime would have generated. Applying Frank Lichtenberg’s estimate of pharmaceutical research productivity in life-years saved, they estimate the value of lives lost from forgone innovation at $19.7 trillion to $21.8 trillion—more than an order of magnitude larger than the estimated consumer-surplus gain of $176 billion to $767 billion.[27] Reasonable analysts can dispute the precise magnitude. They cannot plausibly claim the effect is zero.

Two U.S. policy examples clarify the mechanism. Margaret Blume-Kohout and Neeraj Sood examine the introduction of Medicare Part D, which expanded coverage in drug categories with high Medicare enrollment shares and increased expected revenue in those categories. R&D rose significantly more in the affected categories after implementation.[28] The demand expansion produced an innovation response.

Craig Garthwaite, Rebecca Sachs, and Ariel Dora Stern study the mirror-image case: the Affordable Care Act’s Medicaid expansion. That policy increased the number of covered patients, but Medicaid reimbursement remained suppressed by statutory rebates. They find no detectable innovation response. Expanding coverage at a statutorily low price did not add enough expected revenue to redirect investment.[29] The contrast is direct: price, not coverage alone, drives the research response. MFN proposals resemble the Medicaid case, not the Medicare Part D case. They expand the reach of administered pricing while cutting reimbursement toward foreign benchmarks.

The strongest quasi-experimental evidence comes from a related Medicare setting just outside pharmaceuticals. Yunan Ji and Parker Rogers study Medicare-mandated price cuts in durable medical equipment, such as insulin pumps, CPAP machines, and oxygen concentrators. Across affected device categories, Medicare reimbursement fell by 61% on average over seven to 10 years relative to unaffected categories. Using a stacked difference-in-differences design—a method that compares affected and unaffected markets before and after a policy shock—they find that more-exposed manufacturers reduced R&D spending by 53%, Food and Drug Administration device submissions fell by 25%, U.S. patents fell by 75%, and revenue declined by 44%.[30]

That study is informative because devices and drugs share the relevant cost structure: low marginal production costs, large sunk development costs, and investment decisions driven by expected returns. Ji and Rogers estimate an elasticity of patenting to the Medicare price of 1.05, which they note mirrors the average elasticity found in the pharmaceutical literature. The study does not prove the specific international-propagation mechanism of MFN pricing. It does provide clean evidence for the broader mechanism: compressing the price-cost margin that finances fixed and sunk development costs reduces innovation.

Ji and Rogers also document a second effect directly relevant to the national-security premise of the Section 232 investigation: price compression can move production offshore. After the Medicare cuts, new entry fell by 49%, driven by a 90% decline in entry by U.S. manufacturers, while foreign manufacturer entry did not change significantly. Among incumbent firms, outsourcing to foreign manufacturers rose by 28%.

Quality deteriorated as production shifted. Repair and replacement rates for affected devices rose by 0.8 percentage points, a 200% increase over the pre-period rate. Manufacturers that outsourced production saw a 129% increase in hospital-reported adverse events, with larger increases for those using foreign contractors. In other words, a domestic price ceiling pushed manufacturing offshore and weakened the same domestic production capacity and supply-chain resilience that the Section 232 investigation purports to protect.[31]

A complementary reimbursement shock comes from Ali Yürükoglu, Eli Liebman, and David Ridley’s study of Medicare Part B reimbursement reductions for physician-administered drugs. Shortages rose significantly more for drugs with higher Medicare patient shares and larger reimbursement cuts, showing that price ceilings compress manufacturer margins in ways that directly affect supply.[32]

The economics are straightforward. The price-minus-marginal-cost wedge during the patent-protected window does one job: it amortizes the fixed and sunk research costs of the whole portfolio, including the many failures that never reach market. Firms make forward-looking R&D decisions based on the expected size of that wedge, not simply on the number of covered patients. Expanding coverage at suppressed reimbursement may leave the wedge largely unchanged. MFN attacks it directly.

Aggregate revenue-innovation elasticities also understate the cost of MFN-style price controls because they treat R&D as one undifferentiated quantity. Pharmaceutical research is better understood as a portfolio of real options: projects that firms may continue, expand, abandon, or sell as new information arrives. Each project has a low probability of approval, a long development horizon, and a payoff distribution whose right tail finances the rest of the portfolio. Capping the price of the most successful drugs truncates that right tail. It changes not only how much firms invest, but which projects they choose to pursue.

That composition effect matters. Projects whose expected value depends most heavily on upside returns—breakthrough therapies in oncology, neurology, and rare-disease areas—are likely to suffer more than incremental improvements to existing drugs. The frontier gets squeezed first.

The effect is especially important for small, pre-revenue biotechnology firms, which drive much early discovery. Their financing depends on the prospect of acquisition or licensing at a price that compensates investors for extraordinary risk. When policy caps the reward for that risk, the option value of early-stage investment falls, the financing market tightens, and the pipeline of acquisition candidates shrinks.[33]

That is why aggregate-spending arguments—claims that “innovation continues” after price reforms—do not answer the case against MFN. They confuse the level of R&D with its composition. A pharmaceutical ecosystem may continue producing incremental refinements after substantial revenue compression while producing fewer breakthrough therapies. The welfare cost of that shift is large because breakthrough therapies are precisely the medicines whose value to patients most exceeds their reimbursement price.

B. Why MFN Pricing Is the Wrong Tool

Even if one accepts the premise that U.S. branded-drug prices should come down, MFN pricing remains a particularly poor way to accomplish that goal. Three features make it especially problematic.

First, MFN pricing and ERP propagate the lowest administratively set price across markets. If a manufacturer knows that the price it accepts in a small country will become the ceiling for prices in much larger markets, its rational response is to delay launching the product, forgo the market altogether, or negotiate confidential price-volume agreements that conceal the effective price. Those responses are already concentrated in countries whose prices are widely referenced elsewhere.[34] A U.S. MFN policy would amplify the problem. Manufacturers could delay U.S. launches to preserve global pricing flexibility or renegotiate confidential foreign agreements, with the resulting costs borne by foreign patients.

Second, the Centers for Medicare & Medicaid Services (CMS) effectively acknowledged the practical shortcomings of MFN pricing in its own 2020 interim final rule for Medicare Part B.[35] Although the rule was enjoined, later withdrawn, and never implemented, the rulemaking record remains instructive. CMS recognized that some patients would lose access to their existing providers and could instead face longer travel, alternative therapies with lower efficacy or greater risk, or delayed or forgone treatment.[36] That admission is telling. It reflects the agency’s own conclusion that importing foreign pricing mechanisms also imports the access problems they create.

Finally, the Inflation Reduction Act’s “maximum fair price” negotiation program is not formally an MFN system, but it operates through similar economic mechanisms. Like ERP and MFN, it imposes administered prices on a defined set of high-revenue drugs after they have been on the market for a prescribed period. It therefore changes expected returns and influences which medicines firms choose to develop.

The early evidence is consistent with that prediction. Following enactment of the Inflation Reduction Act, monthly post-approval oncology trials for small-molecule drugs fell by 45.3%, compared with 32.5% for biologics—a pattern consistent with the law’s earlier price-setting timeline for small molecules, at seven years after approval versus 11 years for biologics.[37] Other projections estimate that the nine-year price-setting trigger will reduce small-molecule R&D by roughly 12%, resulting in 188 fewer small-molecule treatments and 79 fewer new small-molecule drugs over 20 years.[38] Layering an MFN benchmark on top of the Inflation Reduction Act would reinforce the same incentives and further skew investment away from the therapies most vulnerable to reduced expected returns.

IV.   ACMDs and Targeted Trade Enforcement

In April 2025, the U.S. Department of Commerce opened a Section 232 national-security investigation into imports of pharmaceuticals and pharmaceutical ingredients. Section 232 allows the department to investigate whether imports threaten national security, including by weakening domestic production capacity or supply-chain resilience.[39] Here, the department asked whether foreign-government practices distort U.S. pharmaceutical markets in ways that create those risks.

That inquiry correctly identifies foreign-pricing practices as a source of harm to U.S. pharmaceutical interests. The harder question is which policy tool addresses that harm without copying it.

MFN pricing fails that test. It imports foreign price suppression into U.S. domestic markets and replicates the squeeze on competitive returns that the Section 232 investigation identifies as a threat. A better response starts with the trade-policy literature on ACMDs.

The ACMD framework offers a disciplined way to identify which foreign practices warrant a U.S. trade response, measure the resulting harm, and distinguish trade-distorting conduct from legitimate domestic health policy. It also points toward a better remedy: targeted, temporary tariffs calibrated to the documented distortion, rather than broad sectoral tariffs or domestic price controls.

Used properly, ACMD analysis reframes the issue. The problem is not that foreign governments regulate health care. They may. The problem is that some pricing institutions systematically avoid bearing a meaningful share of global pharmaceutical R&D costs while consuming the medicines those investments produce. Corrective trade enforcement should target that free-riding at its source.

A. What Counts as an ACMD

An anticompetitive market distortion is a government intervention[40] that: (1) substantially lessens competition; (2) lacks an overriding legitimate public-policy justification, such as correcting a defined market failure or protecting public health and safety; and (3) gives certain private interests or entities an artificial competitive advantage over rivals.[41]

That definition separates ACMDs from ordinary regulation. Legitimate regulation can advance public goals. ACMDs skew the competitive landscape in favor of selected firms, sectors, or national interests.[42]

ACMDs also differ from purely private anticompetitive conduct. They arise from government action: rules, mandates, enforcement choices, procurement preferences, subsidies, or governance failures.[43] State backing makes them more durable than private restraints and often places them beyond the reach of ordinary antitrust enforcement.

Nor are ACMDs limited to familiar trade tools such as tariffs or broad subsidies.[44] They can include regulatory barriers that disproportionately impede foreign competitors, artificial cost reductions for favored firms, weak property-rights protection that undermines innovators, targeted subsidies without a clear public-policy rationale, discriminatory procurement rules, or advantages for state-owned enterprises.[45]

The common thread is government manipulation of market conditions to favor some economic actors over others. The result is less competition on the merits—and a market shaped more by political design than economic performance.[46]

B. Pharmaceutical ACMDs Abroad

Several foreign-government practices in the pharmaceutical sector satisfy the ACMD definition. The point is not to catalogue every distortion in international pharmaceutical pricing. It is to identify the kinds of institutions that ACMD analysis would mark as proper targets for U.S. trade enforcement.

Centralized negotiation is the first mechanism. Countries with national health-care systems or single-payer models use consolidated buying power to negotiate or impose strict price limits on medicines.[47] These systems create monopsony conditions: pharmaceutical firms face a dominant government buyer with market power no private purchaser could match. That suppresses the competitive-pricing dynamics that would otherwise discipline the market.[48]

A second mechanism operates through the evaluation of clinical evidence. Germany’s Federal Joint Committee, known as G-BA, narrows the endpoints manufacturers may use to show a drug’s value. Surrogate and intermediate measures—such as progression-free survival or HbA1c levels—support reimbursement only when sponsors clear demanding methodological hurdles. That depresses reimbursable value for therapies whose benefits take time to observe directly.[49]

The United Kingdom’s National Institute for Health and Care Excellence (NICE) held its £20,000–£30,000 cost-per-quality-adjusted-life-year threshold flat from 1999 until April 2026, even as U.K. consumer prices rose by roughly 90%. The recent move to a £25,000–£35,000 band recovers only part of that erosion.[50] France’s Comité Économique des Produits de Santé pairs each new reimbursement with a five-year volume contract whose clawbacks can recoup 50% to 70% of sales above the negotiated cap.[51] That caps upside while leaving firms to bear the downside risk.

Each mechanism, taken alone, can be defended as domestic cost containment. The cumulative cross-border effect is different. These systems refuse to internalize the global cost of pharmaceutical innovation and shift that cost—through the arithmetic of recoupment from the markets that remain—to U.S. patients.

External reference pricing (ERP) adds a third mechanism. ERP spreads suppression across jurisdictions by tying one country’s prices to another’s. Canada’s revised Patented Medicine Prices Review Board 11 basket, adopted in 2022, illustrates the design. Canada dropped the United States and Switzerland, its two highest-priced peer markets, and added six mid-priced countries in the Organization for Economic Cooperation and Development (OECD), mechanically lowering the comparator average used to benchmark Canadian prices.[52]

South Korea’s “two-waiver” framework goes further. A new drug must first be listed below the lowest price in the A7 advanced-economy basket, which includes the United States. The National Health Insurance Service then negotiates against prices in OECD countries outside the A7, removing U.S. prices from the reference set entirely.[53]

The structural point is simple: the lowest negotiated price in one jurisdiction becomes an input into price ceilings elsewhere. The downstream effect is a ratchet. A suppressed price in Country A lowers the comparator average for Country B, whose negotiated price then lowers the benchmark for Country C, and so on.

Foreign pharmaceutical distortions also extend beyond pricing. Weak intellectual-property enforcement, forced technology transfer, particularly in China, and targeted subsidies for upstream active pharmaceutical ingredients and generics can allow exporters to undercut U.S. producers below their unsubsidized costs.[54]

The common feature is that these practices go beyond domestic health-care cost containment. They shift the financial burden of pharmaceutical innovation onto markets that do not engage in the same suppression—chiefly, the United States.

C. Tariffication as a Targeted Remedy

Once policymakers identify a specific ACMD, the appropriate response is ACMD tariffication. Under this approach, the United States would apply a tariff to imports from the country responsible for the distortion, calibrated to neutralize the distortion’s estimated harm. The point is not punishment. It is to measure the harm caused by a trading partner’s domestic policy and correct it in a targeted way.[55]

Three showings should be required. First, the foreign policy must qualify as an ACMD: a government intervention that substantially lessens competition without a legitimate public-policy justification. Second, the intervention must produce a demonstrable anticompetitive effect, potentially assessed through tools analogous to merger analysis, such as the substantial-lessening-of-competition test. Third, the distortion must harm the domestic industry.[56] he showing should be rigorous, and the tariff should be bounded by the measured distortion rather than chosen for blunt deterrence.

The distinctive feature of ACMD tariffication is what it measures. Traditional trade remedies often turn on legal categories that only partly track the economic harm at issue. Antidumping duties, for example, rest on a price comparison between export prices and home-market prices or constructed costs. They do not ask why the price gap exists. An efficient foreign producer can be penalized for reasons unrelated to government intervention, while a firm whose government has distorted the market may escape if its export and home prices remain aligned.[57]

Countervailing duties are similarly formal. They target a defined class of subsidies involving a financial contribution, a benefit, and specificity. But they often stop at the boundary of regulatory design, discretionary administration, or governance failures that may produce the same competitive effects.

ACMD tariffication starts with the competitive harm itself. It asks how a government intervention changes the cost base or competitive position of firms exposed to it, sets the tariff at the level needed to neutralize that change, and remains agnostic about the legal form the intervention takes.[58]

That contrast with MFN pricing is central. MFN imports the foreign distortion into U.S. domestic markets. It pegs U.S. reimbursement to prices shaped by monopsony power and biased health-technology assessment, suppressing U.S. returns and the R&D incentives that depend on them.

ACMD tariffication does the opposite. It identifies the distortion at its source, quantifies its competitive effect, and pressures the responsible foreign jurisdiction to remove it. The tariff is bounded by the documented distortion, temporary as a corrective instrument, and conditional on the trading partner’s conduct.

This approach also fits the diplomatic reality of pharmaceutical trade better than broad tariffs. Many U.S. pharmaceutical imports by value originate in allied countries, especially in Europe. Broad sectoral tariffs would damage relationships and supply chains without clearly addressing the pricing practices driving the distortion. A targeted ACMD framework would identify particular institutions—G-BA’s surrogate-endpoint restrictions, NICE’s frozen quality-adjusted-life-year threshold, France’s clawback regime, Canada’s Patented Medicine Prices Review Board 11 basket, or South Korea’s two-waiver pathway—and give U.S. negotiators reform demands allied governments can actually address.

The result is a more coherent trade policy. It distinguishes among trading partners based on conduct, targets the source of the distortion, and avoids the blunt-force mistake of importing foreign price controls into the U.S. market.

D. Free-Riding, Not Domestic Policy

The ACMD framework does not require declaring another country’s health policy illegitimate. Cost containment is a legitimate objective of every health-care system, and countries with single-payer or heavily state-funded systems will inevitably adopt institutions to limit what they spend on medicines.

The ACMD inquiry asks a narrower question: Does a country’s pricing system bear a meaningful share of the cost of developing the medicines it reimburses, or does it shift those costs onto markets that do not use the same pricing mechanisms? That shift can occur through valuation methods that understate innovation, reimbursement rules that exclude R&D costs, or reference-pricing systems that benchmark only against already-suppressed foreign prices.

Viewed this way, the relevant foreign institutions are not merely domestic cost-containment measures. They are structured mechanisms for free-riding on U.S.-financed pharmaceutical innovation. Bringing a new medicine to market requires enormous investment in basic research, multiple phases of clinical trials, regulatory approval, and the many research programs that fail before a single product reaches patients. A pricing system that excludes those costs from its valuation of new medicines is not merely declining to pay for one drug. It is declining to pay its share of the global innovation portfolio that made the drug possible.

The arithmetic is straightforward. Whatever share of global R&D foreign purchasers decline to finance must be recovered in the markets that remain. By a wide margin, the United States is the largest of those markets.[59]

The operative question is whether a foreign pricing system creates competitive barriers for U.S. firms beyond what its stated regulatory objective can justify. A regime crosses into ACMD territory when its design systematically prevents innovators from earning competitive returns, shifts innovation costs onto foreign markets, or creates structural competitive advantages for other firms.

That conclusion does not depend on explicit favoritism toward domestic firms. Much of the European Union illustrates the opposite. Its pricing institutions have contributed to the long-term decline of Europe’s own innovative pharmaceutical sector, which has fallen from global leadership in the 1970s to a much smaller role in drug discovery today. Yet those same institutions continue to determine what U.S. innovators can earn in European markets.[60] The absence of domestic champions does not eliminate the distortion. It merely means domestic firms have been subject to it, too.

That point matters. A pricing regime that has already driven much of its own innovative pharmaceutical industry to shrink or relocate is not neutral toward U.S. firms. The same institutions that reduced domestic innovation continue to suppress the returns available to foreign innovators. Across multiple jurisdictions, those suppressed returns shift a disproportionate share of global R&D costs onto U.S. patients and purchasers. A framework that looks only for explicit discrimination would miss that pattern. ACMD analysis captures it by focusing on competitive effects rather than regulatory labels or stated intentions.

V.   Conclusion

There is a real pharmaceutical-pricing problem. Foreign-government practices impose measurable costs on U.S. patients, U.S. purchasers, and the firms that finance the global innovation pipeline. Through monopsony purchasing, biased health-technology assessment, and external reference pricing, foreign systems suppress branded-drug prices below competitive levels and shift a disproportionate share of global R&D costs onto the United States.

The onshoring framework goes wrong in its choice of remedy. Conditioning tariff relief on MFN pricing does not undo the foreign distortion. It propagates it. MFN ties U.S. reimbursement to prices produced by foreign monopsony bargaining and narrow technology assessment, then imports those suppressed benchmarks into the market that most strongly drives global pharmaceutical innovation.

The economic literature surveyed in this brief points in the same direction. Pharmaceutical R&D depends on large fixed investments, long timelines, high failure rates, and returns earned during a limited patent-protected window. Compressing expected revenue reduces the incentive to develop new medicines, especially high-risk therapies for rare diseases, oncology, neurology, and other frontier areas where patients often have few good alternatives. It can also push production offshore, weaken supply-chain resilience, and degrade quality—the very national-security concerns that Section 232 is meant to address.

Using trade authority to impose domestic price controls therefore leaves the foreign distortion intact and adds a domestic one alongside it. It lowers the revenue signal that finances innovation without requiring foreign governments to bear a fair share of the costs of the medicines they consume.

The better recommendation is structural. The Department of Commerce should remove the MFN-pricing condition from the company-specific onshoring framework so that Section 232 functions as a national-security tool, not a backdoor vehicle for domestic price regulation. The Office of the U.S. Trade Representative should address the foreign-pricing problem directly through ACMD-calibrated trade enforcement against the specific institutions that create the distortion, paired with bilateral and multilateral negotiations aimed at transparency, nondiscrimination, and proportionate contribution to global R&D financing.

The United States should confront foreign price suppression, not copy it. A policy that imports foreign price controls may look like hard bargaining. In practice, it would weaken the innovation base, punish future patients, and mistake the symptom for the disease.

[1] Procedures to Apply for Company-Specific Onshoring Agreements to Obtain Tariff Adjustments for Pharmaceuticals and Pharmaceutical Ingredients Under Proclamation 11020, 91 Fed. Reg. 26,989 (May 13, 2026), https://www.federalregister.gov/documents/2026/05/13/2026-09489/procedures-to-apply-for-company-specific-onshoring-agreements-to-obtain-tariff-adjustments-for [hereinafter BIS Notice].

[2] Int’l Ctr. for L. & Econ., Comments to USTR on Pharmaceutical Pricing 4 (2025), https://laweconcenter.org/resources/icle-comments-to-ustr-on-pharmaceutical-pricing [hereinafter ICLE USTR Comments]; see also Casey B. Mulligan & Tomas J. Philipson, Policy Brief: International Price Differences for Drug Prescriptions, Univ. of Chi. Initiative on Enabling Choice & Competition in Health Care (June 7, 2025), https://ecchc.economics.uchicago.edu/project/policy-brief-international-price-differences-for-drug-prescriptions; Off. of the Assistant Sec’y for Plan. & Eval., U.S. Dep’t of Health & Hum. Servs., Comparing U.S. and International Market Size and Average Pricing for Prescription Drugs, 2017–2022 1–2 (Issue Brief No. HP-2024-26, Dec. 2024), https://aspe.hhs.gov/sites/default/files/documents/4326cc7fe43bc11770598cf2a13f478c/international-market-size-prices.pdf (finding that the United States accounted for roughly 50% of worldwide prescription-drug revenue and 13% of volume in 2022, and 60% of revenue and 24% of volume among OECD countries).

[3] Council of Econ. Advisers, Exec. Off. of the President, Funding the Global Benefits to Biopharmaceutical Innovation 5–7 (Feb. 2020), https://trumpwhitehouse.archives.gov/wp-content/uploads/2020/02/Funding-the-Global-Benefits-to-Biopharmaceutical-Innovation.pdf (estimating that the United States generated more than 70% of OECD patented-pharmaceutical profits while accounting for approximately 34% of OECD GDP at purchasing-power parity).

[4] Andrew W. Mulcahy et al., International Prescription Drug Price Comparisons: Current Empirical Estimates and Comparisons with Previous Studies, RAND Corp., RR-2956-ASPE, at xiii (2021), https://www.rand.org/pubs/research_reports/RR2956.html (finding U.S. prescription-drug prices averaged 2.56 times those in comparison countries overall and 3.44 times higher for branded drugs, based on 2018 IQVIA MIDAS data).

[5] U.S. Food & Drug Admin., Generic Drugs (Mar. 2025), https://www.fda.gov/drugs/buying-using-medicine-safely/generic-drugs.

[6] Tomas J. Philipson, Deyu Zhang & Qi Zhao, International Comparison of Prices for Drug Prescriptions 1 (Policy Brief, Univ. of Chi. Initiative on Enabling Choice & Competition in Health Care, 2025), https://ecchc.economics.uchicago.edu/files/2025/06/Policy-Brief-International-Price-Differences-for-Drug-Prescriptions-June-7.docx.pdf.

[7] Although branded innovative drugs account for only about 10% of U.S. prescriptions, they represent roughly 88% of prescription-drug spending. Ass’n for Accessible Medicines, 2025 U.S. Generic & Biosimilar Medicines Savings Report (2025), https://accessiblemeds.org/resources/reports/2025-savings-report. Generic medicines likewise account for a high share of prescription volume across OECD countries, indicating that international price differences primarily reflect branded-drug prices rather than differences in generic uptake. Org. for Econ. Coop. & Dev., Health at a Glance 2023 (2023), https://www.oecd.org/content/dam/oecd/en/publications/reports/2023/11/health-at-a-glance-2023_e04f8239/7a7afb35-en.pdf.

[8] See Council of Econ. Advisers, supra note 3, at 5–8.

[9] Eur. Fed’n of Stat. in Pharm. Indus., German Benefit Assessment—White Paper: Latest Methodological Requirements in the German Benefit Assessment 4, 39 (May 2025), https://www.efspi.org/wp-content/uploads/2025/05/GermanHTA_WhitePaper_2025.pdf. “Key surrogate” and “intermediate endpoints” are clinical-trial measures used to estimate a treatment’s effect on patient outcomes. Surrogate endpoints, such as tumor shrinkage in cancer trials, stand in for direct clinical outcomes, such as survival. Intermediate endpoints, such as lower blood pressure or HbA1c levels in diabetes, reflect early changes that may predict long-term benefits. Researchers often use these markers when direct outcomes take years to observe, but regulators and payers should rely on them only when evidence links them to patient-relevant effects.

[10] Jacoline Bouvy, Should NICE’s Cost-Effectiveness Thresholds Change?, NICE Blog (Dec. 13, 2024), https://www.nice.org.uk/news/blogs/should-nice-s-cost-effectiveness-thresholds-change; John Appleby, Nancy Devlin & David Parkin, NICE’s Cost-Effectiveness Threshold, 335 Brit. Med. J. 358 (2007), https://pmc.ncbi.nlm.nih.gov/articles/PMC1952475/pdf/bmj-335-7616-edit-00358.pdf; Bank of Eng., Inflation and the 2% Target, https://www.bankofengland.co.uk/monetary-policy/inflation (last visited June 25, 2025) (£1 in 1999 was worth £1.92 as of June 25, 2025); Nat’l Inst. for Health & Care Excellence, Changes to NICE’s Cost-Effectiveness Thresholds Confirmed (Apr. 2026), https://www.nice.org.uk/news/articles/changes-to-nice-s-cost-effectiveness-thresholds-confirmed (raising the threshold bands to £25,000–£35,000, effective April 2026); Ass’n of the Brit. Pharm. Indus., Why the Government Must Urgently Raise the NICE Cost-Effectiveness Threshold (Oct. 2025), https://www.abpi.org.uk/media/blogs/2025/october/why-the-government-must-urgently-raise-the-nice-cost-effectiveness-threshold (estimating an inflation-adjusted equivalent of approximately £56,800).

[11] Marc A. Rodwin, What Can the United States Learn from Pharmaceutical Spending Controls in France? (Commonwealth Fund Issue Brief, Nov. 11, 2019), https://www.commonwealthfund.org/publications/issue-briefs/2019/nov/what-can-united-states-learn-drug-spending-controls-france.

[12] Teresa A. Reguly & Eileen M. McMahon, PMPRB Regulations: New Basket of Comparator Countries Has Arrived, Absent Guidance, Torys (July 7, 2022), https://www.torys.com/en/our-latest-thinking/publications/2022/07/pmprb-regulations.

[13] Off. of the Parliamentary Budget Officer (Can.), Canadian Patented Drug Prices: Gauging the Change in Reference Countries, Report RP-2223-008-S (June 14, 2022), https://www.pbo-dpb.ca/en/publications/RP-2223-008-S–canadian-patented-drug-prices-gauging-change-in-reference-countries (estimating that the PMPRB11 basket would have reduced 2018 patented-drug spending by 19%, or approximately C$2.8 billion).

[14] Seung-Rae Yu, Improving the Reimbursement Process for New Drugs: A Case Study of a Two-Waiver System in South Korea, 31 J. Evaluation Clinical Prac. e70074 (2025), https://pmc.ncbi.nlm.nih.gov/articles/PMC11959314.

[15] See Shanker A. Singham, Market Distortions and How Best to Deal with Them: Sugar Sector Case Study, Competere (2024), https://shankersingham.com/wp-content/uploads/2024/10/Market-Distortions-and-How-Best-to-Deal-with-Them_-Sugar-Sector-Case-Study.pdf.

[16] Because this conduct would constitute foreign state action, it would not qualify as legally cognizable cartel behavior, except perhaps in a World Trade Organization proceeding. The analogy helps identify the nature of the harm.

[17] See Kristian Stout, The Risks of Adopting Foreign Price Controls for Drugs, Truth on the Mkt. (May 9, 2025), https://truthonthemarket.com/2025/05/09/the-risks-of-adopting-foreign-price-controls-for-drugs; Joseph Golec & John A. Vernon, European Pharmaceutical Price Regulation, Firm Profitability, and R&D Spending, Nat’l Bureau of Econ. Rsch., Working Paper No. 12676 (Nov. 2006), https://www.nber.org/papers/w12676 (documenting EU–U.S. research-and-development divergence from 1986 to 2004); Stephen Ezell, Lessons from Europe’s Loss of Biopharma Leadership, and Its Attempts to Recover, Info. Tech. & Innovation Found. (Mar. 18, 2026), https://itif.org/publications/2026/03/18/lessons-from-europes-loss-of-biopharma-leadership-and-attempts-to-recover.

[18] Joseph A. DiMasi, Henry G. Grabowski & Ronald W. Hansen, Innovation in the Pharmaceutical Industry: New Estimates of R&D Costs, 47 J. Health Econ. 20 (2016), https://doi.org/10.1016/j.jhealeco.2016.01.012 (estimating mean out-of-pocket R&D costs of $1.395 billion and capitalized costs of $2.558 billion per approved new compound); Duxin Sun, Wei Gao, Hongxiang Hu & Simon Zhou, Why 90% of Clinical Drug Development Fails and How to Improve It?, 12 Acta Pharmaceutica Sinica B 3049 (2022), https://pmc.ncbi.nlm.nih.gov/articles/PMC9293739.

[19] See Frank P. Ramsey, A Contribution to the Theory of Taxation, 37 Econ. J. 47 (1927); Marcel Boiteux, Sur la gestion des monopoles publics astreints à l’équilibre budgétaire, 24 Econometrica 22 (1956), translated in On the Management of Public Monopolies Subject to Budgetary Constraints, 3 J. Econ. Theory 219 (1971); William J. Baumol & David F. Bradford, Optimal Departures from Marginal Cost Pricing, 60 Am. Econ. Rev. 265 (1970).

[20] See Patricia M. Danzon, Price Discrimination for Pharmaceuticals: Welfare Effects in the US and the EU, 4 Int’l J. Econ. & Bus. 301 (1997), https://www.tandfonline.com/doi/abs/10.1080/758523212 (arguing that conventional welfare analysis of price discrimination does not apply to pharmaceuticals once the sunk, global joint costs of R&D are considered and that Ramsey pricing—setting prices inversely proportional to demand elasticity—is the second-best efficient approach); Patricia M. Danzon & Adrian Towse, Differential Pricing for Pharmaceuticals: Reconciling Access, R&D and Patents, 3 Int’l J. Health Care Fin. & Econ. 183 (2003), https://doi.org/10.1023/A:1025384819575 (arguing that Ramsey-style differential pricing is the second-best efficient means of financing the global joint costs of pharmaceutical R&D and that parallel trade and external reference pricing undermine it); Patricia M. Danzon, Adrian Towse & Jorge Mestre-Ferrandiz, Value-Based Differential Pricing: Efficient Prices for Drugs in a Global Context, 24 Health Econ. 294 (2015), https://doi.org/10.1002/hec.3021 (extending the framework to support value-based differential pricing as the efficient global pricing structure).

[21] Daron Acemoglu & Joshua Linn, Market Size in Innovation: Theory and Evidence from the Pharmaceutical Industry, 119 Q.J. Econ. 1049 (2004), https://doi.org/10.1162/0033553041502144.

[22] Pierre Dubois, Olivier de Mouzon, Fiona Scott Morton & Paul Seabright, Market Size and Pharmaceutical Innovation, 46 RAND J. Econ. 844 (2015), https://onlinelibrary.wiley.com/doi/10.1111/1756-2171.12113.

[23] Pierre Dubois, Pharmaceutical Regulation and Incentives for Innovation in an International Perspective tbl. 4 (Toulouse Sch. of Econ., Working Paper No. 1674, Dec. 2025), https://www.tse-fr.eu/sites/default/files/TSE/documents/doc/wp/2025/wp_tse_1674.pdf.

[24] Cong. Budget Off., Effects of Drug Price Negotiation Stemming from Title I of H.R. 3, the Lower Drug Costs Now Act of 2019, on Spending and Revenues Related to Part D of Medicare 1, 5 (Oct. 11, 2019), https://www.cbo.gov/system/files/2019-10/hr3ltr.pdf (estimating that H.R. 3 would reduce manufacturer revenue by $0.5 trillion to $1 trillion over a decade, or roughly 7% to 20% of the projected $5 trillion to $7 trillion U.S. pharmaceutical-manufacturer revenue base).

[25] Rexford E. Santerre & John A. Vernon, Assessing Consumer Gains from a Drug Price Control Policy in the U.S., Nat’l Bureau of Econ. Rsch., Working Paper No. 11139 (Feb. 2005, rev. Feb. 2006), https://www.nber.org/papers/w11139 (estimating that a CPI-capped price regime from 1981 to 2000 would have reduced capitalized R&D by $265 billion to $293 billion, cut new-drug approvals by roughly 38%, and imposed lives-lost costs more than 28 times larger than the consumer-surplus gains).

[26] Id.

[27] Id.

[28] Margaret E. Blume-Kohout & Neeraj Sood, Market Size and Innovation: Effects of Medicare Part D on Pharmaceutical Research and Development, 97 J. Pub. Econ. 327 (2013), https://doi.org/10.1016/j.jpubeco.2012.10.003.

[29] Craig Garthwaite, Rebecca Sachs & Ariel Dora Stern, Which Markets (Don’t) Drive Pharmaceutical Innovation? Evidence from U.S. Medicaid Expansions, Nat’l Bureau of Econ. Rsch., Working Paper No. 28755 (May 2021), https://www.nber.org/papers/w28755.

[30] Yunan Ji & Parker Rogers, The Long-Run Impacts of Regulated Price Cuts: Evidence from Medicare 4, Nat’l Bureau of Econ. Rsch., Working Paper No. 33083 (2024), https://www.nber.org/papers/w33083 (reporting that manufacturers more exposed to Medicare price cuts saw a 44% revenue decline, 25% fewer Food and Drug Administration device submissions, 75% fewer U.S. patents, an implied Medicare price elasticity of 1.05, and 53% lower R&D spending); id. at 3 (finding an average price reduction of 61% over seven to 10 years); id. at 5 & n.3 (noting that the elasticity “mirrors the average elasticity in the pharmaceutical industry” and describing prior pharmaceutical evidence as theoretical, simulation-based, and correlational).

[31] Id. at 4 (finding a 49% decline in new entrants, driven by a 90% decline in entry by U.S. manufacturers, with no significant change among foreign manufacturers; a 28% increase in outsourcing to foreign manufacturers among incumbent manufacturers; a 0.8 percentage-point increase in device repair and replacement rates—equal to 200% of the pre-period rate; and a 129% increase in hospital-reported adverse events among manufacturers that outsourced production, with larger increases among those using foreign contractors).

[32] Ali Yurukoglu, Eli Liebman & David B. Ridley, The Role of Government Reimbursement in Drug Shortages, 9 Am. Econ. J.: Econ. Pol’y 348 (2017), https://www.aeaweb.org/articles?id=10.1257/pol.20160035.

[33] See David Bardey, Antoine Bommier & Bruno Jullien, Retail Price Regulation and Innovation: Reference Pricing in the Pharmaceutical Industry, 29 J. Health Econ. 303 (2010), https://doi.org/10.1016/j.jhealeco.2009.11.001 (modeling that reference pricing reduces overall R&D intensity and delays or discourages follow-on, or “me-too,” entry; finding theoretically ambiguous effects on first-in-class innovation, but reduced patient welfare under the authors’ calibration; and distinguishing between major first-in-class innovation and minor incremental innovation); Acemoglu & Linn, supra note 21 (developing the foundational market-size mechanism); Dubois, supra note 23 (presenting international evidence on the elasticity of pharmaceutical innovation with respect to expected market size, including regional estimates).

[34] See Patricia M. Danzon, Y. Richard Wang & Liang Wang, The Impact of Price Regulation on the Launch Delay of New Drugs—Evidence from Twenty-Five Major Markets in the 1990s, 14 Health Econ. 269 (2005), https://www.nber.org/papers/w9874; Margaret K. Kyle, Pharmaceutical Price Controls and Entry Strategies, 89 Rev. Econ. & Stat. 88 (2007), https://www.jstor.org/stable/40043076.

[35] Most Favored Nation Model, 85 Fed. Reg. 76,180 (Nov. 27, 2020), https://www.federalregister.gov/documents/2020/11/27/2020-26037/most-favored-nation-mfn-model; see also Most Favored Nation Model, 86 Fed. Reg. 73,986 (Dec. 29, 2021), https://www.federalregister.gov/documents/2021/12/29/2021-28225/most-favored-nation-mfn-model (rescinding the 2020 interim final rule, effective Feb. 28, 2022).

[36] Most Favored Nation Model, supra note 35, at 76,199.

[37] Hanke Zheng, Julie A. Patterson & Jonathan D. Campbell, Early Impact of the Inflation Reduction Act on Small Molecule vs. Biologic Post-Approval Oncology Trials, 3 Health Affs. Scholar qxaf152 (Aug. 28, 2025), https://doi.org/10.1093/haschl/qxaf152.

[38] Thomas J. Philipson, Yier Ling & Ruiquan Chang, The Impact of Price Setting at 9 Years on Small Molecule Innovation Under the Inflation Reduction Act (Univ. of Chi. Initiative on Enabling Choice & Competition in Health Care Policy Brief, Oct. 2023).

[39] Notice of Request for Public Comments on Section 232 National Security Investigation of Imports of Pharmaceuticals and Pharmaceutical Ingredients, 90 Fed. Reg. 15,951 (Apr. 16, 2025), https://www.federalregister.gov/documents/2025/04/16/2025-06587/notice-of-request-for-public-comments-on-section-232-national-security-investigation-of-imports-of.

[40] Singham, supra note 15.

[41] Id.

[42] Growth Comm’n., 2024–25 Growth Presidency Memo: A Research Report from the Growth Commission (Nov. 13, 2024), https://www.growth-commission.com/wp-content/uploads/2024/11/Growth-Commission-Presidency-Report-for-Capitol-event.pdf.

[43] World Bank, Unfair Advantage: Distortive Subsidies and Their Effects on Global Trade (2023), https://thedocs.worldbank.org/en/doc/0534eca53121c137d3766a02320d0310-0430012022/related/Unfair-Advantage-Distortive-Subsidies-and-Their-Effects-on-Global-Trade-2023.pdf.

[44] Growth Comm’n, supra note 42.

[45] Eric Fruits, Non-Tariff Barriers, Int’l Ctr. for L. & Econ. (Feb. 27, 2025), https://laweconcenter.org/resources/non-tariff-barriers; see also World Bank, supra note 43.

[46] Singham, supra note 15.

[47] Council of Econ. Advisers, supra note 3.

[48] Id.

[49] Eur. Fed’n of Stat. in Pharm. Indus., supra note 9.

[50] Bouvy, supra note 10.

[51] Rodwin, supra note 11.

[52] Reguly & McMahon, supra note 12; Off. of the Parliamentary Budget Officer (Can.), supra note 13.

[53] Yu, supra note 14.

[54] See Kristian Stout, Comments of the International Center for Law & Economics on the Section 232 Investigation into Pharmaceuticals, Int’l Ctr. for L. & Econ. (May 7, 2025), https://laweconcenter.org/wp-content/uploads/2025/05/232-Pharma-Comment.pdf.

[55] Id.

[56] Id.

[57] Id.

[58] Id.

[59] Council of Econ. Advisers, supra note 3; ICLE USTR Comments, supra note 2.

[60] Stout, supra note 17.

ICLE Issue Brief