


The Effects of Payment-Fee Price Controls on Competition and Consumers

Executive Summary
Payment networks connect buyers with sellers. Success hinges on attracting sufficient participation on both sides of the market. Card issuers offer rewards, insurance, fraud prevention, and other benefits that create incentives for use. Issuers can do so, in part, because they receive an “interchange” fee from acquiring banks, who in turn charge a fee to merchants (the “merchant discount rate” or MDR).
Price controls on these fees interfere with the delicate balance of the two-sided market ecosystem. Interchange-fee caps in various jurisdictions have led banks to increase other fees (such as monthly account fees and annual card fees), reduce card benefits, and adjust product offerings. As a result, consumers—especially those with lower incomes—face higher costs and reduced access to financial services. These costs generally exceed by a wide margin any consumer savings from reduced prices. Price controls on MDR, seen recently in India and Costa Rica, have also distorted the market by impeding competition and favoring larger players (big-box merchants and internet-platform-service providers, which are able to monetize in other ways), while harming smaller entities and traditional banks.
Instead of imposing price controls, governments should reduce regulatory barriers and provide core public goods, such as courts of law and identity registers, which enable competition, market-driven innovation, and financial inclusion.
I. Introduction
Payment networks are integral to modern economies, facilitating the seamless exchange of goods and services across vast distances and among unfamiliar parties. This issue brief considers the effects of regulatory interventions on such networks, looking in particular at price controls on interchange fees and merchant discount rates (MDRs). While intended to reduce costs for merchants and consumers, the evidence shows these price controls impede competition and harm consumers.
For a payment network to be self-sustaining, there must be sufficient participation on both sides of the market—i.e., by both buyers and sellers. If too few sellers accept a particular form of payment, buyers will have little reason to adopt it. Likewise, if too few buyers hold a particular form of payment, sellers will have little reason to accept it. At the same time, payment networks must cover their costs of operation, including credit risk, monitoring costs, fraud risk, and investments in innovation. Payment networks typically address these two problems (optimizing participation and covering costs) simultaneously through various fees and incentives, thereby maximizing value to all participants.
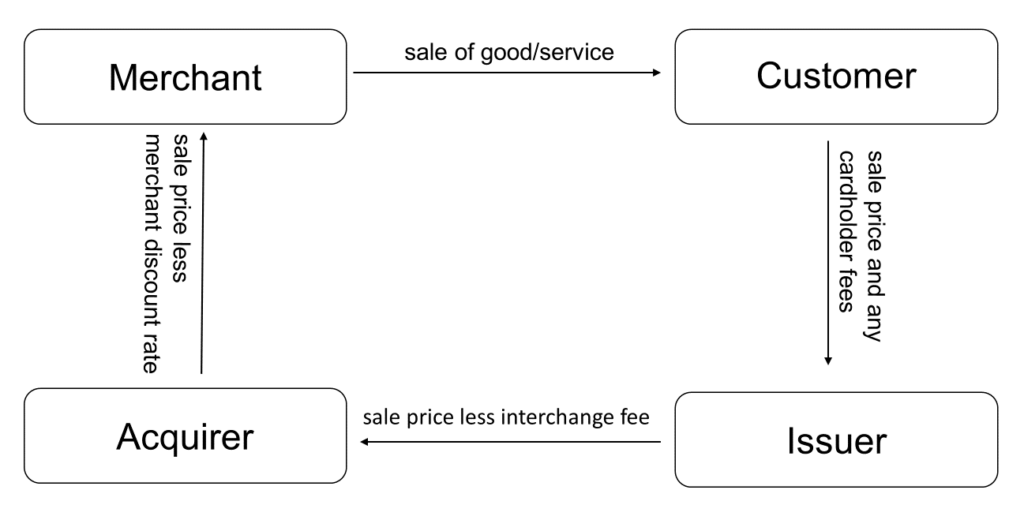
Maximizing value often entails that one side of the market (usually, the merchants) subsidizes the other side (consumers) through an “interchange fee” received by the issuing bank from the acquiring bank. The interchange fee covers a much wider range of costs than the operational costs mentioned above. Specifically, it typically includes issuer costs associated with collection and default, as well as many of the additional benefits that cardholders typically receive, including various kinds of insurance and such rewards as cashback rewards and airline miles. The interchange fee, in turn, is typically covered by fees charged by the merchant’s acquiring bank (see Figure 1), known as the merchant discount rate (MDR) or merchant service charge (MSC).
FIGURE 1: Transactions in a Four-Party Card Model
Caps on interchange fees and/or MDR are price controls, which have the effect of reducing the incentive to supply the product subject to that control. Many countries have introduced price controls on interchange fees, and these have been much-studied. Section II presents a summary of the evidence of the effects of price controls on interchange fees.
By contrast, relatively few countries have imposed price controls on MDR and the effects of such price controls have rarely been scrutinized.[1] Section III thus offers an initial assessment of such effects. Finally, Section IV offers conclusions and policy recommendations.
II. Interchange-Fee Price Controls
This section considers the effects of price controls on interchange fees. While more than 30 jurisdictions have imposed such price controls, we focus on the jurisdictions for which we have the best evidence.[2] While each jurisdiction and each price control is unique, the effects appear to generalize readily. Therefore, the limited selection of jurisdictions here should be seen as typical examples.
This section begins with a brief description of the specific form price controls took in each jurisdiction. That is followed by a description of the response by (issuing) banks. Finally, the effects on consumers are evaluated.
A. How Jurisdictions Have Capped Interchange Fees
Various jurisdictions have taken a variety of approaches to the imposition of price controls on interchange fees. The following are examples of some of the better-studied interventions.[3] These examples show what happens in the period immediately following the introduction of interchange-fee price controls. While some price controls have been repealed or changed, their effects are most transparent in the immediate aftermath of their implementation, and the inclusion of these examples thus remains instructive.
1. Spain
Spain imposed caps on interchange fees for both credit and debit cards through agreements with merchant associations and card schemes in two distinct phases: the first ran from 1999 to 2003, the second from 2006 to 2010.[4] During the first phase, caps were initially set at 3.5%, falling to 2.75% in July 2002. Caps were much lower during the second phase and were lower for large banks (over €500 million), whose credit-card interchange fees were capped at 0.66% in 2006, falling to 0.45% by 2010, than for small banks (under €100 million), whose credit-card interchange fees were capped at 1.4% in 2006, falling to 0.79% in 2010.
2. Australia
The Reserve Bank of Australia (RBA) introduced caps on interchange fees for credit cards in 2003 under a “cost-based framework,” which adjusted interchange fees based on processing costs. As a result, the RBA aimed in the first instance to reduce interchange fees by 40%, from an average of 0.95% in 2002 to 0.6% in 2003.[5]
3. United States
Under a provision of the Dodd-Frank Wall Street Reform Act of 2010 known commonly as the “Durbin amendment,” the U.S. Federal Reserve imposed caps on debit-card interchange fees for large banks, as well as routing requirements for all debit-card issuers.[6] As a result, debit-card-interchange fees fell by about 50% for large banks almost immediately. Interchange fees on debit cards issued by smaller banks and credit unions initially fell by a smaller amount, and interchange fees on single-message (PIN) debit cards have now fallen to similar levels as PIN debit cards issued by larger banks.[7]
4. European Union
In 2015, the EU capped fees at 0.2% for debit cards and 0.3% for credit cards.[8] These are hard caps with few exceptions, and those rates rapidly became the norm for most transactions (with the exception of some domestic schemes that offer lower rates).[9]
B. Response by Banks
Faced with potentially large losses of revenue, banks adopted numerous strategies to limit their losses, including, most notably:
1. Increasing other fees and interest
Banks commonly increased other fees, including annual-card fees, account-maintenance fees, late fees, and interest on loans and credit cards. For example, in the United States, banks raised monthly account-maintenance fees and increased the minimum balance needed for a fee-free account.[10] In the EU, banks increased other fees and interest rates.[11]
2. Reduced card benefits
Banks reduced the rewards and benefits associated with those cards that were subject to price controls. This included reducing or eliminating cashback rewards, points, and other incentives that were previously funded, in part, by interchange fees. For example, U.S. banks subject to the Durbin amendment generally eliminated debit-card rewards. In Australia, meanwhile, the average value of rewards fell by about 30%.[12]
3. Adjusted product offerings
Some banks shifted their focus to products not affected by the caps. In the United States, where the Durbin amendment applied only to debit cards, banks shifted their promotional efforts toward credit cards. In Australia, banks issued “companion” cards on three-party networks that were initially exempt. In some EU jurisdictions, banks have promoted business credit cards, which are exempt.[13]
C. The Effects on Consumers
Interchange-fee caps make the vast majority of consumers worse off, especially those with lower incomes. This outcome primarily arises from several interconnected factors:
1. Higher costs
As noted, in response to the reduction in interchange fees, banks have increased a range of fees, including higher account-maintenance charges (and higher minimum-balance requirements to qualify for free accounts); larger overdraft fees; increased interest rates on loans and credit cards; and higher annual fees on credit cards. These increased fees have disproportionately affected lower-income consumers, who may struggle more to maintain minimum-balance requirements or avoid overdrafts.[14]
2. Loss of insurance, other services, and the financial benefits of rewards
The reductions in rewards and other benefits on cards subject to interchange-fee caps amount to a direct pecuniary loss for millions of consumers. Often, these losses far exceed the reduction in interchange fees that cause them. A case in point is insurance: credit-card-issuing banks are typically able to negotiate volume-based discounts on insurance, which means they pay less than would an individual seeking his or her own policy. But if there simply is not sufficient revenue to cover the continuation of such benefits, issuers are forced to withdraw it, as many issuers in the EU have done.
3. Lost access to financial services
Larger account fees and increased minimum-balance requirements have resulted in an increase in unbanked and underbanked households in the United States, particularly among lower-income consumers.[15] As a result, more households have become reliant on check-cashing services, payday loans, and other high-cost financial services.
4. Limited savings passed through to consumers
While larger merchants save on transaction fees, due to the lower interchange fees, these savings are not fully passed on to consumers in the form of lower prices. The degree of pass-through can vary greatly, depending on the competitive dynamics of various retail sectors. But in most cases, merchants have passed through the reduced costs associated with lower interchange fees at a lower rate than banks have passed through losses in fee revenue, in the form of higher-priced accounts, cards and services, and reductions in rewards. As such, consumers are, on net, worse off.[16]
While the intended goal of interchange-fee caps may be to reduce merchants’ costs and generate savings for consumers, in practice, consumers see few, if any, retail-price reductions, even as they experience significantly reduced benefits from their payment cards, as well as increased banking costs.
III. MDR Caps
This section explores the effects of caps on merchant discount rates. As noted earlier, it is difficult to draw broad conclusions of the kind we were able to draw in Section II on the effects of interchange-fee caps. This is both because of the relative rarity of MDR caps, as well as the fact that they have—in the two cases examined here—coincided with other policy changes and broader economic and social phenomena that simultaneously have had significant effects on the payments system. The two case studies nonetheless offer salutary lessons about the problems inherent in imposing price controls on payment fees.
A. India
India’s MDR caps, which date back to 2012, were put in place as part of a series of interventions whose broad objective was to increase access to finance and shift transactions from paper to electronic money. These initiatives included (in order of implementation): a digital ID (launched in 2010); a domestic-card scheme and debit card (RuPay) with MDR caps (implemented in 2012); and a domestic faster-payments system (UPI, launched in 2016) with zero MDR for most transactions. This section focuses primarily on the implementation of UPI, its MDR caps, and the implications for consumers, merchants, and payment-service providers.
1. Mobile payments in India and the role of MDR
Until 2015, the two largest companies offering mobile phone-based payment services in India were Paytm and MobiKwik, which both relied on MDR to facilitate their expansion. MDR enabled these services to offer consumers cashback rewards and other incentives. MobiKwik signed up 1.5 million merchants and 55 million registered users by 2015,[17] while Paytm had 100 million registered accounts in 2015.[18]
Payment services are the core of Paytm’s business, contributing 58% of its revenue in Q3 2023 (although it fell slightly in Q1 2024).[19] These services arise from users making payments from mobile wallets stored on Paytm’s platform, using debit cards and credit cards. The company charges merchants an MDR that ranges from 0.4% to 2.99% of the transaction amount, depending on the payment type (for small-to-medium-size businesses).[20] MobiKwik, meanwhile, generates revenue from commissions and advertisements from its Zaak payment-gateway franchise subsidiary,[21] as well as loans—including short-term credit, buy-now-pay-later, and personal loans—and investment advice.[22] Of note, Zaak is also highly reliant on MDR as a source of revenue.[23]
2. Enter UPI
In 2016, the National Payments Corporation of India (NPCI), a public-private partnership between the Reserve Bank of India (RBI) and the Indian Banks Association (IBA), launched the Unified Payment Interface (UPI), an open-source interoperable API that facilitates real-time transfers between individuals with accounts at participating banks that have integrated the API into their smartphone apps.[24] NPCI also built its own app, BHIM UPI, that is available directly and can also be white-labelled by banks and PSPs.[25]
By any measure, UPI has been enormously successful. In April 2024, more than 80% of all retail payments by volume and about 30% by value were made using UPI.[26]
PhonePe, which launched in 2016, and Google Pay, which launched in India in 2017, have from the outset operated exclusively on UPI. PhonePe launched as a wholly owned subsidiary of Flipkart, India’s largest online marketplace. This enabled it to leverage the marketplace’s then-100 million users, as well as subsequent growth of Flipkart’s user base.[27] Although PhonePe has now separated from Flipkart, it is still owned by Walmart, which bought Flipkart in 2018, and is thus able to leverage the retail giant’s merchant ecosystem.
Google, meanwhile, was able to leverage its brand recognition and to monetize Google Pay through a combination of advertising and its local online marketplace. It is noteworthy that, in a 2023 survey, Google was ranked the top brand in India, followed by Amazon and YouTube (which is owned by Google).[28]
PhonePe is now the largest payment network in India, with approximately 200 million active users; Paytm ranks second, with approximately 100 million active users;[29] Google Pay is third, with about 67 million active users;[30] and MobiKwik is fourth, with 35 million active monthly users in 2023.[31]
In April 2024, PhonePe and Google Pay together represented 87% of UPI transactions by volume and value (Table 1). Paytm was the third-largest payment app on UPI, representing 8% of transactions and 6% of value. The fourth-largest app was CRED, which is a members-only app aimed at individuals with higher credit scores.[32] Together, these top four apps represented 96.5% of transaction volume and 95.5% of transaction value. The remaining apps combined all had less than 5% market share between them, and none had more than 1% individually.[33]
TABLE 1: UPI Transactions by App, April 2024
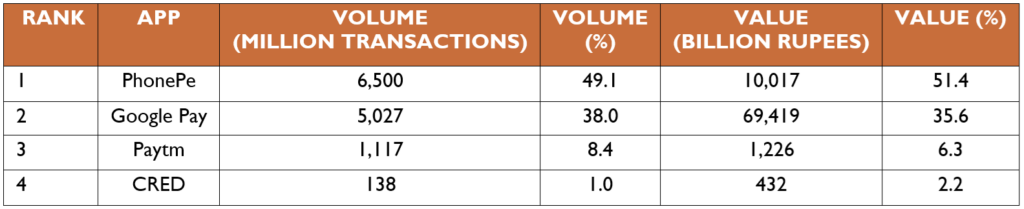
SOURCE: NPCI
Since UPI transactions represented about 80% of India’s retail volume, this means that the combination of Google Pay and PhonePe represented more than 70% of all non-cash retail transactions in India by volume.
3. How zero MDR distorts competition
The reason such as high proportion of UPI payments come from the top four apps is that their operators have been able to monetize transactions and encourage adoption on both sides of the market without relying on MDR. NPCI prohibits MDR for most applications (exceptions are pre-paid debit and rechargeable mobile wallets, which since April 2023 have been permitted to charge up to 1.1% in MDR).[34]
These MDR caps on UPI have, however, made it less economically viable for payment-services providers (PSPs) to offer such incentives for consumers. Indeed, Paytm has recently switched from offering cashback rewards to consumers to offering cashback rewards to merchants—presumably because it realizes it has to compete with other payments ecosystems that run on UPI and therefore charge zero MDR.[35]
Like the interchange-fee caps explored in Section II, MDR caps change the economics of payment systems by reducing the ability of card issuers and payment-app operators to balance the two sides of the market through cross-subsidies. These effects became most visible after UPI went live in 2016 with zero MDR.
As noted, both PhonePe and Google Pay were able to leverage existing networks to attract both merchants and users (Flipkart, in the case of PhonePe, and Google’s search engine and other products, in the case of Google Pay). Having built a significant base of participants on both sides of the market, the companies have been able to monetize their payment systems through product advertising, upselling of related products, and in-app transactions, thereby reinforcing the network effects.
While MDR is prohibited on UPI, PhonePe usually charges a 2% transaction fee for its online-payment gateway service. Acting as a payment gateway carries little counterparty or credit risk, and is typically offered in other jurisdictions for a small flat fee. The 2% charged by PhonePe therefore effectively goes straight to the bottom line, or can be used to cross-subsidize participation, thereby further enhancing the PSPs’ market share. Indeed, in July 2023, PhonePe began offering its payment gateway for free to new customers (an own-side subsidy: existing users subsidize new users).[36]
Google Pay, meanwhile, has offered cashback incentives for use of the service on apps within its own (Android) ecosystem.[37] This encourages the use of Google Pay in much the same way that traditional rewards offer incentives to use other payment systems. The merchant beneficiaries are, however, limited to participants in its app system, for which Google charges a 30% transaction fee.
While Paytm’s share of UPI is low compared to PhonePe and Google Pay, it can monetize such transactions both by providing add-on financial services, such as insurance and investments, as well as through the MDR it charges on non-UPI transactions.[38] Paytm has also built a rewards program for merchants that encourages participation in its marketplace.[39]
Finally, CRED has partnered with a range of high-end brands to undertake targeted advertising, the revenue from which enables CRED to offer rewards to users of various kinds, including cashback rewards.[40]
While UPI has likely contributed to increased financial inclusion, the prohibition on MDR for most types of transactions has distorted the entire market toward merchants affiliated with the large mobile-payment ecosystems (PhonePe, Google, and Paytm) and a payment network targeted at higher-income customers (CRED). Meanwhile, this has come at a huge price for the majority of banks and other PSPs that facilitate payments on UPI. The Payments Council of India estimates that its members lose 55 billion rupees (US$660 million) annually as a result of the zero MDR on UPI and RuPay transactions.[41] This is effectively a transfer from those banks to the companies whose apps monetize UPI transactions.
India’s government partly offsets this loss through a subsidy to UPI participants of between 15 and 25 billion rupees.[42] But this amounts to a subsidy to PhonePe, Google, Paytm, and CRED, which is odd. Moreover, experience with other systems that impose restrictions on payment-transaction fees suggests that banks will seek to recover these losses via other fees.[43] To the extent that such additional fees fall on lower-income account holders, the effect on financial inclusion is likely to be negative.
India’s government has also announced that it intends to cap the share of UPI transactions for any one service provider to 30% by the end of 2024, with the goal of reducing the dominance of Google Pay and PhonePe.[44] It remains unclear how such caps will be implemented, but it is almost certain that whatever mechanism is adopted would cause other harmful effects. Indeed, there is something slightly absurd about introducing a cap on participation in order to address the perverse consequences of caps on MDR.
Given that the MDR caps are the cause of Google Pay and PhonePe’s combined dominance, a far better solution would be to lift those caps. Indeed, based on the evidence adduced here, removing the MDR caps would likely unleash competition and innovation. Instead of being dominated by a few giant players, UPI would become what its visionaries intended: an inclusive platform that facilitates participation by a wide range of players. The platform could then further expand access to payments, enhance smaller merchants’ ability to compete, and improve financial inclusion.
B. Costa Rica
Costa Rica introduced price controls on payment cards in 2020. Legislative Decree No. 9831 authorized the Central Bank of Costa Rice (BCCR) to regulate fees charged by service providers on “the processing of transactions that use payment devices and the operation of the card system.”[45] The legislation’s stated objective was “to promote its efficiency and security, and guarantee the lowest possible cost for affiliates.” BCCR was tasked with issuing regulations that would ensure the rule is “in the public interest” and guarantee that fees charged to “affiliates” (i.e., merchants) are “the lowest possible … following international best practices.”
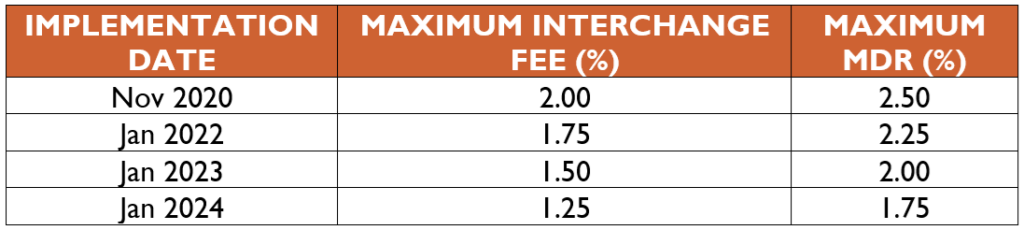
Starting Nov. 24, 2020, BCCR set maximum interchange fees for domestic cards at 2.00% and maximum MDR at 2.50%. Over a four-year period, BCCR has gradually ratcheted down both MDR and interchange-fee caps, as shown in Table 2.
TABLE 2: Interchange Fee and MDR Caps in Costa Rica, 2020-2024
An unusual feature of BCCR’s regulation is the simultaneous cap on both MDR and interchange fees, which has the effect of limiting revenue to both acquiring banks and issuing banks. This has likely reduced investments by issuers and acquirers and led to lower levels of system efficiency and speed, and possibly to increased fraud.
It is also worth noting that both interchange fees and MDR vary according to merchant type and location, in large part because the risk of fraud varies among different types of merchants. There is a danger, therefore, that imposing price controls on both MDR and interchange fees could make it unprofitable for acquirers to process payments for some riskier merchants. In other words, in its attempt to reduce merchant costs, BCCR may inadvertently (but predictably) prohibit some merchants from being able to accept payment cards. This is neither efficient, nor is it in the public interest.
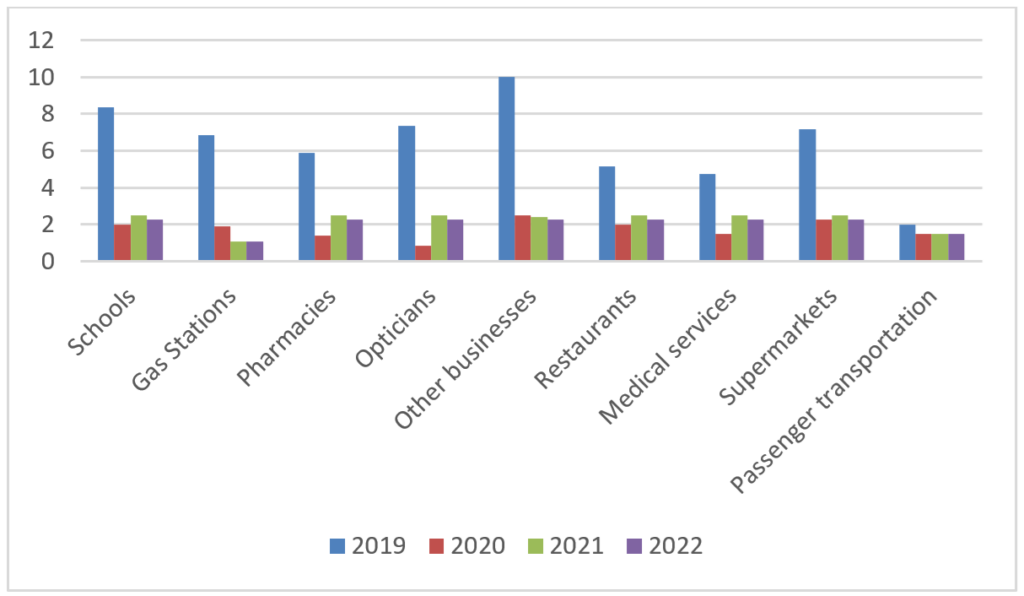
Looking at the trajectory of the mean and median MDRs for various merchant categories in Costa Rica before price controls were imposed (as shown in Figures 1 and 2), MDRs were, on average, quite high (a mean of about 4%) but the medians were even higher (ranging from 4% to 10% for all categories except gas stations and passenger transportation). This significant difference between the mean and median MDRs suggests either that a large proportion of merchants represented a particularly high risk (e.g., from fraud and/or chargebacks) or that there was a lack of competition among acquiring banks (and perhaps even collusion)—or perhaps both.
FIGURE 2: Mean MDR for Various Merchants in Costa Rica, 2019-2022 (%)
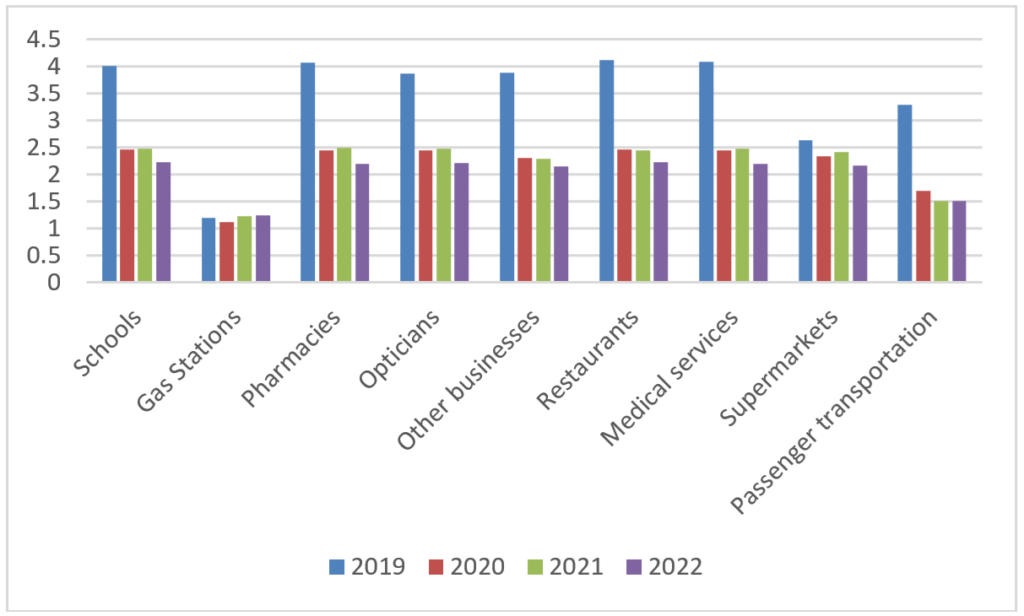
SOURCE: Author’s calculations based on data from BCCR
If the previously high MDRs were a function of merchant-associated risk, capping MDRs would be expected to cause acquiring banks to drop some merchants. The data, however, show that the number of merchants increased from 2020 to 2022, which suggests that lack of competition among acquirers is a more likely explanation.[46]
FIGURE 2: Median MDR for Various Merchants in Costa Rica, 2019-2022 (%)
SOURCE: Author’s calculations based on data from BCCR
To the extent that these high MDRs reflect a lack of competition among acquiring banks, the appropriate response would have been to seek to understand what was causing this lack of competition and then to remedy that directly. For example, if the lack of competition arose from regulations imposed by BCCR, it would be incumbent on BCCR to modify its regulations to reduce barriers to competition. Capping MDR does not address the underlying problem; indeed, it likely makes it worse, by inhibiting acquirers from being able to differentiate themselves on price or quality.
IV. Conclusions and Policy Implications
In competitive markets without price controls, prices evolve in ways that tend to maximize value for all participants. In payment networks, interchange fees play an important role, enabling issuers to develop appealing and competitive products with features that range from cashback rewards to travel insurance. This encourages customers to use the card or app in question, which, in turn, benefits merchants who see greater sales. The fees also facilitate associated innovations, such as AI-based fraud detection, contactless payments, and online token vaults.
When governments impose price controls on payment fees—whether in the form of caps on interchange fees or on MDR, or both—bank revenue from card transactions falls. Issuers (and acquirers, in the case of MDR caps) respond by increasing other fees, reducing card benefits, and reducing investments in improvements. The ecosystem becomes distorted, unbalanced, and fundamentally less competitive.
The beneficiaries of such interventions tend to be larger merchants and other participants in the system (including larger financial technology, or “fintech,” players). These players can leverage and reinforce their loyal customer base, and often charge fees for services (such as payment gateways) that are as high or higher than interchange fees, and even MDR.
India’s government recognizes the anticompetitive nature of its MDR caps, but appears to think that this is best-addressed by introducing new caps on participation. Costa Rica, meanwhile, appears to have suffered from a lack of competition among merchant acquirers, which drove up the cost of MDR—leading it to introduce caps on MDR.
But, in both cases, regulation is the problem, not the solution. In India’s case, various regulations—especially the caps on MDR for UPI transactions, as well as the government subsidies to UPI—have resulted in heavy concentration and impeded competition from fintech startups. Meanwhile, in Costa Rica, existing regulatory barriers likely impeded competition in the acquisition market, which enabled acquirers to charge excessive rates. This has prompted BCCR to impose MDR and interchange-fee caps that, in turn, have impeded competition in issuance.
The biggest losers from such interventions tend to be lower-income consumers, who end up paying higher bank fees and leaving—or not entering—the banking system. But there are many other losers, including the majority of consumers, and the many potential competitors that are excluded from participation because they are unable to monetize their investments via interchange and/or MDR fees.
Governments should not distort markets in these ways. Quite the opposite: they should be as neutral as possible. Rather than imposing price controls on payment systems, they might look to review and repeal existing government-created barriers to financial inclusion. These could include licensing requirements for banks that limit competition and enable acquirers to charge abnormal MDR rates.
In other words, rather than layer additional distorting regulations atop existing regulations, further harming the operation of complex private-market ecosystems, they should look for ways to reduce government-imposed barriers to competition. And, generally, they should limit themselves to the production of genuine public goods, such as courts and identity registers. Doing so will enable greater participation, competition, and innovation, which will drive financial inclusion.
[1] Other jurisdictions, such as Denmark and China, also have imposed restrictions on MDR/MSC, but this author was unable to adduce sufficient information about the nature and effects of these interventions to develop substantive analyses.
[2] We draw extensively on our earlier review: Julian Morris, Todd J. Zywicki, & Geoffrey A. Manne, The Effects of Price Controls on Payment-Card Interchange Fees: A Review and Update, (ICLE White Paper 2022-03-04 & George Mason L. & Econ. Research Paper No. 22-07, 2022), https://papers.ssrn.com/sol3/papers.cfm?abstract_id=4063914. See also Fumiko Hayashi & Jesse Leigh Maniff, Public Authority Involvement in Payment Card Markets: Various Countries, August 2020 Update, Fed. Res. Bank of Kan. City (August 2020), available at https://www.kansascityfed.org/documents/6660/PublicAuthorityInvolvementPaymentCardMarkets_VariousCountries_August2020Update.pdf.
[3] Morris et al., supra note 2.
[4] Juan Iranzo, Pascual Fernández, Gustavo Matías, & Manuel Delgado, The Effects of the Mandatory Decrease of Interchange Fees in Spain (Munich Personal RePEc Archive, MPRA Working Paper No. 43097, 2012), available at https://mpra.ub.unimuenchen.de/43097/1/MPRA_%20paper_43097.pdf.
[5] Press Release, Reform of Credit Card Schemes in Australia, Res. Bank of Austl. (Aug. 27, 2002), https://www.rba.gov.au/media-releases/2002/mr-02-15.html.
[6] H.R.4173 – Dodd-Frank Wall Street Reform and Consumer Protection Act, s.1075(a)(3); Debit Card Interchange Fees and Routing; Final Rule, 76 Fed. Reg. 43,393-43,475, (Jul. 20, 2011).
[7] Todd J. Zywicki, Geoffrey A. Manne, & Julian Morris, Unreasonable and Disproportionate: How the Durbin Amendment Harms Poorer Americans and Small Businesses, Int’l Cntr For L. & Econ. (Apr. 25, 2017), available at https://laweconcenter.org/wp-content/uploads/2017/08/icle-durbin_update_2017_final-1.pdf.
[8] Regulation (EU) 2015/751 of the European Parliament and of the Council of 29 April 2015 on Interchange Fees for Card-Based Payment Transactions, 2015, O.J. (L 123) 1, 10-11 (hereinafter “IFR”).
[9] Ferdinand Pavel et al., Study on the Application of the Interchange Fee Regulation: Final Report 89, European Commission Directorate-General for Competition (2020), https://op.europa.eu/s/zKl2.
[10] Mark D. Manuszak & Krzysztof Wozniak, The Impact of Price Controls in Two-Sided Markets: Evidence From US Debit Card Interchange Fee Regulation (Bd. of Governors of the Fed. Res. Sys. Fin. & Econ. Discussion Series, Working Paper No. 2017-074, 2017); Vladimir Mukharlyamov & Natasha Sarin, Price Regulation in Two-Sided Markets: Empirical Evidence From Debit Cards (SSRN Working Paper, 2019), https://papers.ssrn.com/sol3/papers.cfm?abstract_id=3328579.
[11] Interchange Fee Regulation (IFR) Impact Study Report, Edgar Dunn & Co. (Jan. 21, 2020), https://www.edgardunn.com/reports/interchange-fee-regulation-ifr-impact-assessment-study-report.
[12] Iris Chan, Sophia Chong, & Stephen Mitchell, The Personal Credit Card Market in Australia: Pricing Over the Past Decade, Res. Bank Of Austl. Bull. (2012), available at https://www.rba.gov.au/publications/bulletin/2012/mar/pdf/bu-0312-7.pdf.
[13] IFR, supra note 8, Art. 1(3)(a).
[14] Mukharlyamov & Sarin, supra note 10.
[15] Id.
[16] Iranzo et al., supra note 4 at 34-37; Ian Lee, Geoffrey A. Manne, Julian Morris, & Todd J. Zywicki, Credit Where It’s Due: How Payment Cards Benefit Canadian Merchants and Consumers, and How Regulation Can Harm Them, Macdonald-Laurier Institute 1, 27 (2013); Morris, Zywicki, & Manne, supra note 7 at 23-29.
[17] Shabana Hussain, MobiKwik’s Journey and the Path Ahead, Forbes India (Apr. 6, 2015), http://forbesindia.com/article/work-in-progress/mobikwiks-journey-and-the-path-ahead/39905/1 .
[18] Paytm Reaches 100 Million Users, Business World (Aug. 11, 2015), https://businessworld.in/article/paytm-reaches-100-million-users–84698.
[19] Press Release, Paytm’s Earning’s Release for Quarter and Year Ending March 2024, Paytm (May 22, 2024), available at https://paytm.com/document/ir/financial-results/Paytm_Earnings-Release_INR_Q4_FY24.pdf.
[20] Paytm’s Pricing, Paytm, https://business.paytm.com/pricing (last visited Jun. 07, 2024).
[21] MobiKwik Consolidated Financial Statement, MobiKwik (2023), available at https://documents.mobikwik.com/files/investor-relations/statements/mobikwik/Consolidated-Financials-Sept2023.pdf; Report on the Audit of Special Purpose Interim Financial Statements, Tattvam & Co. (Dec. 31, 2023), available at https://documents.mobikwik.com/files/investor-relations/statements/zaakpay/zaakpay-financials-sept2023.pdf; Subsidiary Financials, MobiKwik, https://www.mobikwik.com/ir/subsidiary-financials (last visited Jun. 7, 2024); Status of Applications Received from Online Payment Aggregators (PAs) Under Payment and Settlement Systems Act, 2007, Res. Bank of India, https://www.rbi.org.in/Scripts/bs_viewcontent.aspx?Id=4236 (last updated Jun. 1, 2024).
[22] Id., Res. Bank of India.
[23] Pratik Bhakta, MobiKwik to Add Muscle to Its Payment Gateway Business, The Economic Times (May 13, 2017), https://economictimes.indiatimes.com/small-biz/startups/mobikwik-shifting-focus-to-payment-gateway-space/articleshow/58655807.cms?from=mdr.
[24] Unified Payments Interface (UPI), National Payments Corporation of India (2024), https://www.npci.org.in/what-we-do/upi/product-overview; UPI Live Members, National Payments Corporation of India (2024), https://www.npci.org.in/what-we-do/upi/live-members.
[25] BHIM, https://www.bhimupi.org.in (last visited Jun. 7, 2024); Pratik Bhakta, BHIM to Be the Right Platform for Small Banks to Enter Payment Space, The Economic Times (Feb. 3, 2017), https://economictimes.indiatimes.com/small-biz/security-tech/technology/bhim-to-be-the-right-platform-for-small-banks-to-enter-payment-space/articleshow/56945820.cms?from=mdr.
[26] Payment System Indicators, Res. Bank of India (Apr. 2024), https://www.rbi.org.in/Scripts/PSIUserView.aspx?Id=35.
[27] Alnoor Peermohamed, Flipkart Grows User Base to 100 million, Business Standard (Jun. 6, 2024), https://www.business-standard.com/article/companies/flipkart-grows-user-base-to-100-million-116092100216_1.html.
[28] Gaurav Laghate, Google, Amazon, YouTube Top India brands, Livemint (Jun. 27, 2023), https://www.livemint.com/companies/news/google-amazon-youtube-top-india-brands-11687887362055.html.
[29] Paytm Surpasses 100 Million Monthly Transacting Users for the First Time in Q3 FY24, Livemint (Jan. 22, 2024), https://www.livemint.com/companies/news/paytm-surpasses-100-million-monthly-transacting-users-for-the-first-time-in-q3-fy24-11705932856486.html.
[30] Michael G. William, How Many People Use Google Pay in 2023?, Watcher Guru (Sep. 14, 2023), https://watcher.guru/news/how-many-people-use-google-pay-in-2023#google_vignette.
[31] MobiKwik Continues Profitable Streak for Second Quarter in a Row, The Economic Times (Oct. 05, 2023), https://economictimes.indiatimes.com/tech/technology/mobikwik-continues-profitable-streak-for-second-quarter-in-a-row/articleshow/104183594.cms?from=mdr.
[32] CRED, https://cred.club/ipl (last visited Jun. 07, 2024).
[33] Eight other apps had between 0.25% and 0.75% of transaction volume and/or value: Amazon Pay, ICICI Bank Apps, Fampay, Kotak Mahindra Bank Apps, HDFC Bank Apps, WhatsApp, BHIM, and Yes Bank Apps.
[34] Upasana Taku, NPCI’s 1.1% Interchange Fee on UPI Payments Via Wallet – The Watershed Moment for Fintech in India, The Times of India (May 15, 2023), https://timesofindia.indiatimes.com/blogs/voices/npcis-1-1-interchange-fee-on-upi-payments-via-wallet-the-watershed-moment-for-fintech-in-india.
[35] Pratik Bhakta, Inside Paytm’s Cashback Offers for Retailers, The Economic Times (Jul. 7, 2023), https://economictimes.indiatimes.com/tech/startups/in-through-the-other-door-inside-paytms-cashback-offers-for-retailers/articleshow/101551675.cms?from=mdr.
[36] Mayur Shetty, PhonePe Cuts Fees for Payment Gateway Services, The Times of India (Jun. 14, 2023), https://timesofindia.indiatimes.com/business/india-business/phonepe-cuts-fees-for-payment-gateway-services/articleshow/100986915.cms.
[37] Manish Singh, Google’s New Plan to Push Google Pay in India: Cashback Incentives in Android Apps, TechCrunch (May 16, 2019), https://techcrunch.com/2019/05/16/google-pay-india-android-cashback.
[38] Paytm, supra note 20.
[39] An Overview of Merchant Discount Rate Charges, AMLegals (Mar. 15, 2024), https://amlegals.com/an-overview-of-merchant-discount-rate-charges.
[40] CRED Pay, https://cred.club/cred-pay/onboarding (last visited Jun. 7, 2024).
[41] Roll Back Zero Merchant Discount Rate on UPI, Rupay Debit Card Payments, Industry Body Payments Council of India Writes to Finance Ministry, The Indian Express (Jan. 23, 2022), https://indianexpress.com/article/business/banking-and-finance/merchant-discount-rate-rollback-on-upi-rupay-debit-cards-7737229.
[42] Pratik Bhakta, Fintechs Await Government Word on MDR Subsidy Allocation, The Economic Times (Feb. 22, 2024), https://economictimes.indiatimes.com/tech/technology/fintechs-await-government-support-for-promoting-digital-payments-for-current-fiscal/articleshow/107891943.cms?from=mdr.
[43] Morris et al., supra note 2.
[44] Ajinkya Kawale, NPCI to Review by End of Year Decision on 30% UPI Market Share Cap, Business Standard (Apr. 19, 2024), https://www.business-standard.com/markets/news/npci-to-review-30-market-share-cap-decision-by-year-end-124041901059_1.html.
[45] Author’s translations from the Spanish original are approximate.
[46] Fijación Ordinaria de Comisiones Máximas del Sistema de Tarjetas de Pago, Banco Centrale de Costa Rica (Oct. 2023), 12, available at https://www.bccr.fi.cr/en/payments-system/DocCards/Estudio_tecnico_2023_fijacion_ordinaria_comisiones_CP.pdf.